3.2.3 Paper histology subsets
3.2.3.1 STLMS
There are 36886 genes and 53 samples in the dataset.
At least some samples or genes look not suitable for the co-expression analysis. After removing them, there remain 36778 genes and 53 samples.
##    Power SFT.R.sq slope truncated.R.sq  mean.k. median.k. max.k.
## 1      1    0.330 -3.94          0.960 5160.000  5.06e+03 8280.0
## 2      3    0.730 -3.00          0.986  328.000  2.86e+02 1150.0
## 3      5    0.917 -2.50          0.993   44.900  3.07e+01  354.0
## 4      7    0.971 -2.13          0.984   10.300  4.79e+00  206.0
## 5      9    0.966 -1.80          0.971    3.480  9.75e-01  140.0
## 6     11    0.960 -1.58          0.966    1.590  2.40e-01  103.0
## 7     13    0.942 -1.45          0.947    0.897  6.84e-02   78.8
## 8     15    0.984 -1.32          0.984    0.577  2.16e-02   62.2
## 9     17    0.981 -1.28          0.980    0.406  7.28e-03   52.8
## 10    19    0.935 -1.30          0.931    0.303  2.62e-03   48.2
## 11    21    0.901 -1.33          0.896    0.237  9.84e-04   44.6
## 12    23    0.894 -1.33          0.884    0.192  3.83e-04   41.8
## 13    25    0.881 -1.33          0.863    0.160  1.53e-04   39.5
## 14    27    0.861 -1.36          0.844    0.136  6.30e-05   37.5
## 15    29    0.859 -1.35          0.835    0.118  2.60e-05   35.9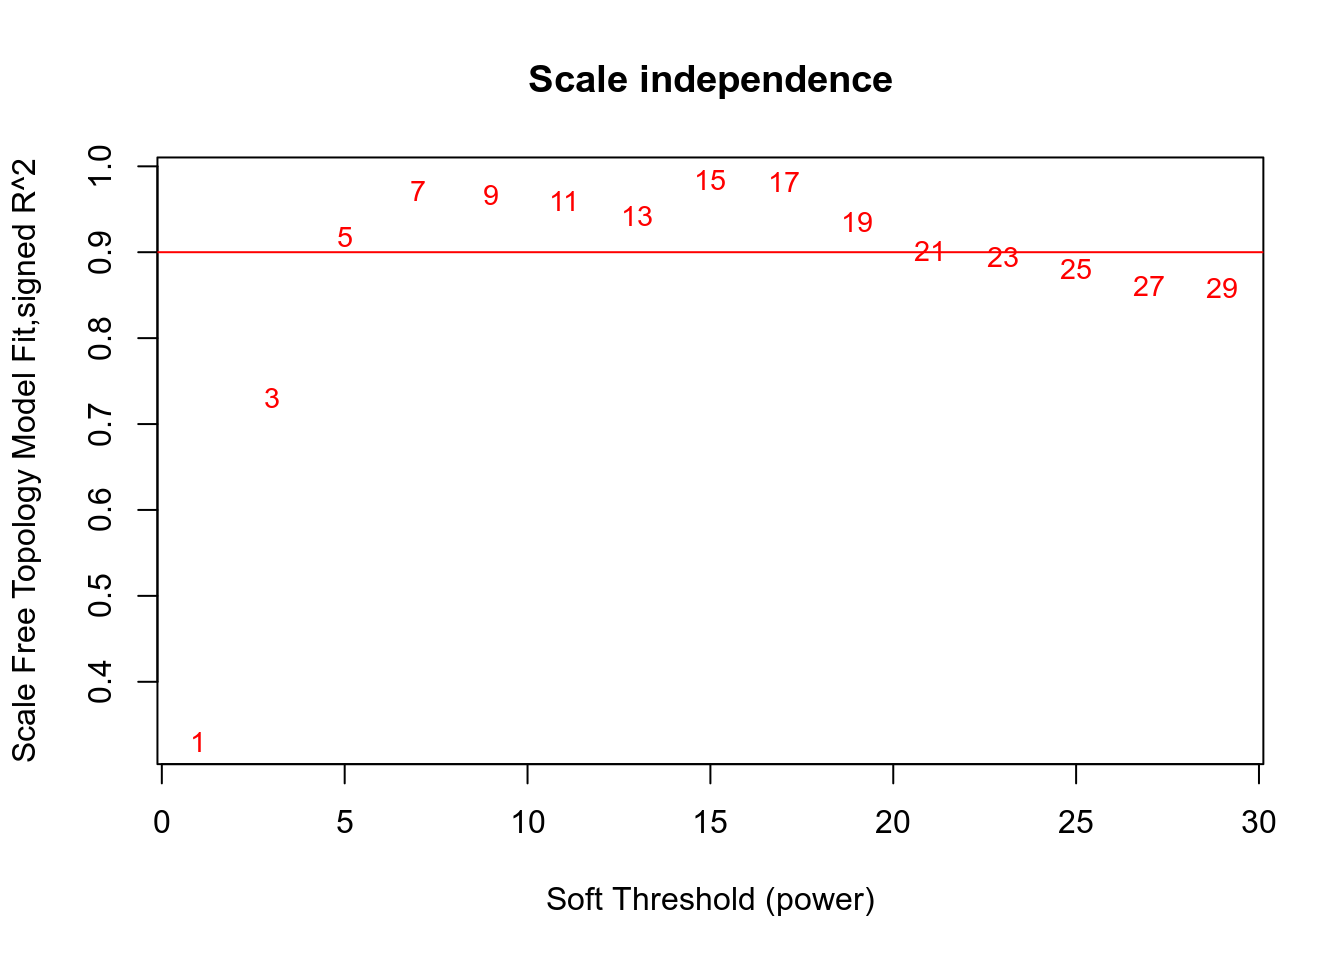
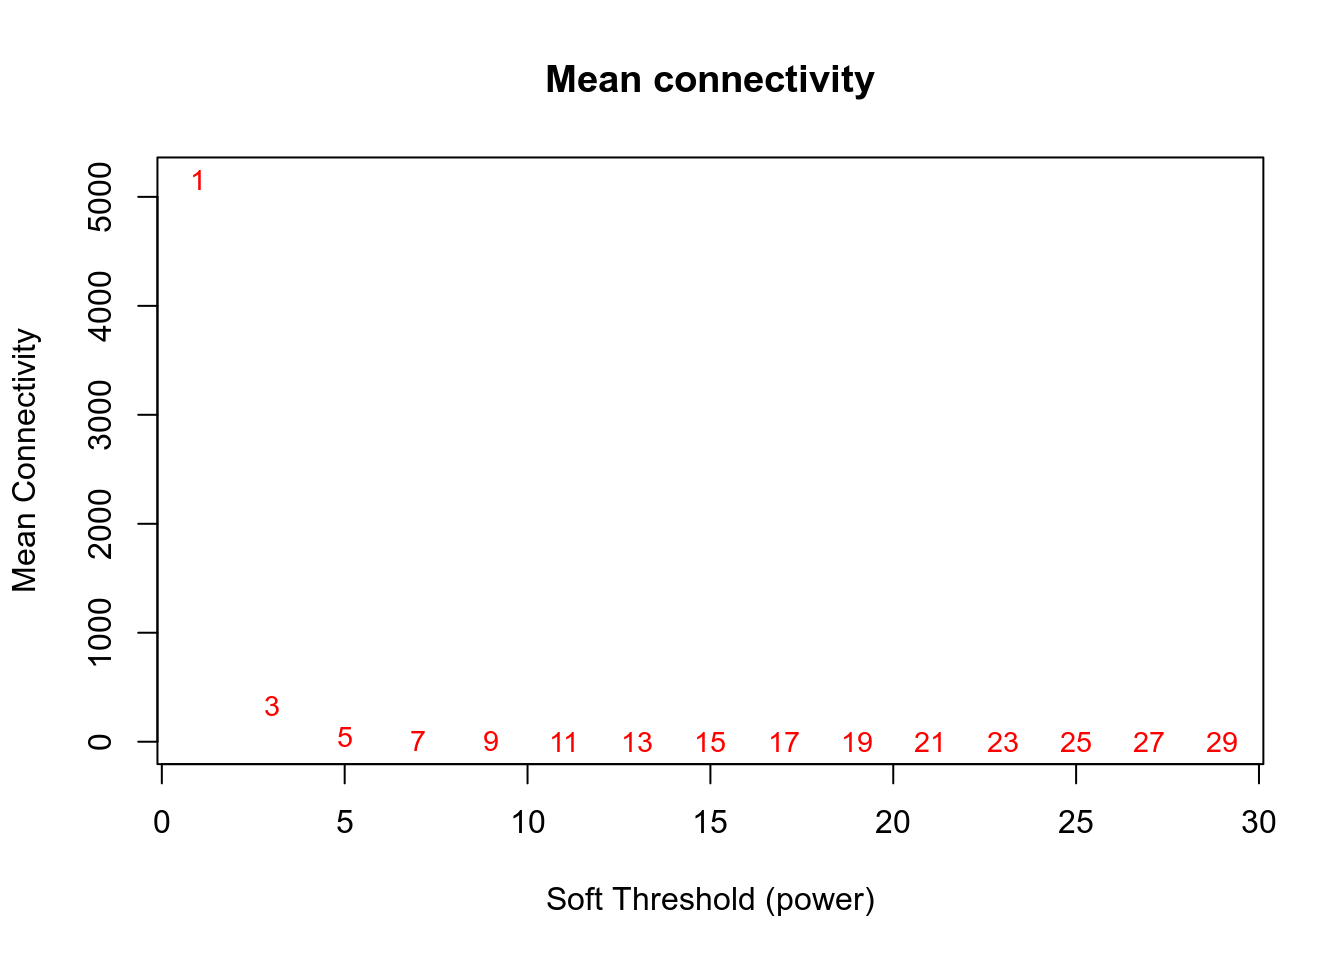
Network is computed using power=5.
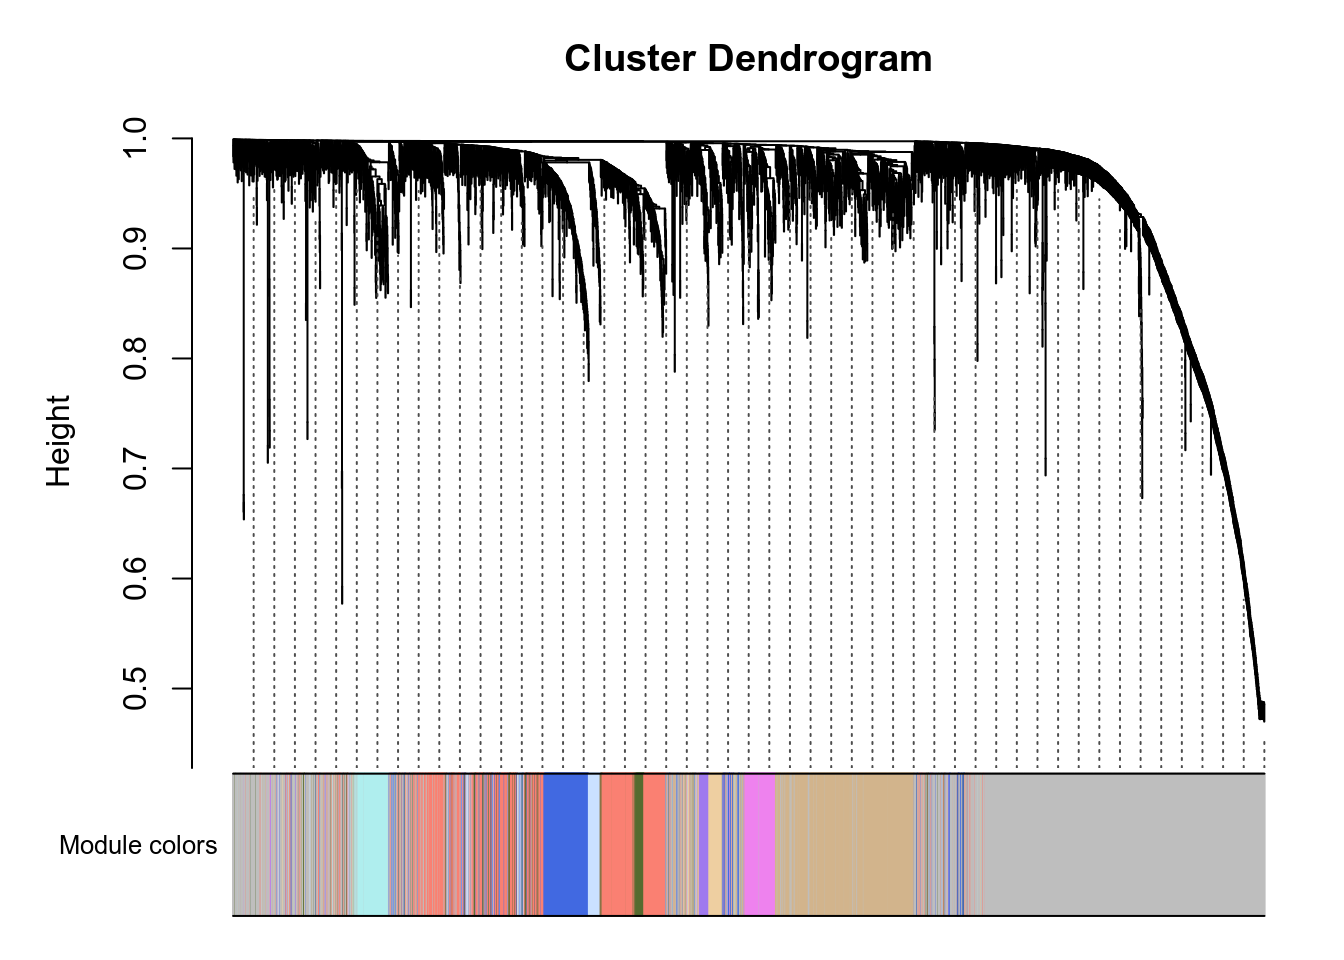
Here are the modules for a few genes of interest:
- VNN1 is in the blue module.
- PPARA is in the tan module.
- PPARD is in the paleturquoise module.
- PPARG is in the blue module.
- PPARGC1A is in the green module.
- PPARGC1B is in the violet module.
g:Profiler results for all modules are available here. Since there are many modules, you should expect at least 1 minute computation on the g:Profiler website for this query. Check below for faster queries focused on VNN1 module.

Figure 3.117: Pathway
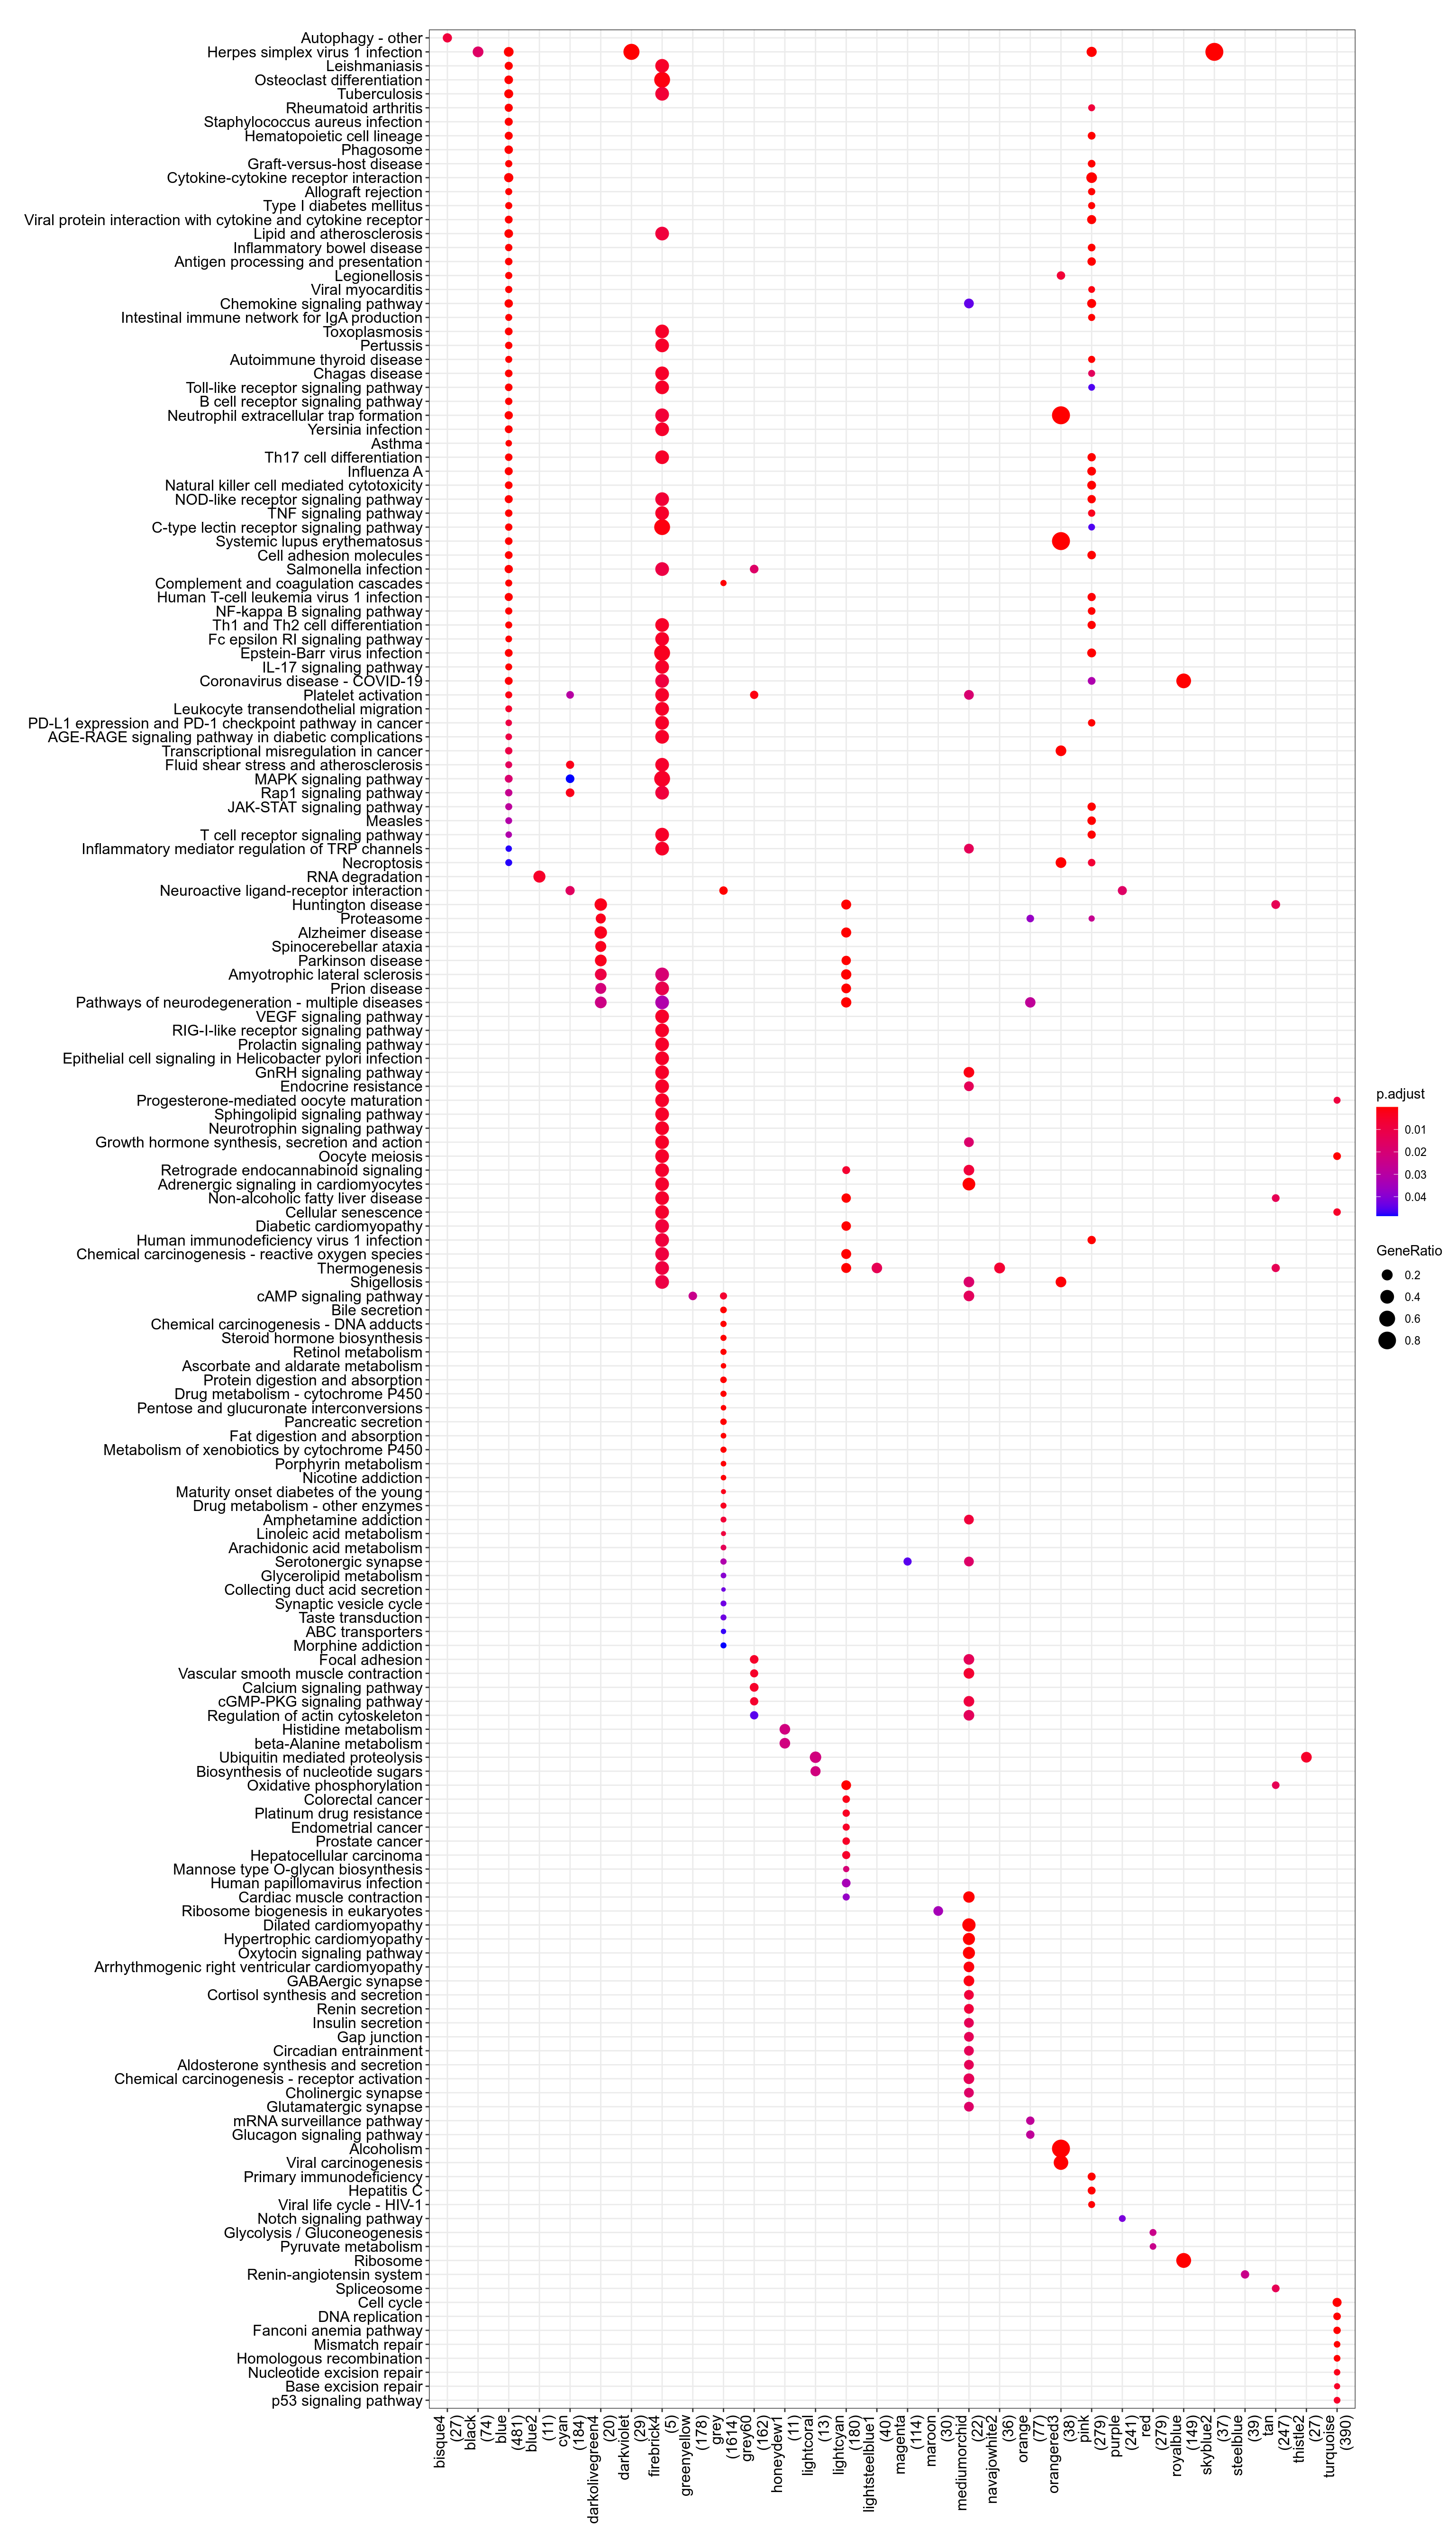
Figure 3.118: Kegg
.](_main_files/figure-html/resultsWgcnaTcgaSarcSTLMSKnitPlotEnrichHallmarks-1.png)
Figure 3.119: MSigDb Hallmarks. readable pdf version.
## No enriched DO term in these classesTo check that module-to-genes reattribution is working as expected, heatmap of signal for VNN1 module is produced, both as absolute values and as Z-score ones.
.](../../../out/bookdown/VNN1_sarcoma/plots/resultsWgcnaTcgaSarcSTLMSKnitPlotHeatmapVNN1ModuleAbsoluteValues.png)
Figure 3.120: log2(vst) signal in VNN1 module. Rows were gene name is prefixed with "-" display negative Z-score for these genes, meaning their signal is anticorrelated with other genes in the cluster. pdf version with readable genes and findable VNN1.
.](../../../out/bookdown/VNN1_sarcoma/plots/resultsWgcnaTcgaSarcSTLMSKnitPlotHeatmapVNN1ModuleZscoreValues.png)
Figure 3.121: Zscore of log2(vst) signal in VNN1 module. Rows were gene name is prefixed with "-" display negative Z-score for these genes, meaning their signal is anticorrelated with other genes in the cluster. pdf version with readable genes and findable VNN1.
.](_main_files/figure-html/resultsWgcnaTcgaSarcSTLMSKnitPlotGenesInVNN1ModuleCorPearson-1.png)
Figure 3.122: Genes in VNN1 module plotted by Pearson correlation against it. Details are available in this table.
- Enrichr results for all genes in VNN1 module are available here
- Enrichr results for genes in VNN1 module and positively correlated with it are available here
- Enrichr results for genes in VNN1 module and negatively correlated with it are available here
- g:Profiler results for all genes in VNN1 module are available here
- g:Profiler results for genes in VNN1 module and positively correlated with it are available here
- g:Profiler results for genes in VNN1 module and negatively correlated with it are available here
- g:Profiler results for comparison of the three queries above are available here