3.2.1.7 TCGA-LUSC dataset
There are 36886 genes and 551 samples in the dataset.
All samples and genes look good for the analysis.
##    Power SFT.R.sq slope truncated.R.sq  mean.k. median.k. max.k.
## 1      1    0.163 -1.15          0.930 3.98e+03  3.79e+03 8620.0
## 2      3    0.798 -2.25          0.960 2.05e+02  1.36e+02 1470.0
## 3      5    0.938 -1.92          0.990 2.82e+01  9.95e+00  464.0
## 4      7    0.968 -1.73          0.993 6.87e+00  1.13e+00  229.0
## 5      9    0.962 -1.60          0.992 2.45e+00  1.85e-01  146.0
## 6     11    0.947 -1.52          0.984 1.12e+00  3.90e-02  102.0
## 7     13    0.942 -1.46          0.985 6.05e-01  9.50e-03   75.1
## 8     15    0.952 -1.41          0.991 3.63e-01  2.50e-03   57.3
## 9     17    0.958 -1.36          0.995 2.34e-01  7.00e-04   44.8
## 10    19    0.959 -1.34          0.993 1.59e-01  2.07e-04   35.7
## 11    21    0.956 -1.33          0.990 1.12e-01  6.31e-05   28.8
## 12    23    0.958 -1.31          0.987 8.17e-02  1.97e-05   23.6
## 13    25    0.953 -1.31          0.981 6.09e-02  6.21e-06   19.5
## 14    27    0.937 -1.31          0.967 4.63e-02  2.04e-06   16.4
## 15    29    0.937 -1.31          0.962 3.59e-02  6.64e-07   13.8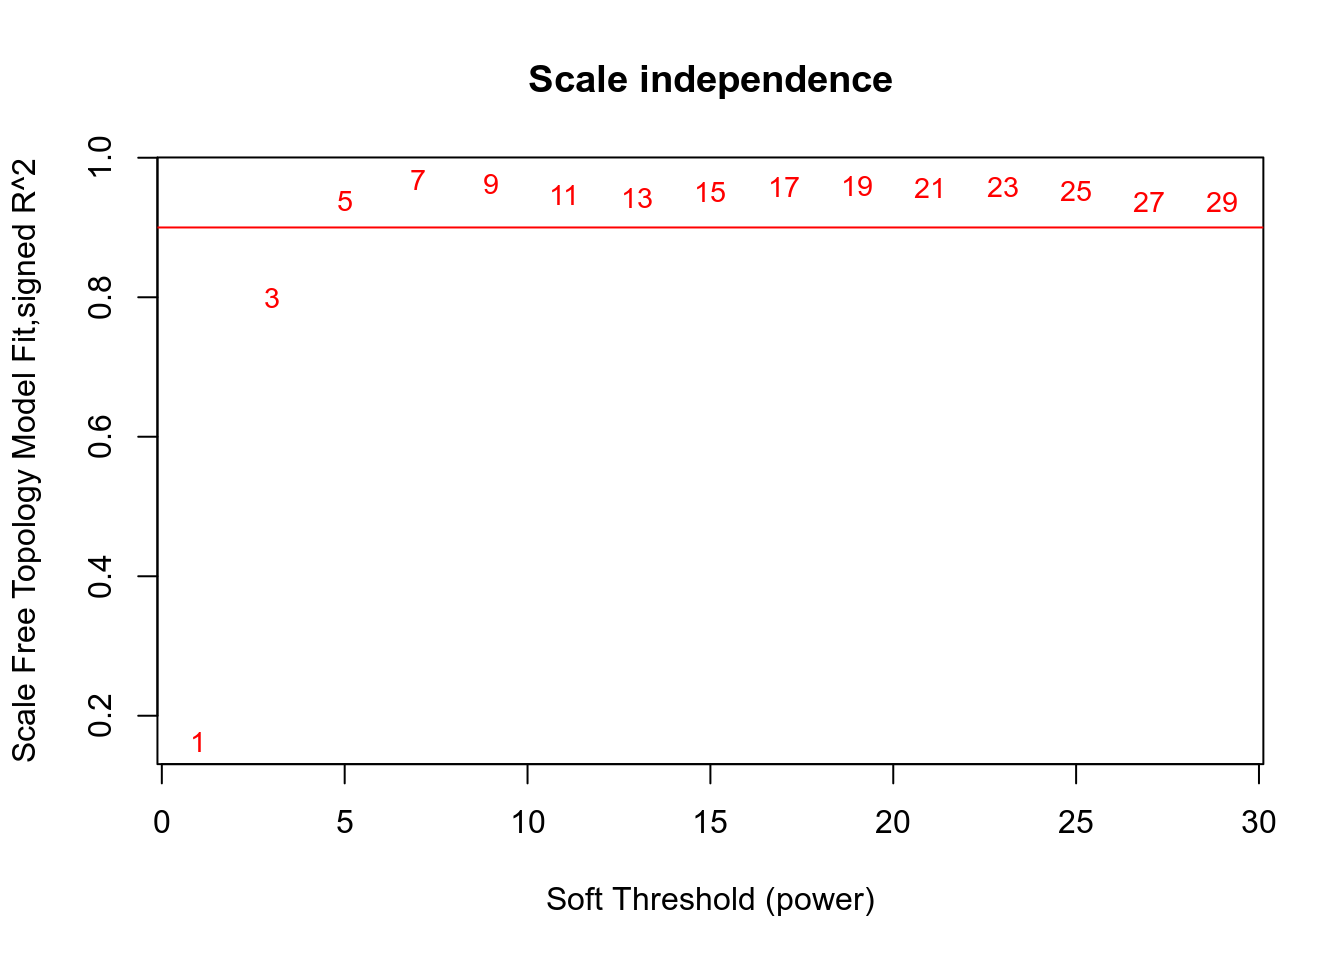
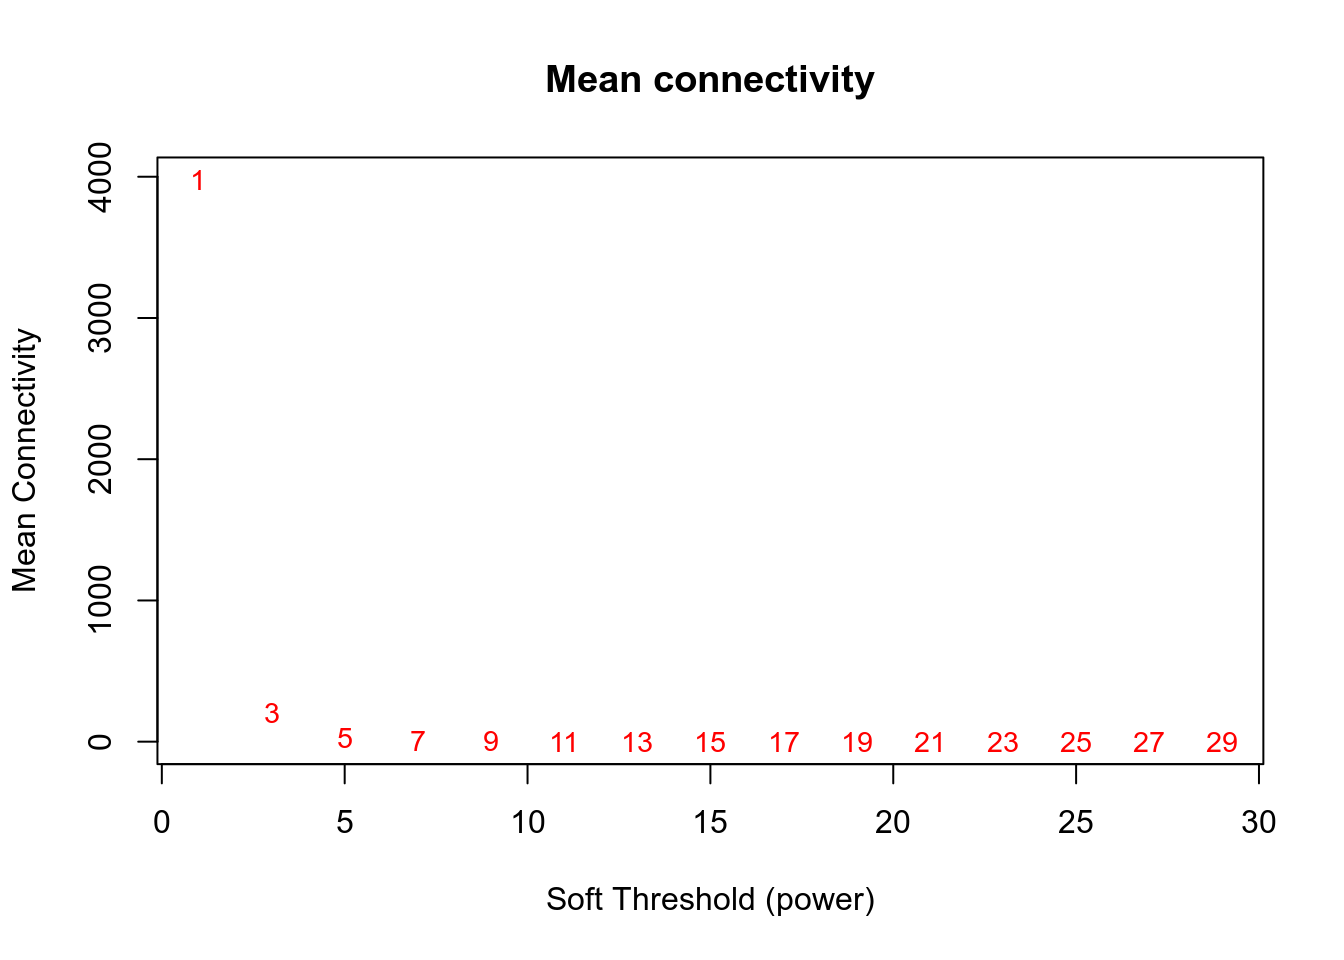
Network is computed using power=5.
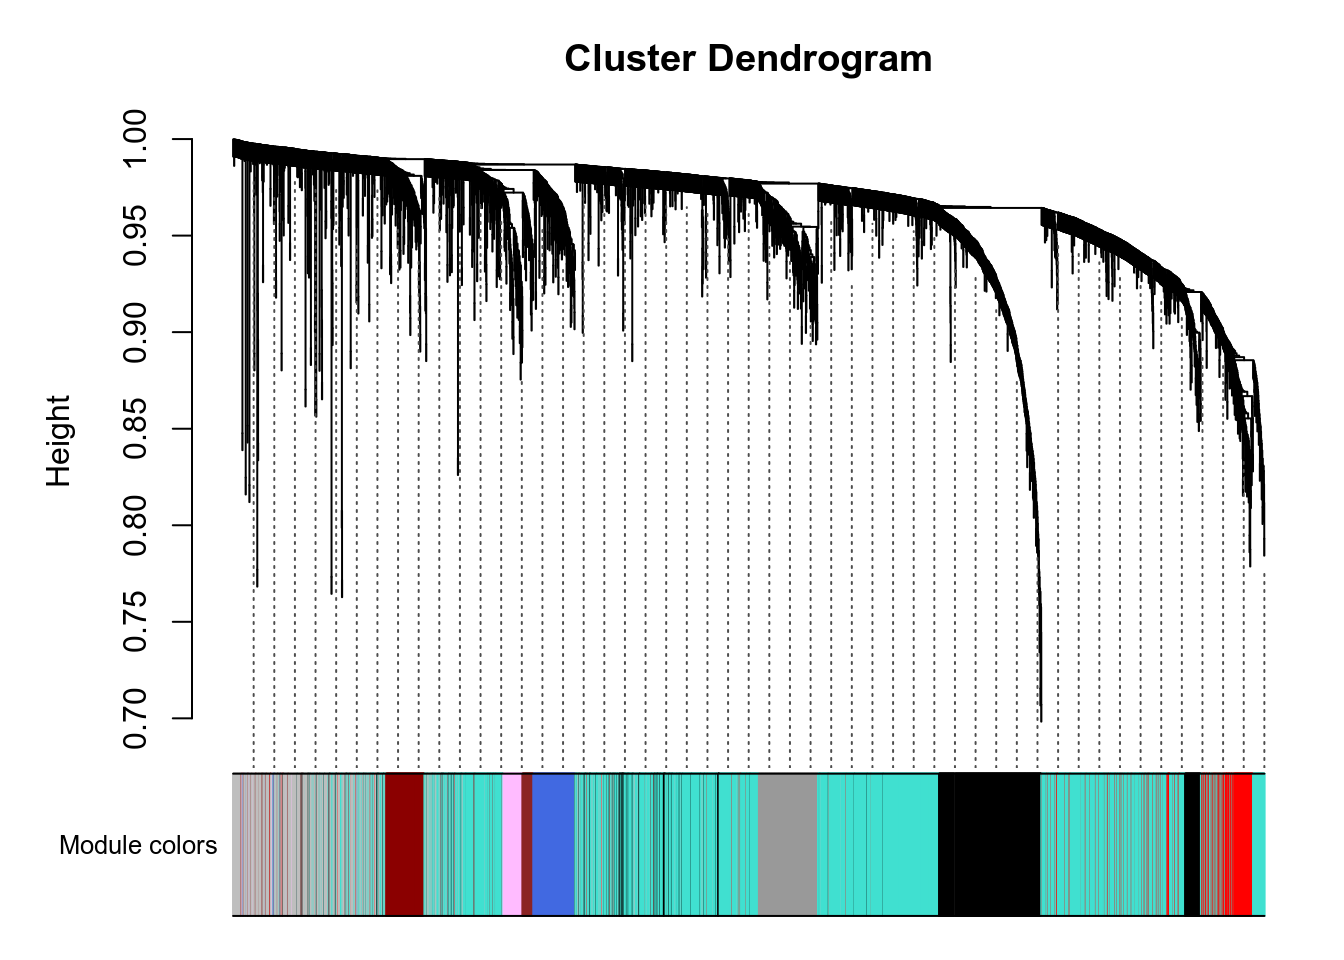
Here are the modules for a few genes of interest:
- VNN1 is in the turquoise module.
- PPARA is in the grey module.
- PPARD is in the lightcyan module.
- PPARG is in the grey module.
- PPARGC1A is in the turquoise module.
- PPARGC1B is in the grey module.
g:Profiler results for all modules are available here. Since there are many modules, you should expect at least 1 minute computation on the g:Profiler website for this query. Check below for faster queries focused on VNN1 module.
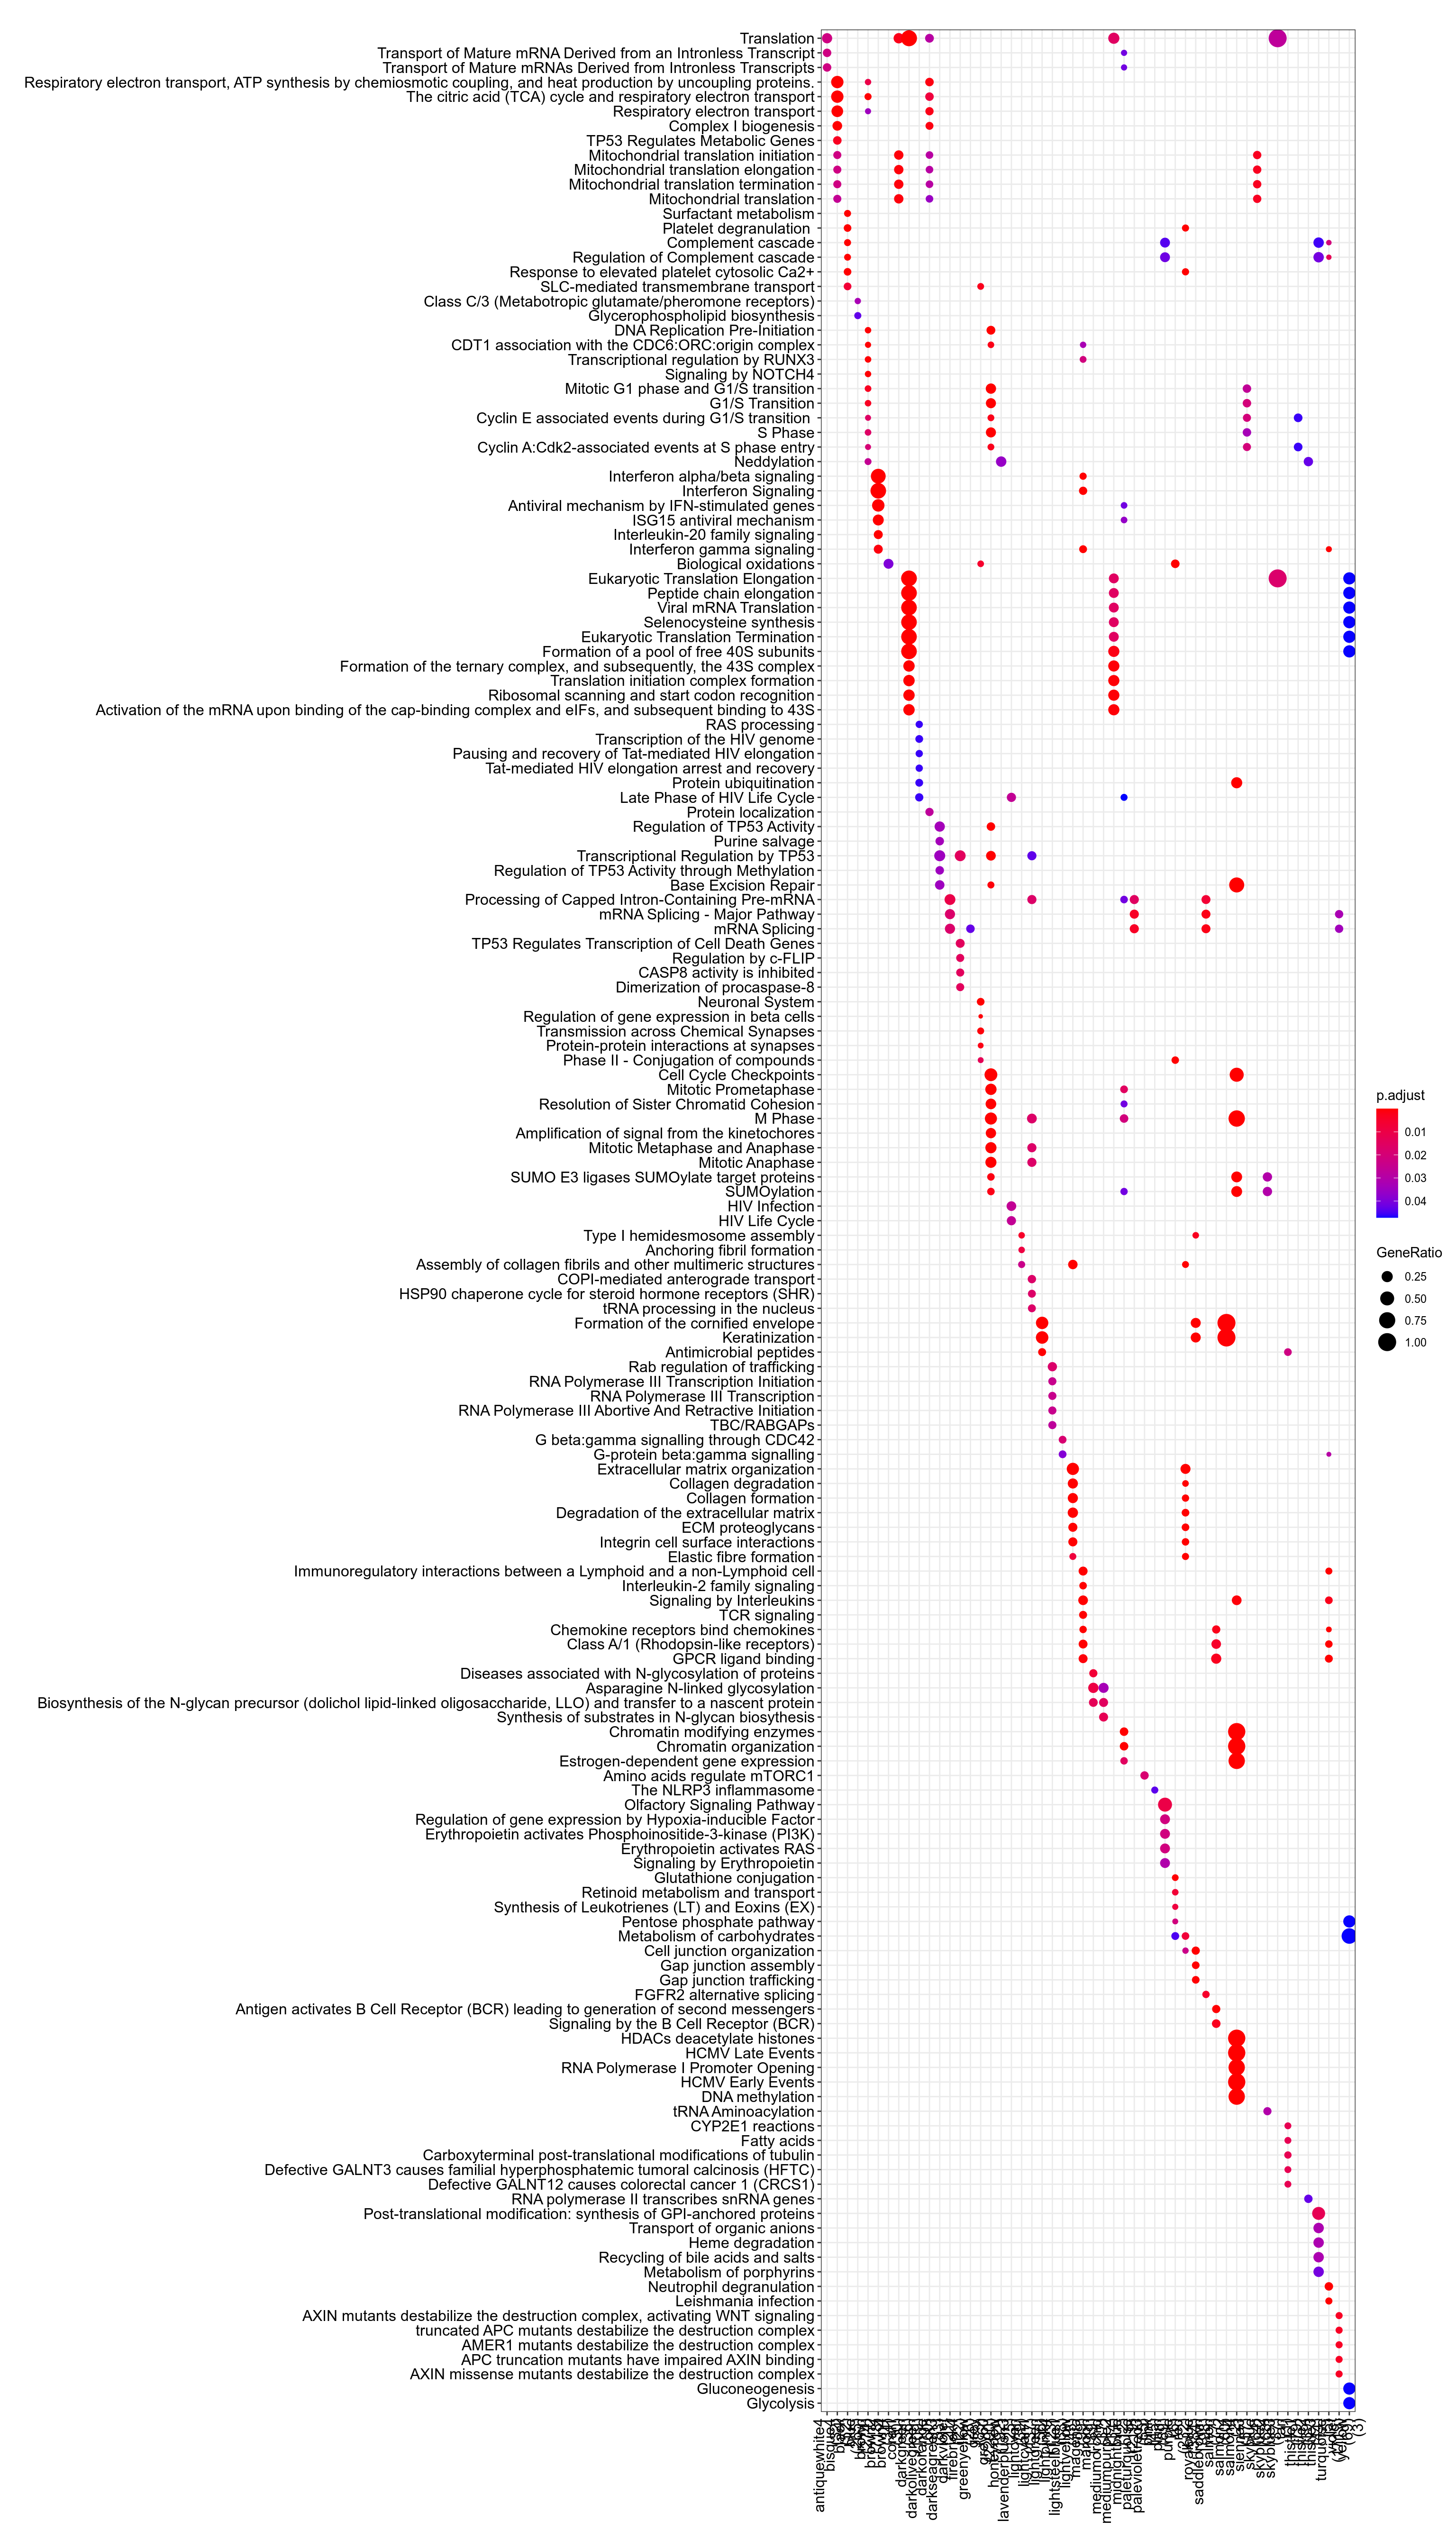
Figure 3.59: Pathway
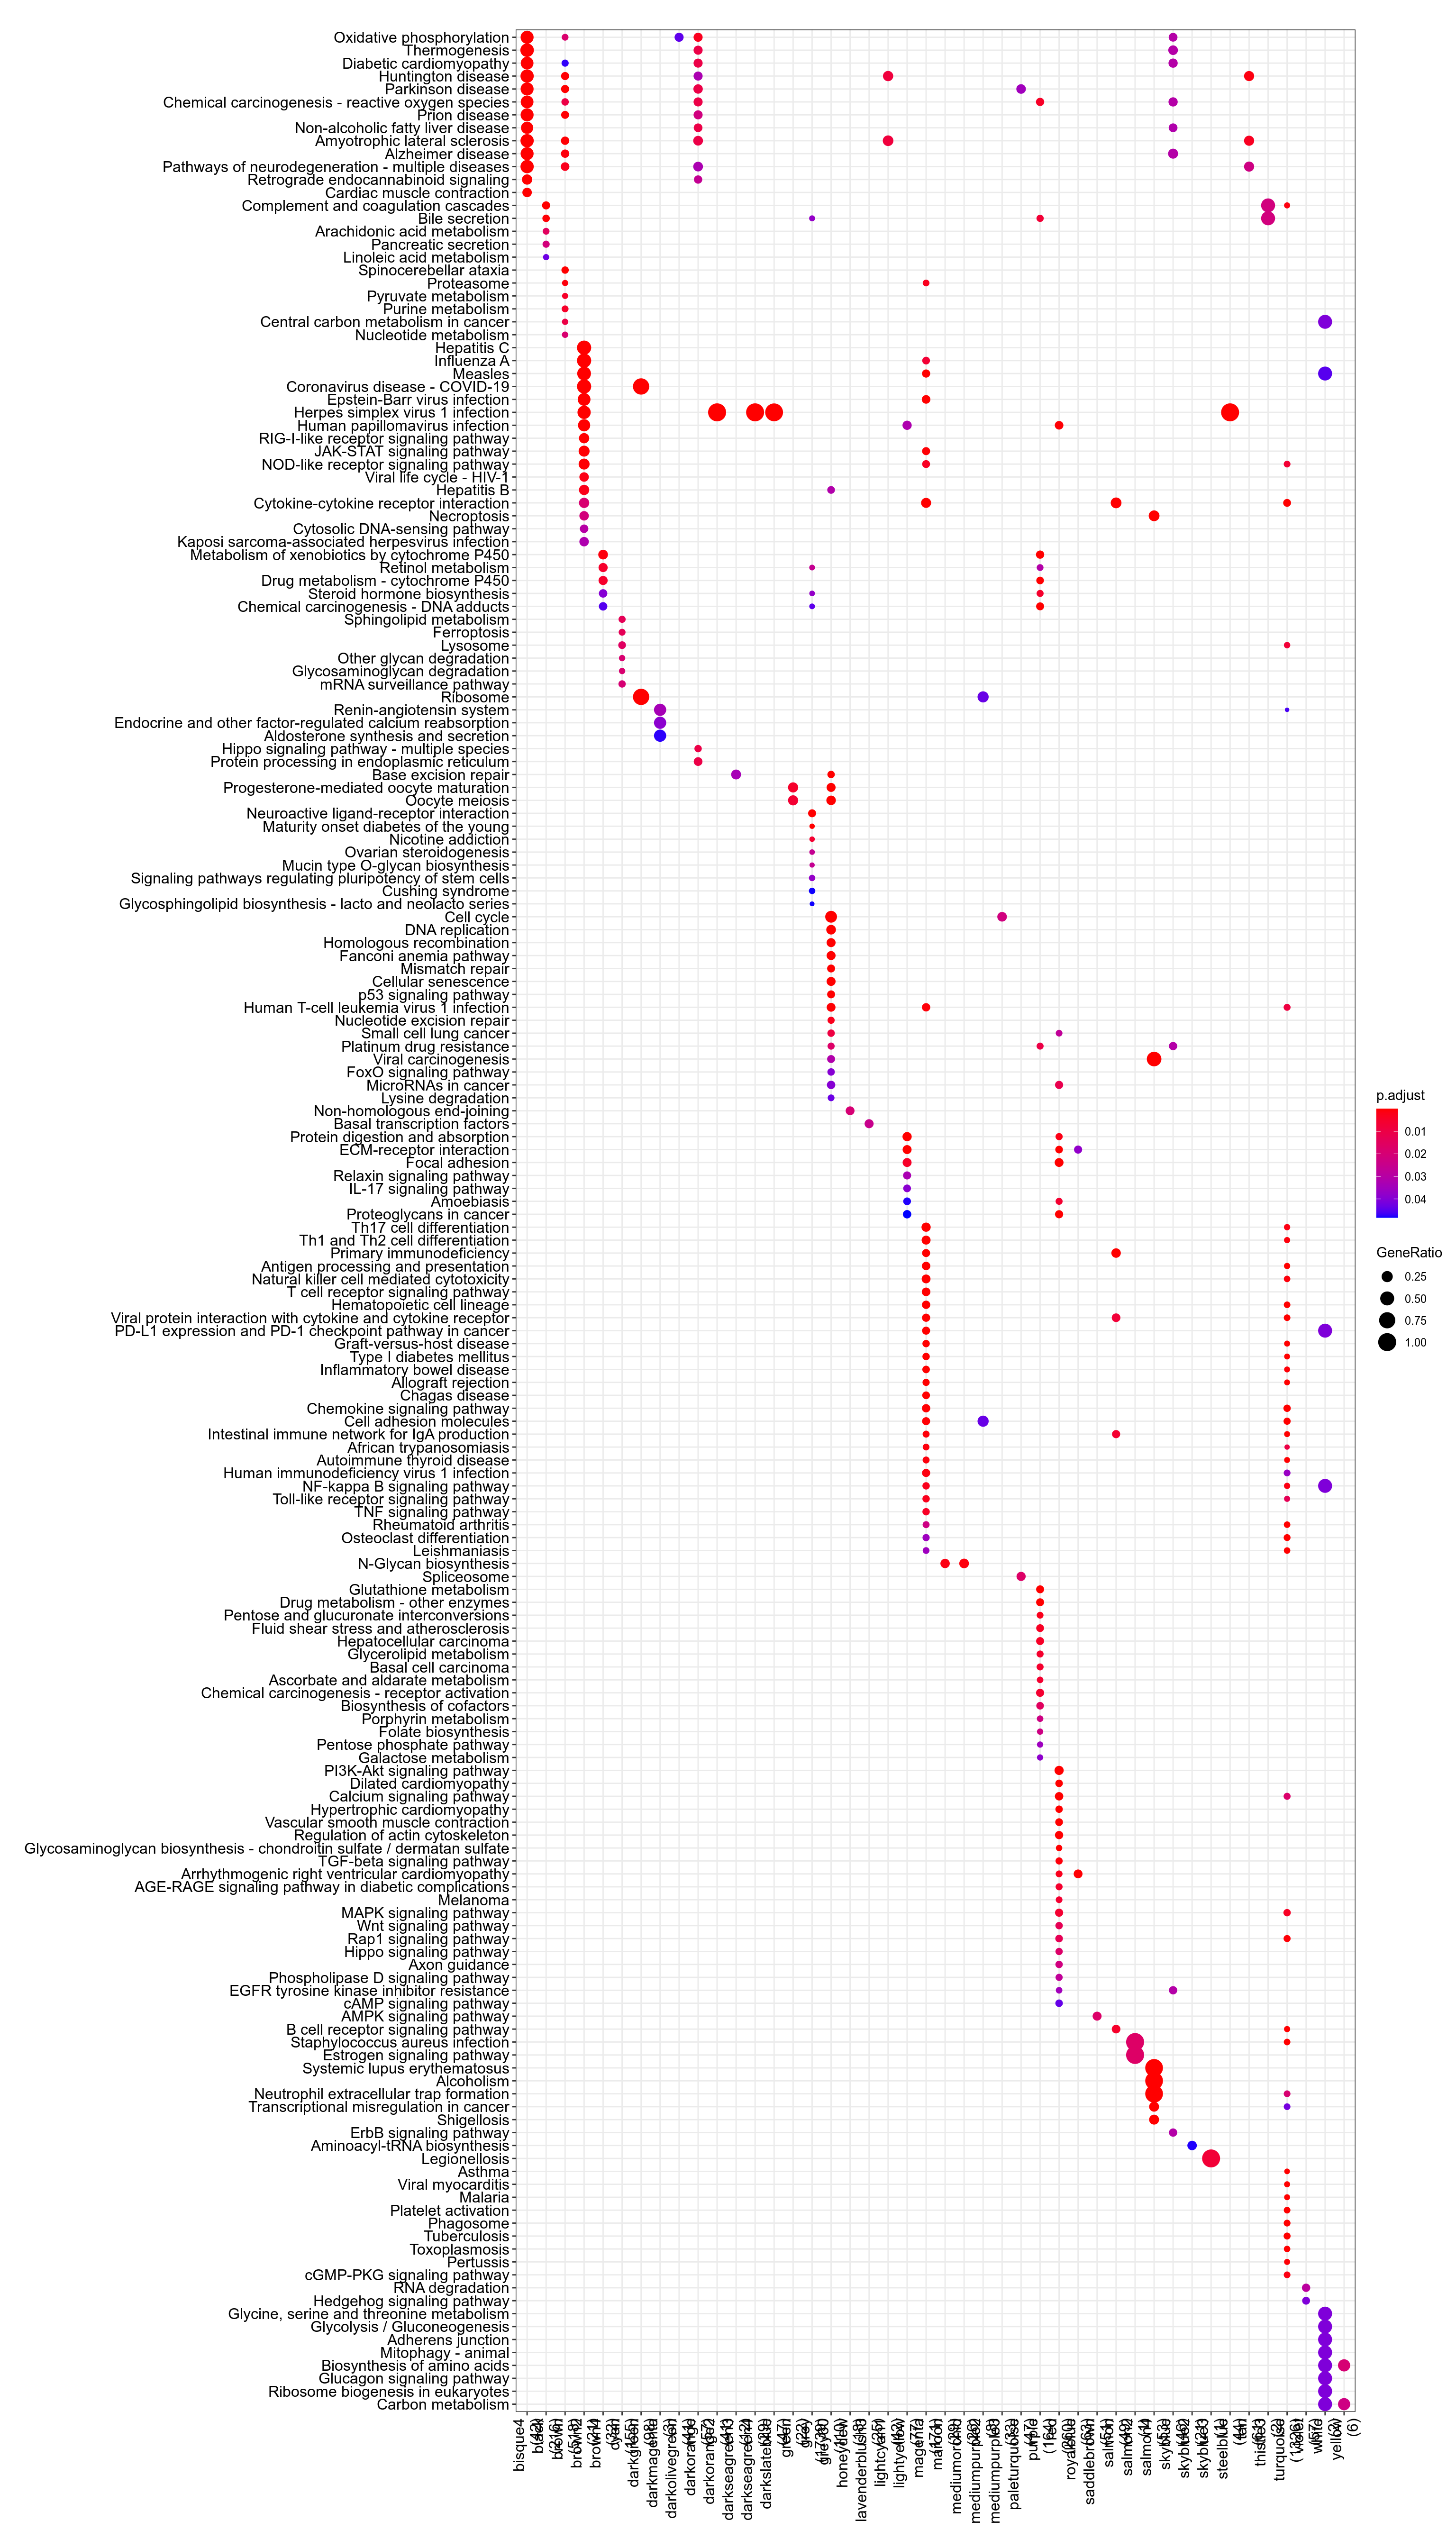
Figure 3.60: Kegg
.](_main_files/figure-html/resultsWgcnaProjectIdTcgaLuscKnitPlotEnrichHallmarks-1.png)
Figure 3.61: MSigDb Hallmarks. readable pdf version.
## No enriched DO term in these classesTo check that module-to-genes reattribution is working as expected, heatmap of signal for VNN1 module is produced, both as absolute values and as Z-score ones.
## VNN1 module contains more than 2000 genes. Heatmap generation is skippedVNN1 module contains more than 2000 genes. Heatmap generation is skipped
.](_main_files/figure-html/resultsWgcnaProjectIdTcgaLuscKnitPlotGenesInVNN1ModuleCorPearson-1.png)
Figure 3.62: Genes in VNN1 module plotted by Pearson correlation against it. Details are available in this table.
- Enrichr results for all genes in VNN1 module are available here
- Enrichr results for genes in VNN1 module and positively correlated with it are available here
- Enrichr results for genes in VNN1 module and negatively correlated with it are available here
- g:Profiler results for all genes in VNN1 module are available here
- g:Profiler results for genes in VNN1 module and positively correlated with it are available here
- g:Profiler results for genes in VNN1 module and negatively correlated with it are available here
- g:Profiler results for comparison of the three queries above are available here