3.2.4.2 Kegg
The xlsx table for the qvalues of all significant Kegg gene sets is available here.
3.2.4.2.1 Manually-selected and ordered pathways and datasets
Below are the two variants with either linear or log scale for q-values.
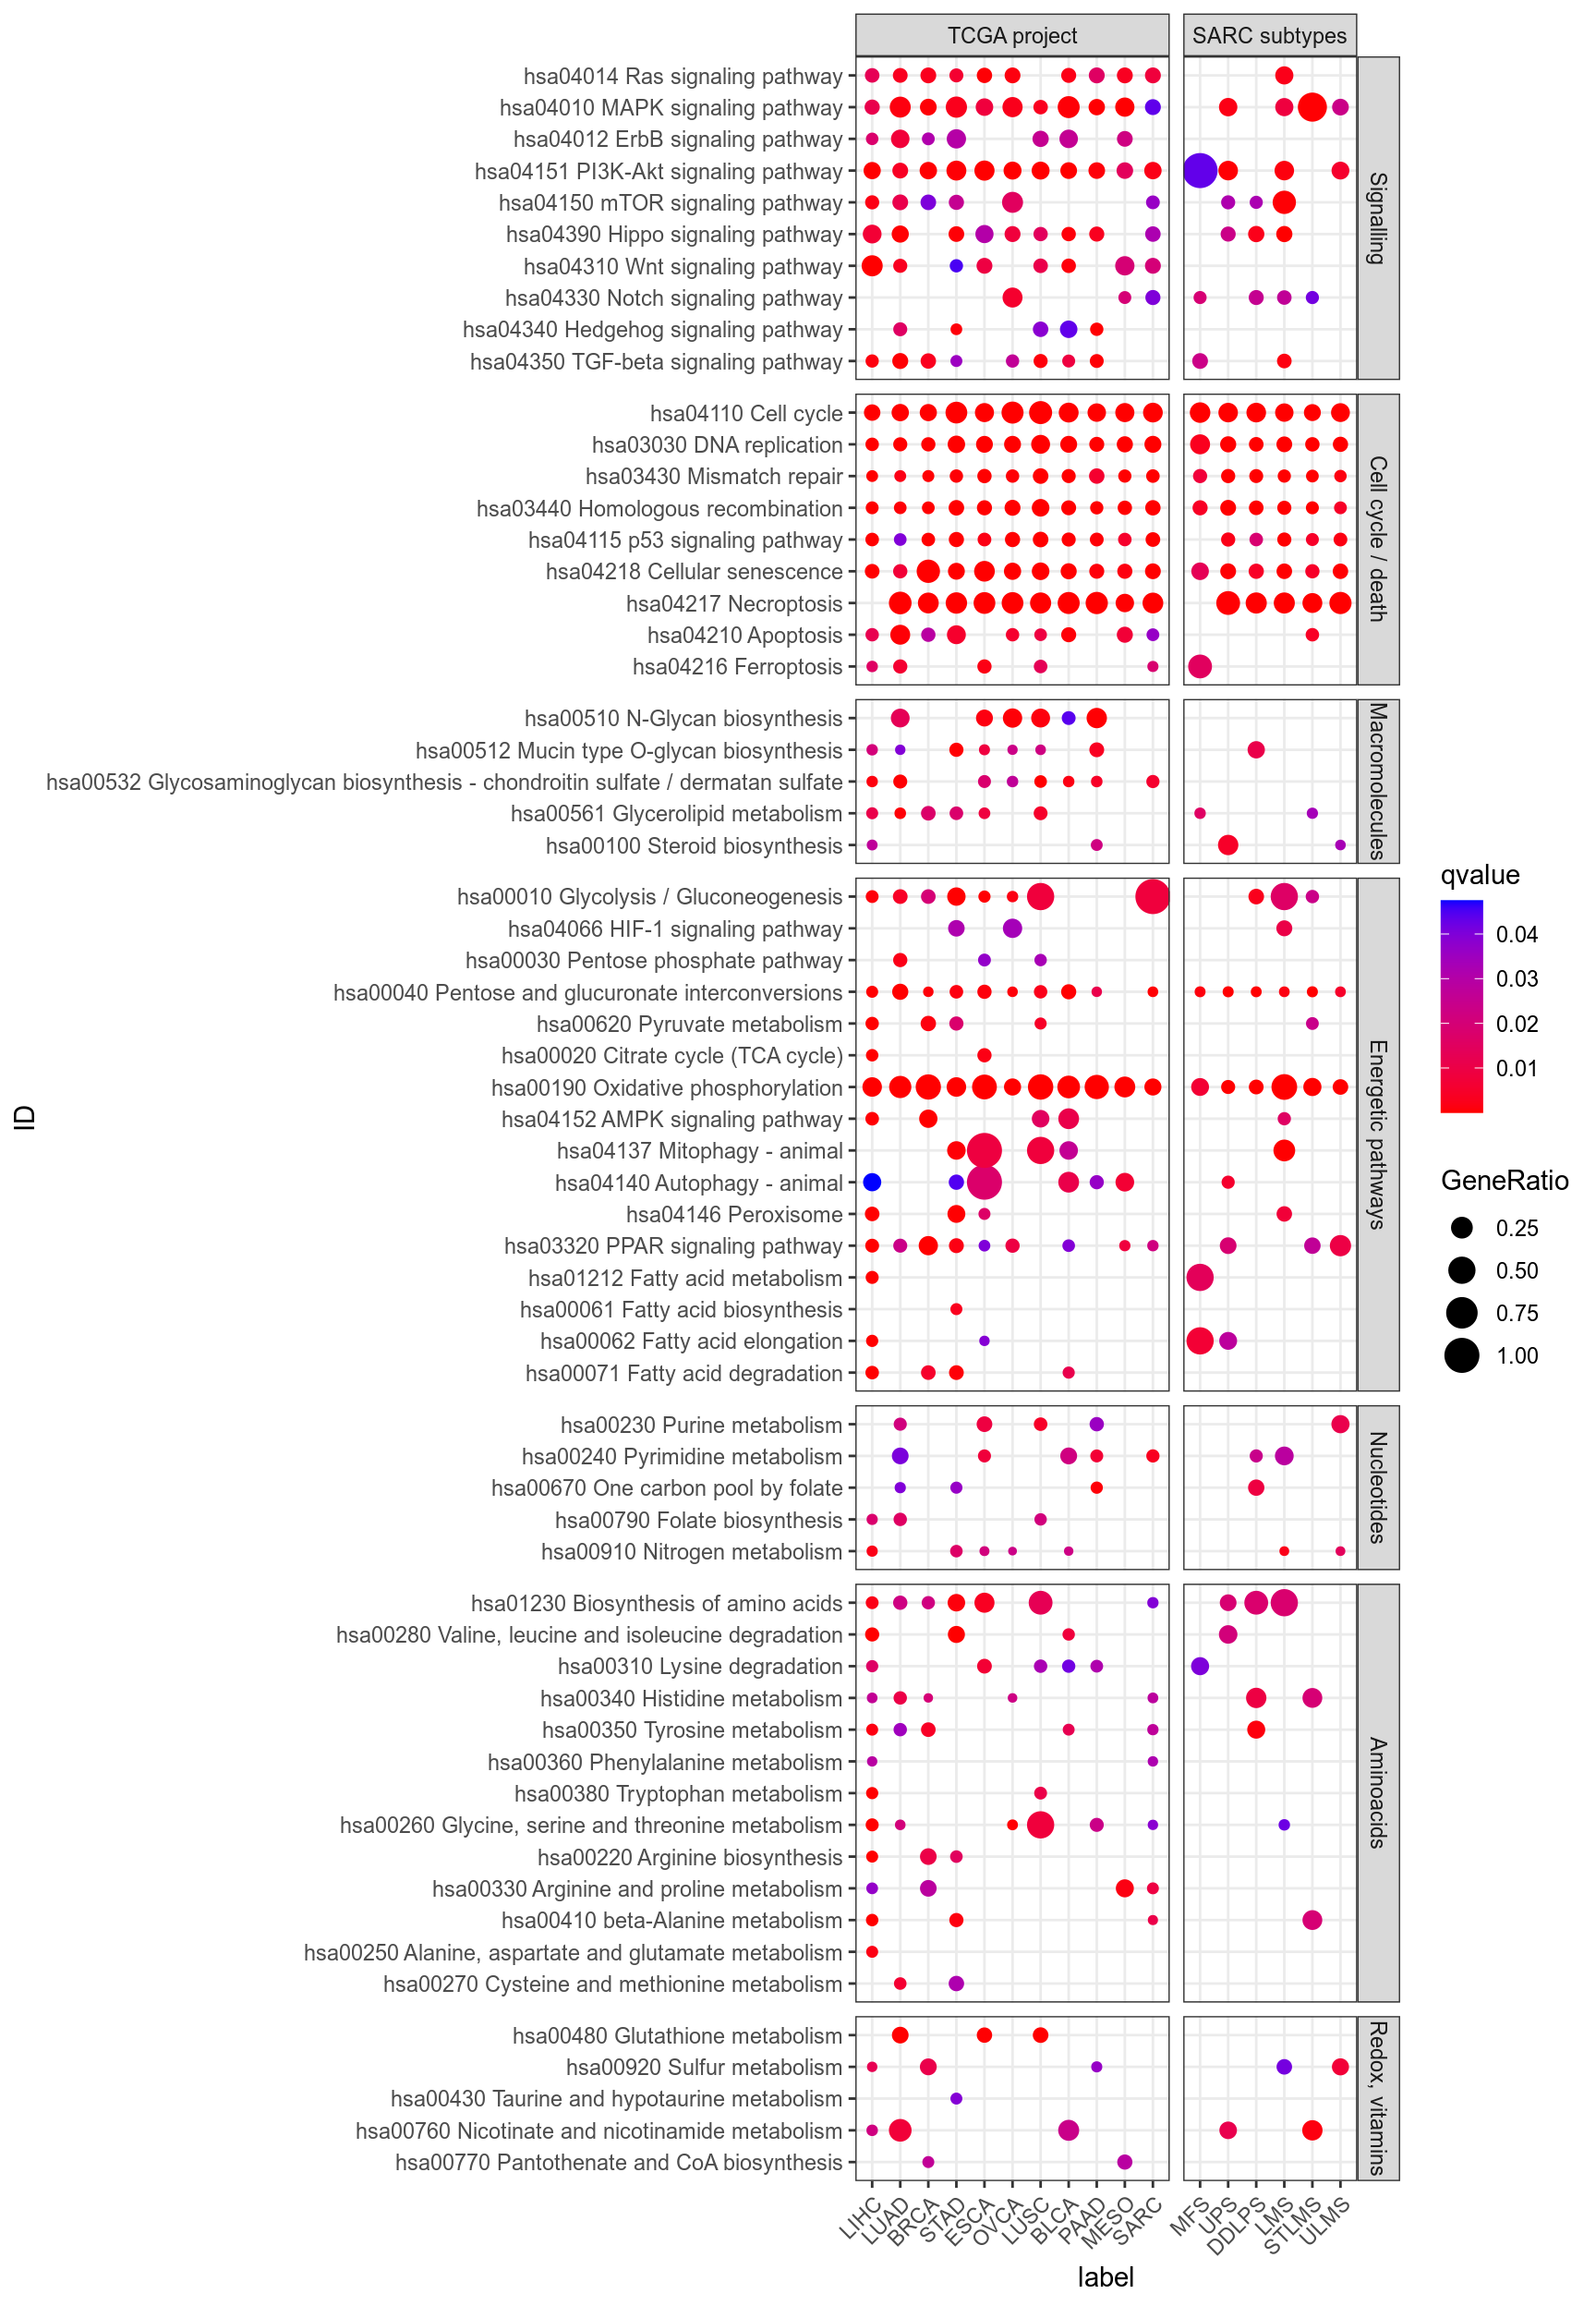
Figure 3.155: Dotplot for Kegg of interest (provided by Philipe Naquet).
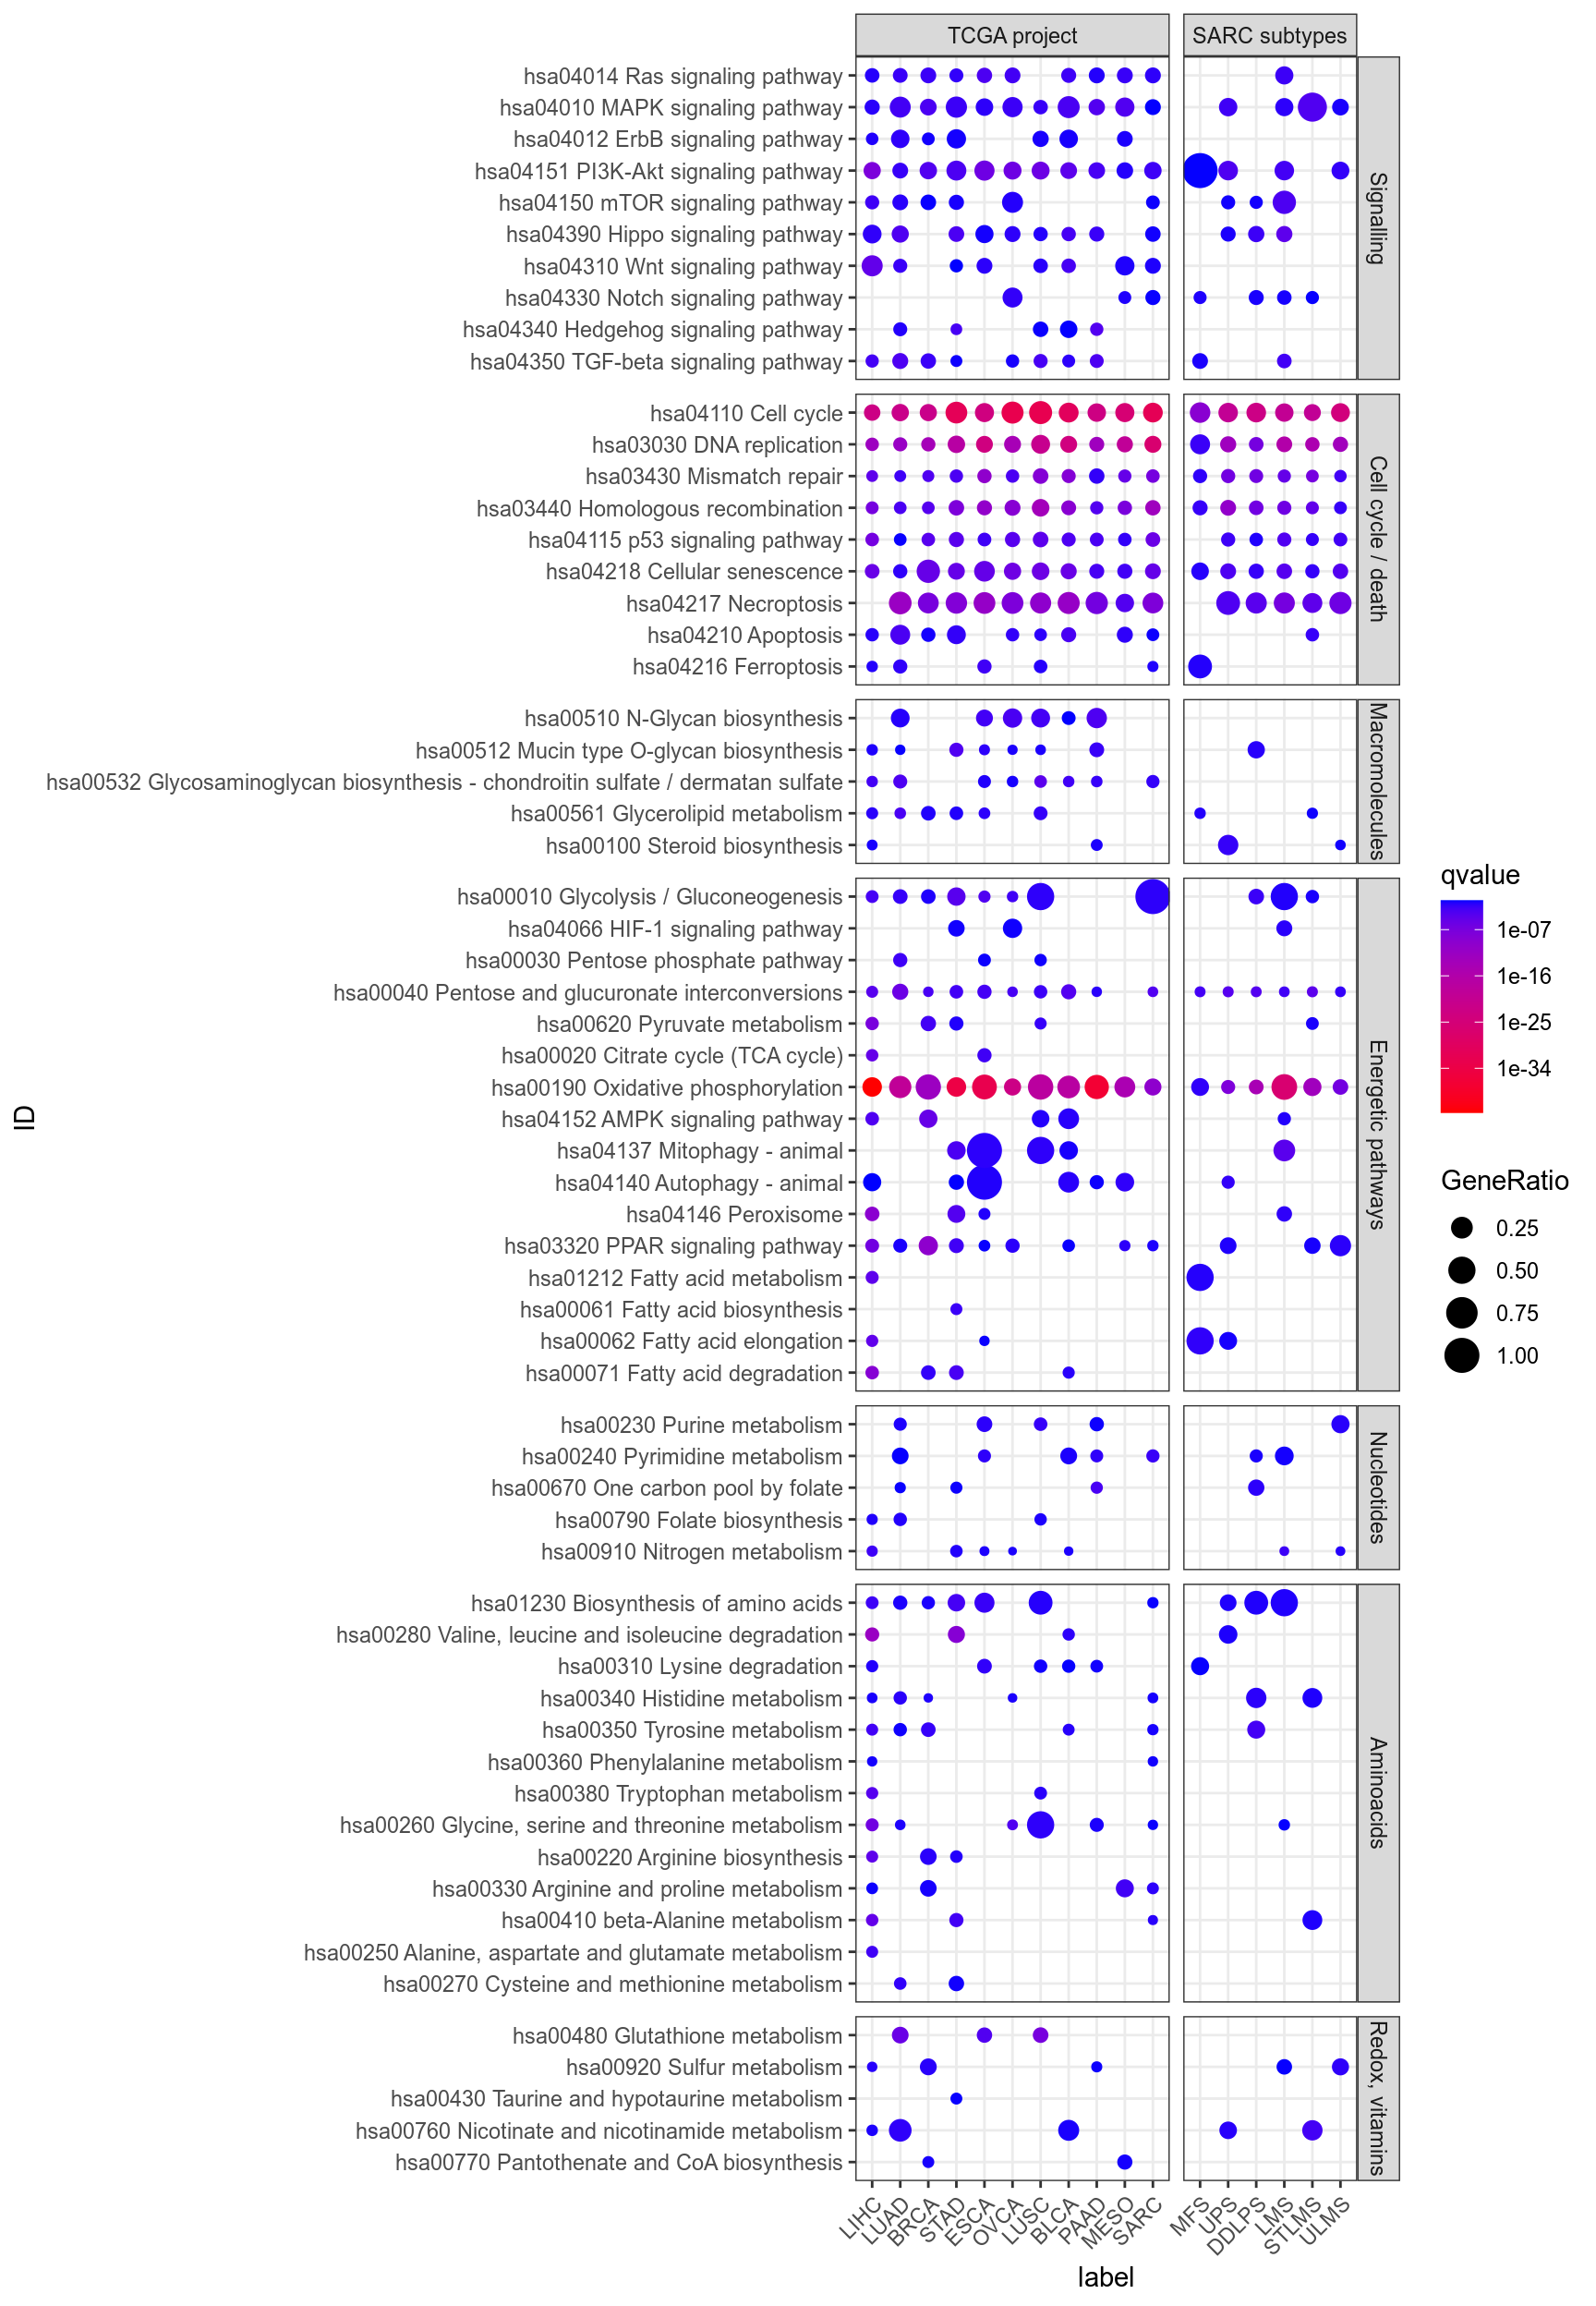
Figure 3.156: Dotplot for Kegg of interest (provided by Philipe Naquet).
3.2.4.2.2 Alphabetically-ordered Kegg and all datasets
Adding facets and manual reordering in dotplots above ruined the dotplots below. Since the first ones should be enough for the review, no effort is planned to fix the dotplots below.
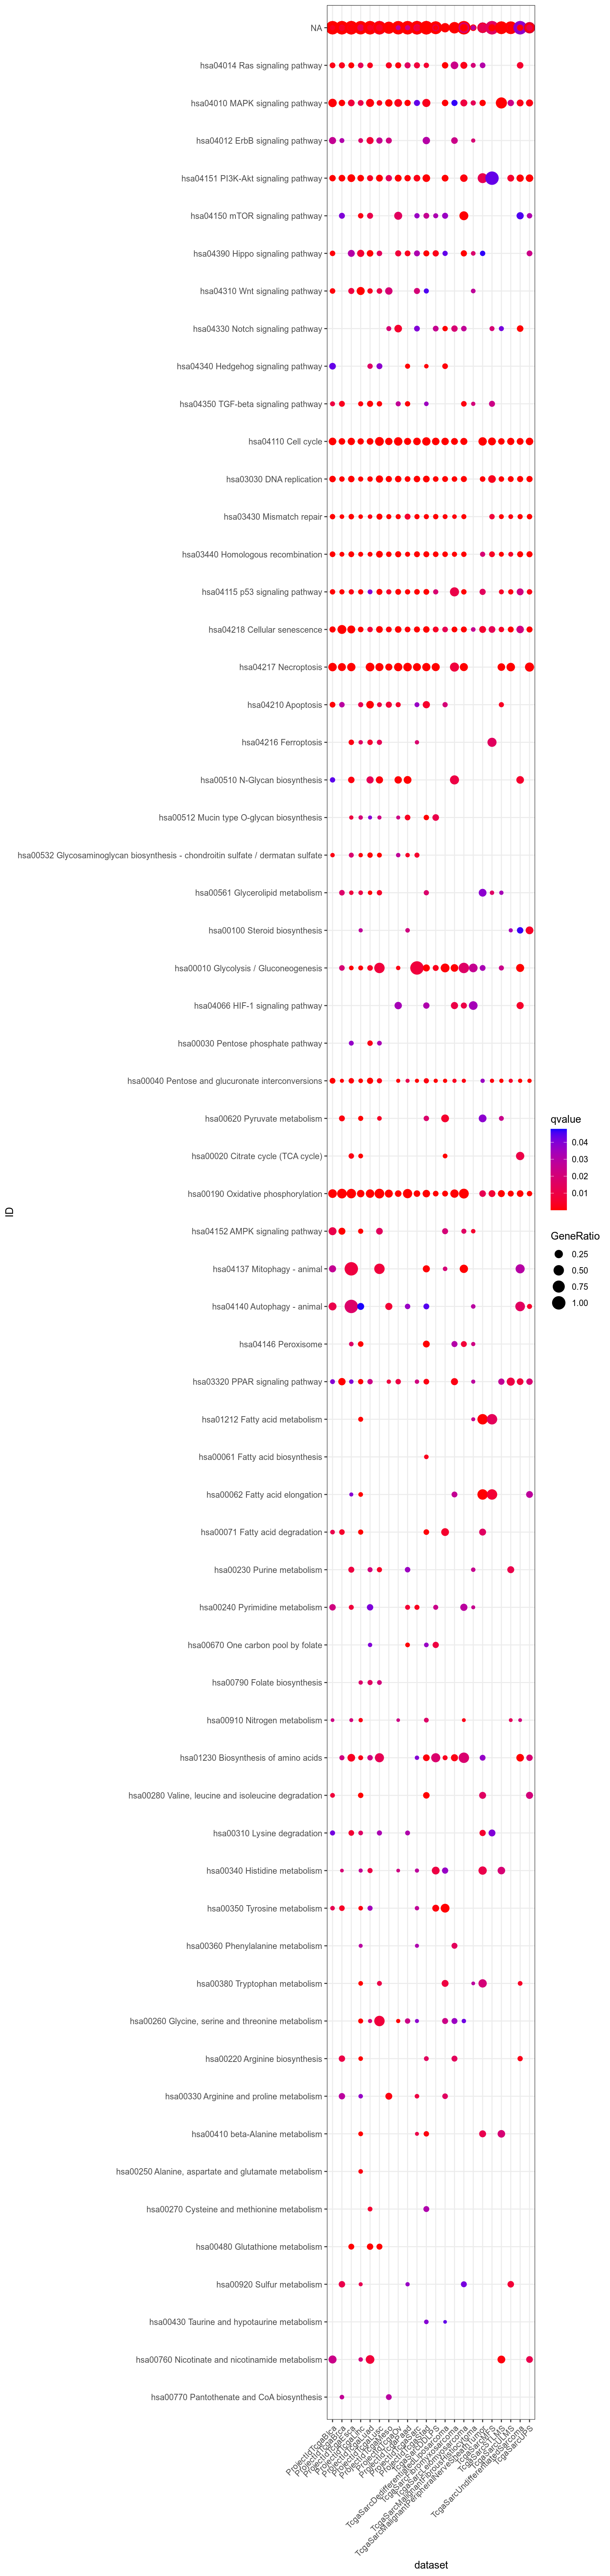
Figure 3.157: Dotplot for Kegg significant (q-value < 0.05) in at least one dataset.
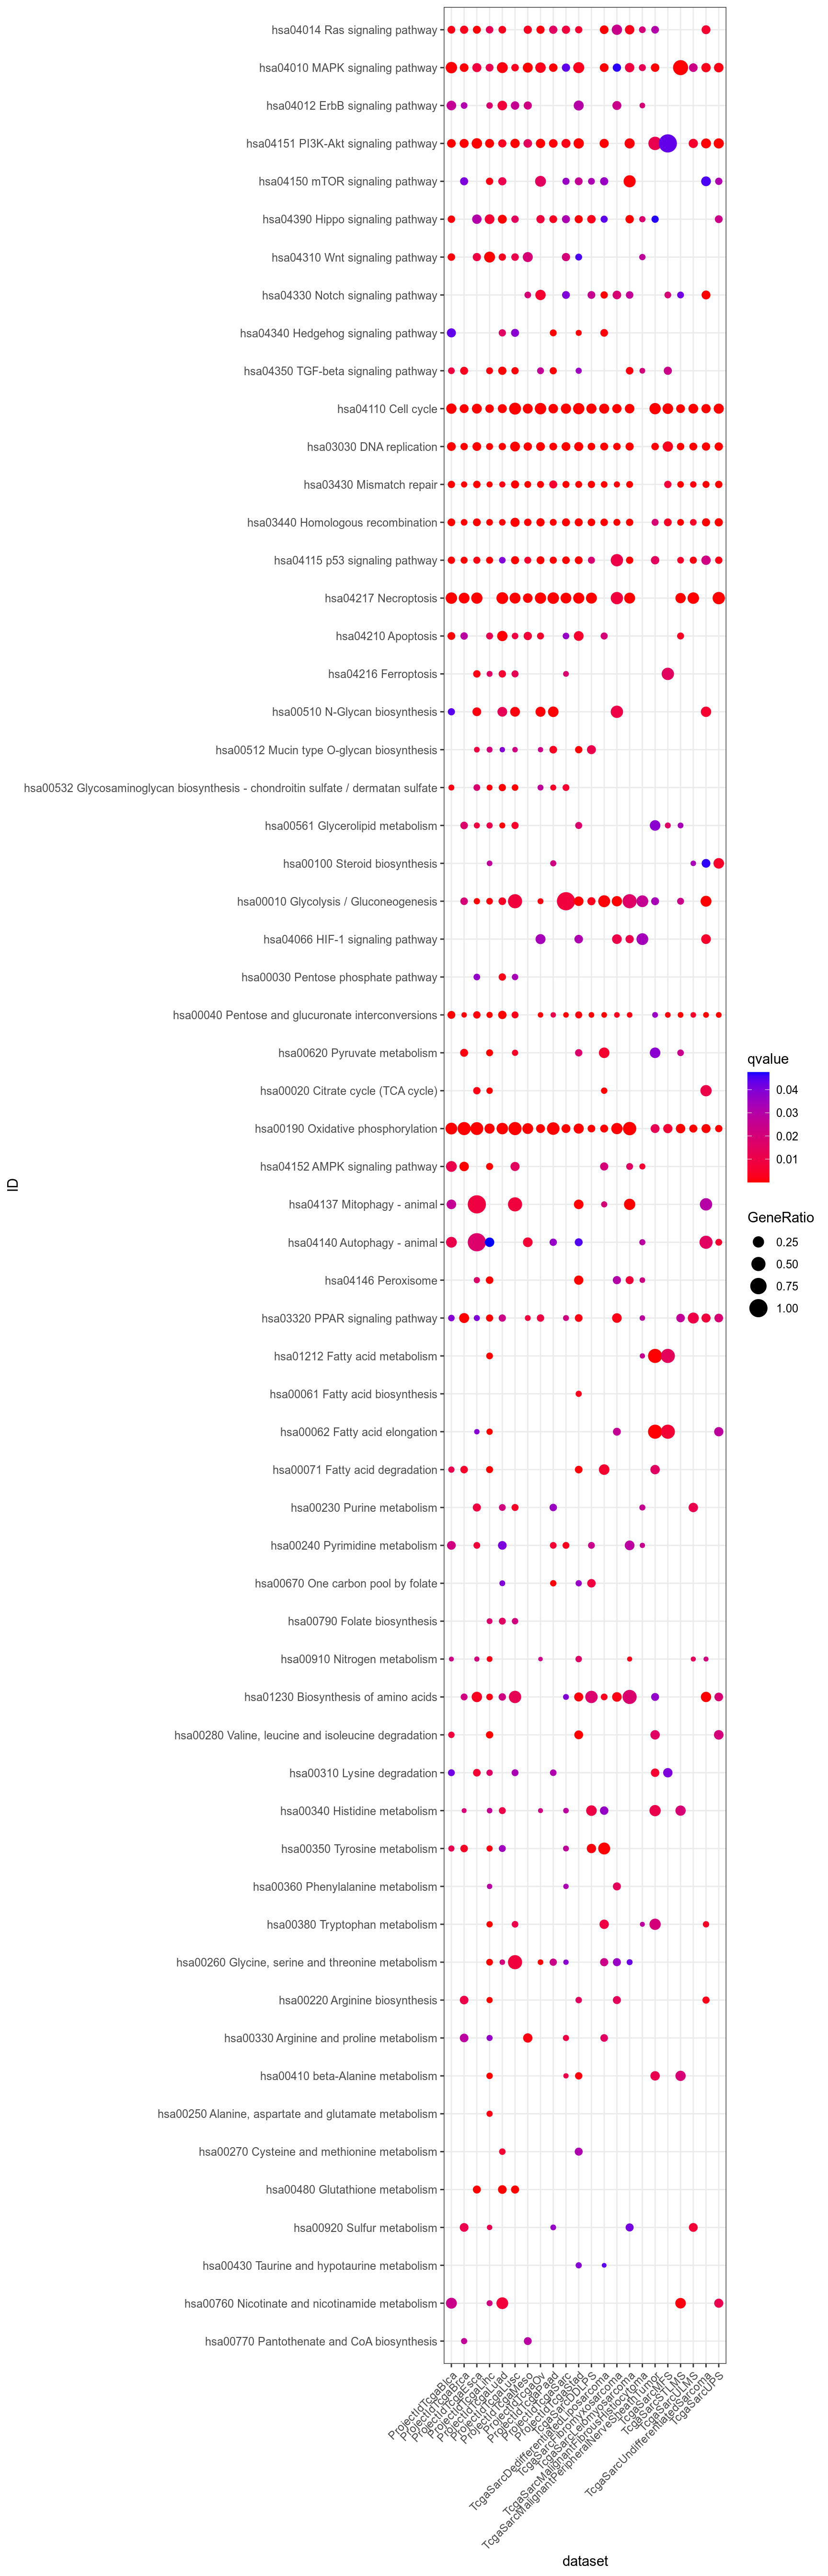
Figure 3.158: Dotplot for Kegg which are significant (q-value < 0.05) in at least one dataset and non ubiquitous, i.e. not significant for all datasets.
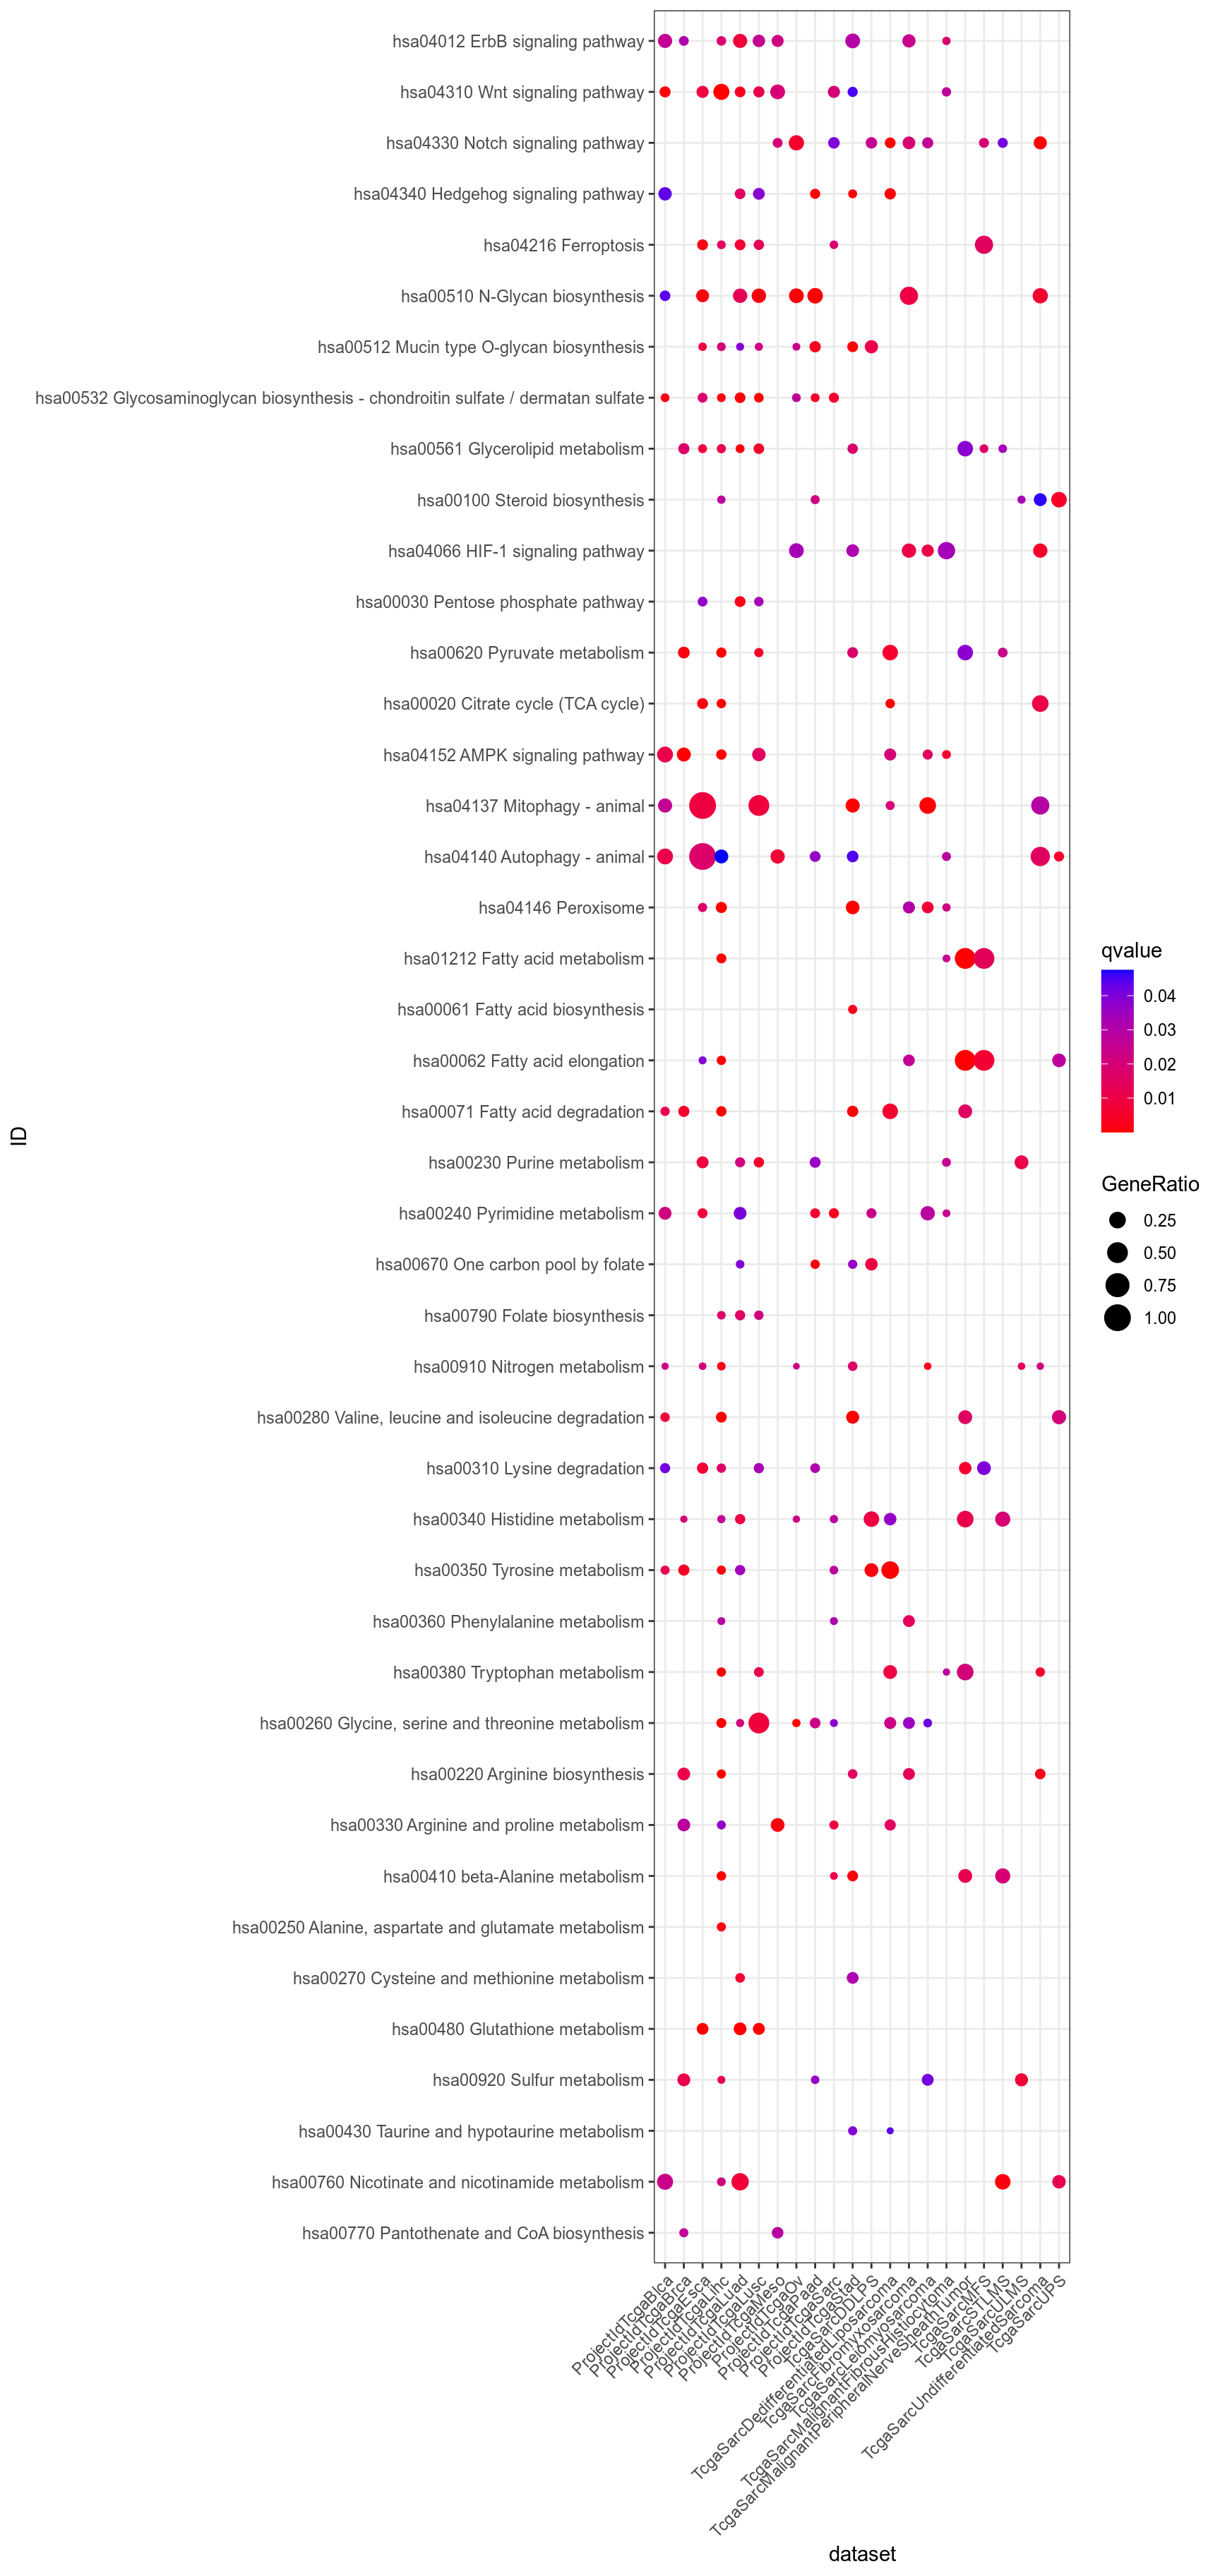
Figure 3.159: Dotplot for Kegg which are significant (q-value < 0.05) in at least one dataset, and uncommon, i.e. significant in less than half the datasets.
3.2.4.2.3 Occurency-ordered Kegg and all datasets
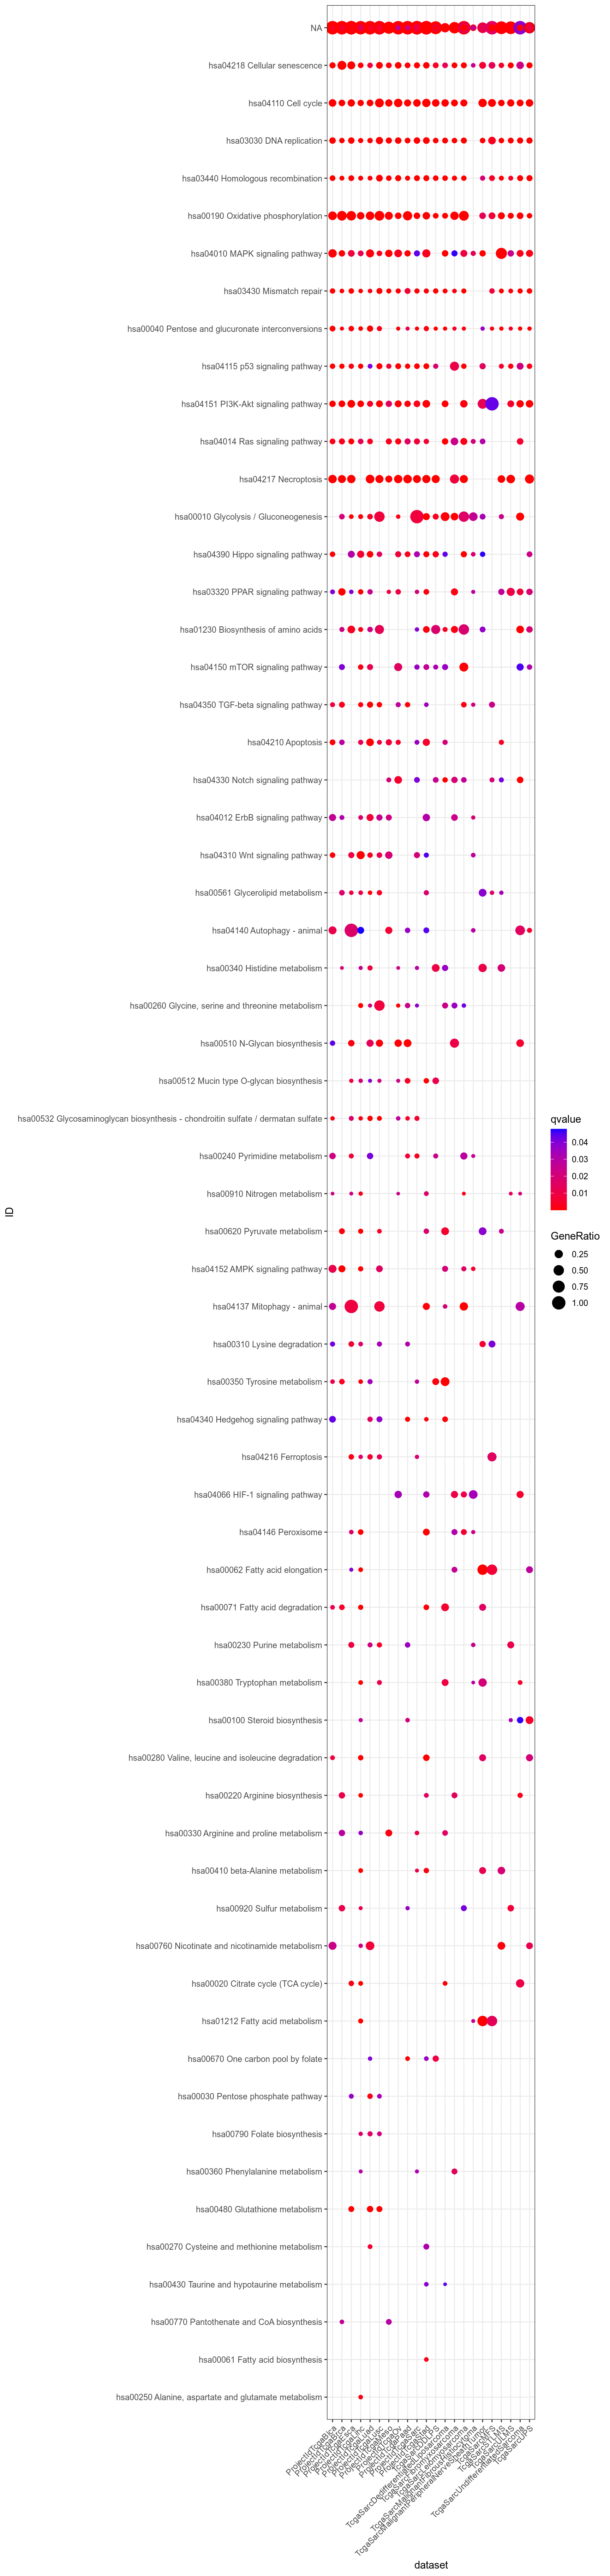
Figure 3.160: Dotplot for Kegg significant (q-value < 0.05) in at least one dataset.
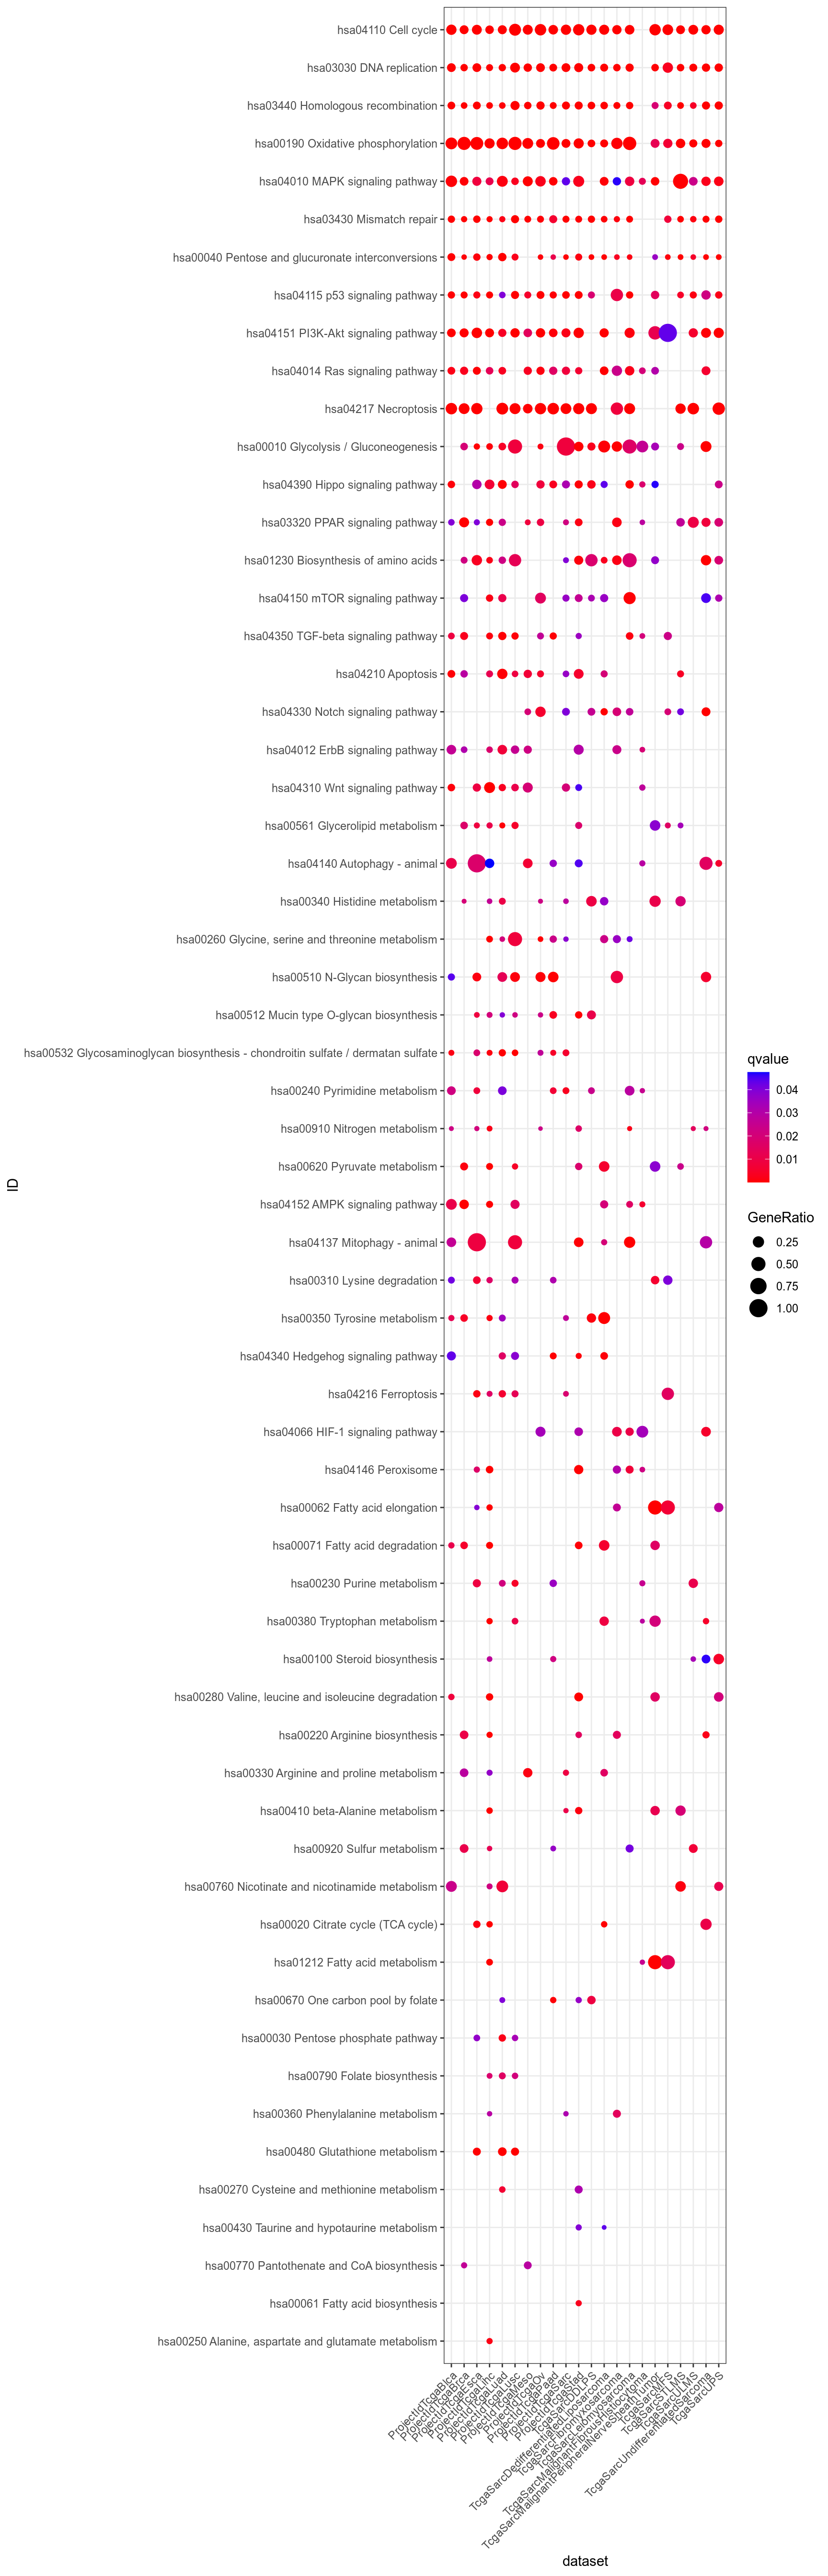
Figure 3.161: Dotplot for Kegg which are significant (q-value < 0.05) in at least one dataset and non ubiquitous, i.e. not significant for all datasets.
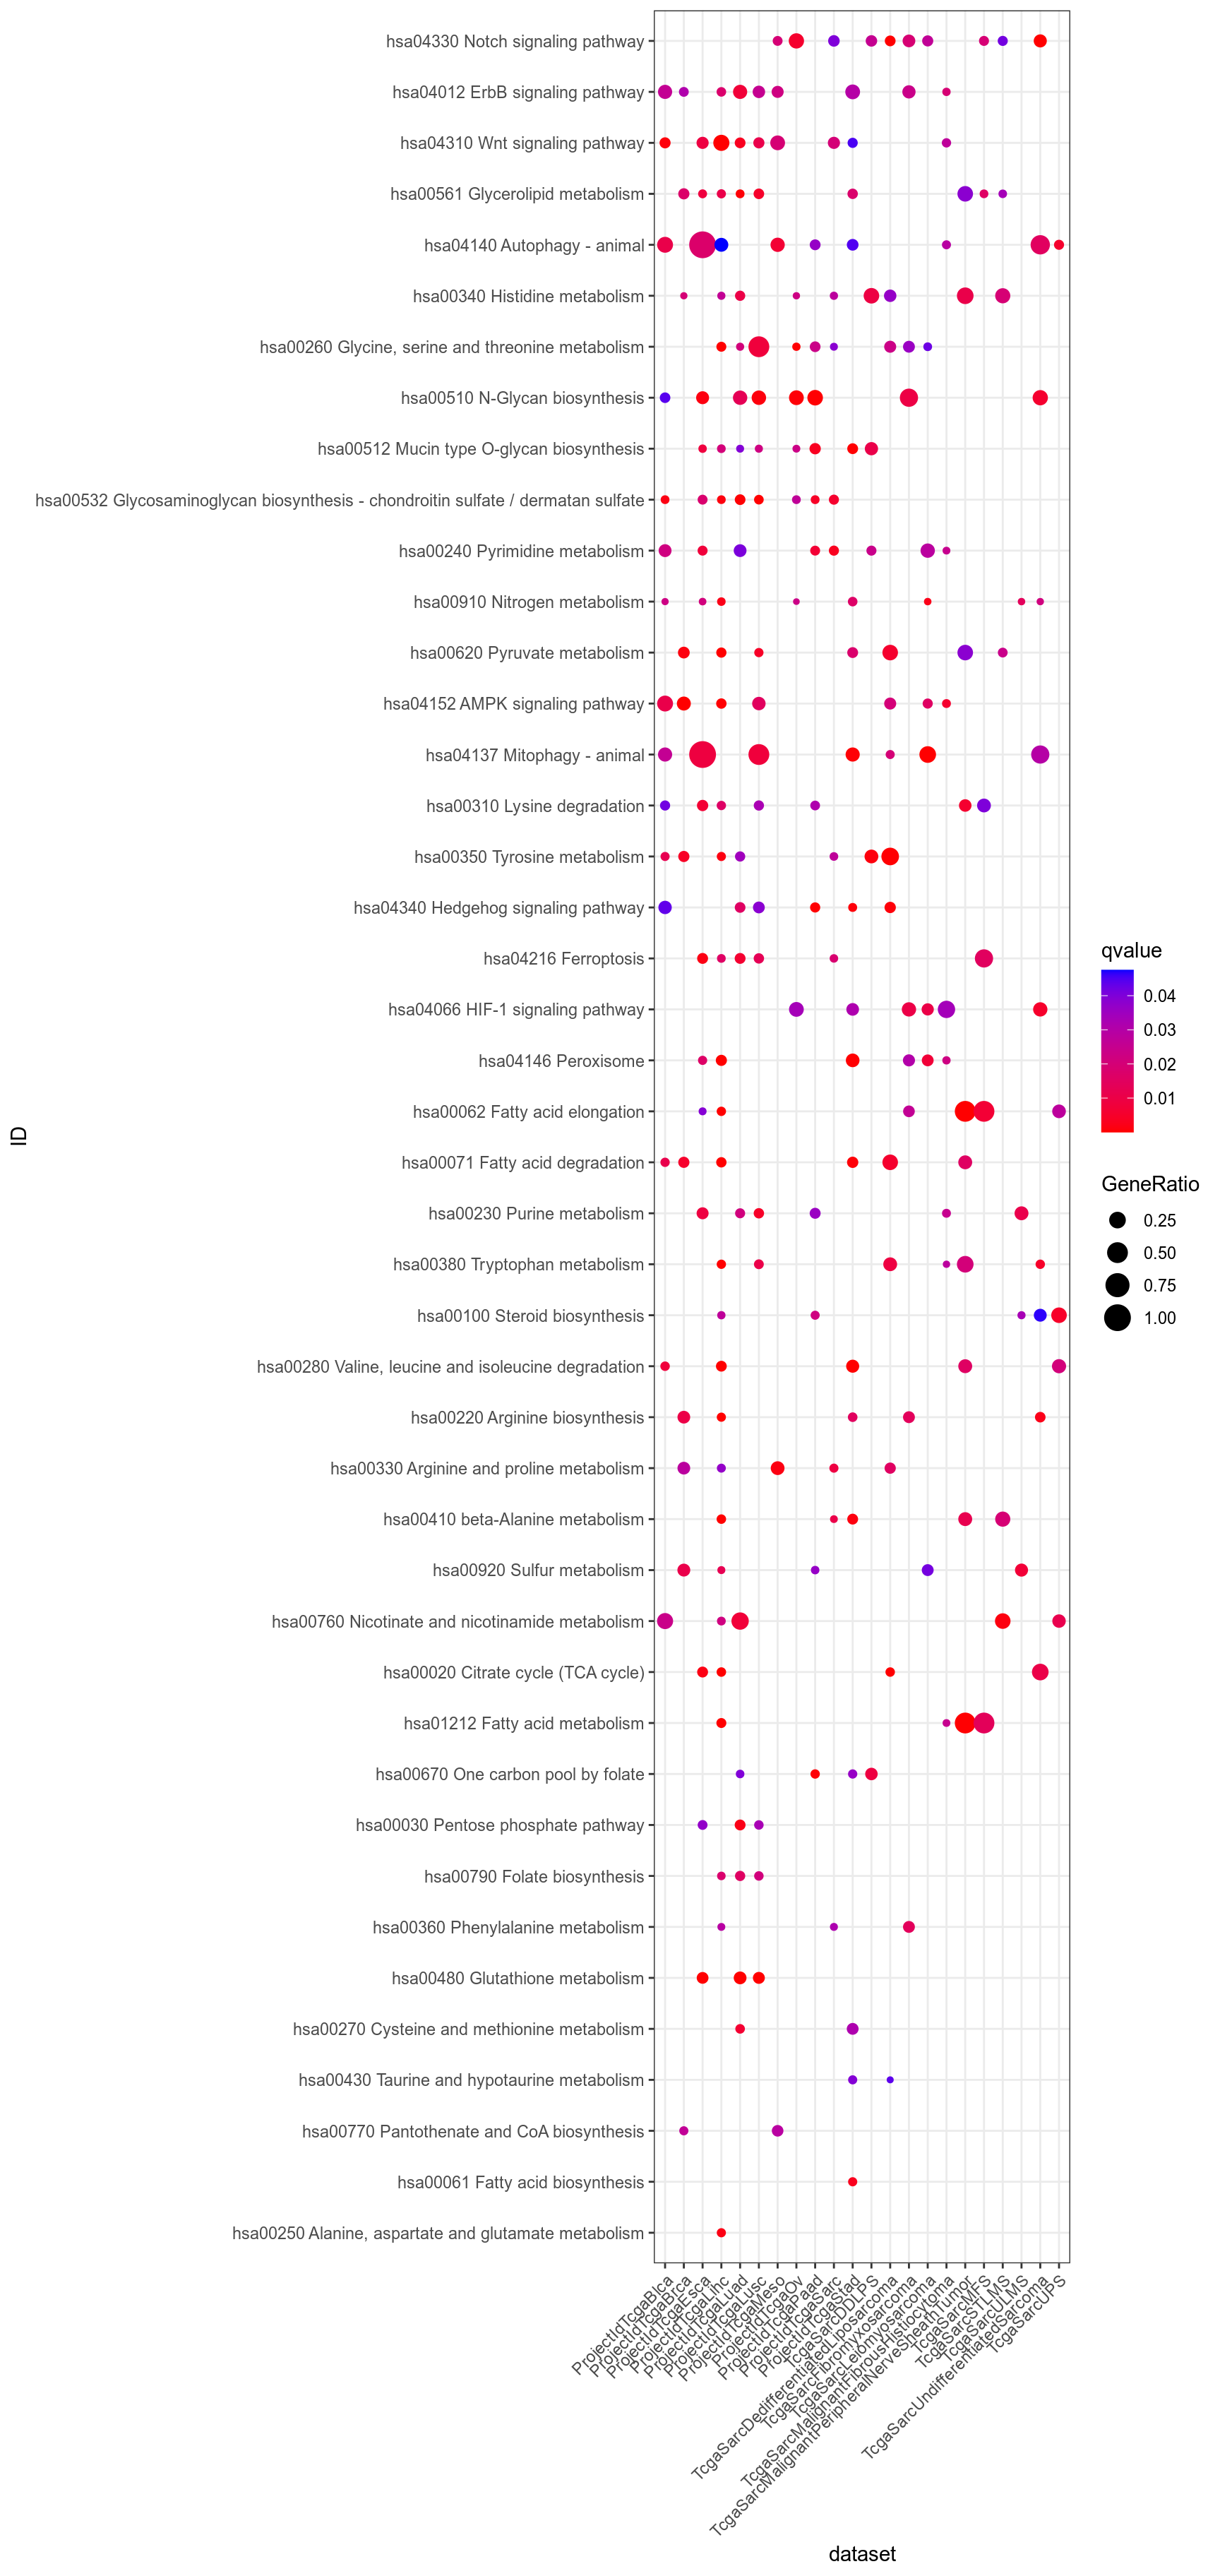
Figure 3.162: Dotplot for Kegg which are significant (q-value < 0.05) in at least one dataset, and uncommon, i.e. significant in less than half the datasets.
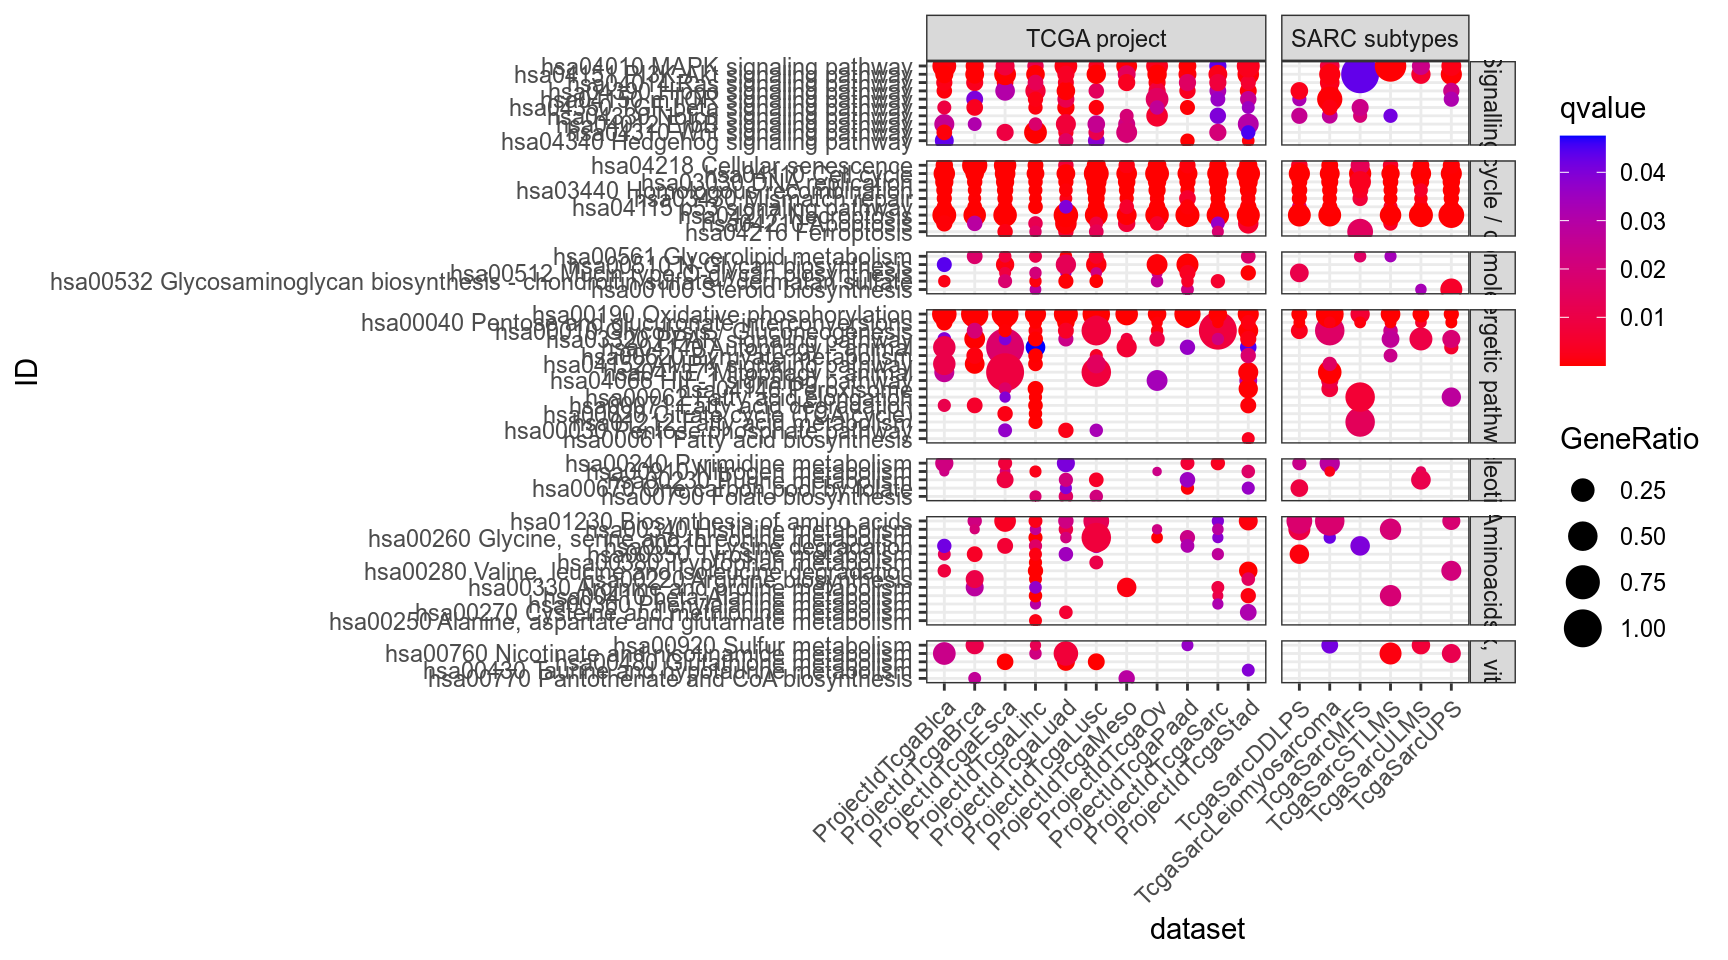
Figure 3.163: Dotplot for Kegg of interest (provided by Philipe Naquet).
3.2.4.2.4 Log10 transformed color scale
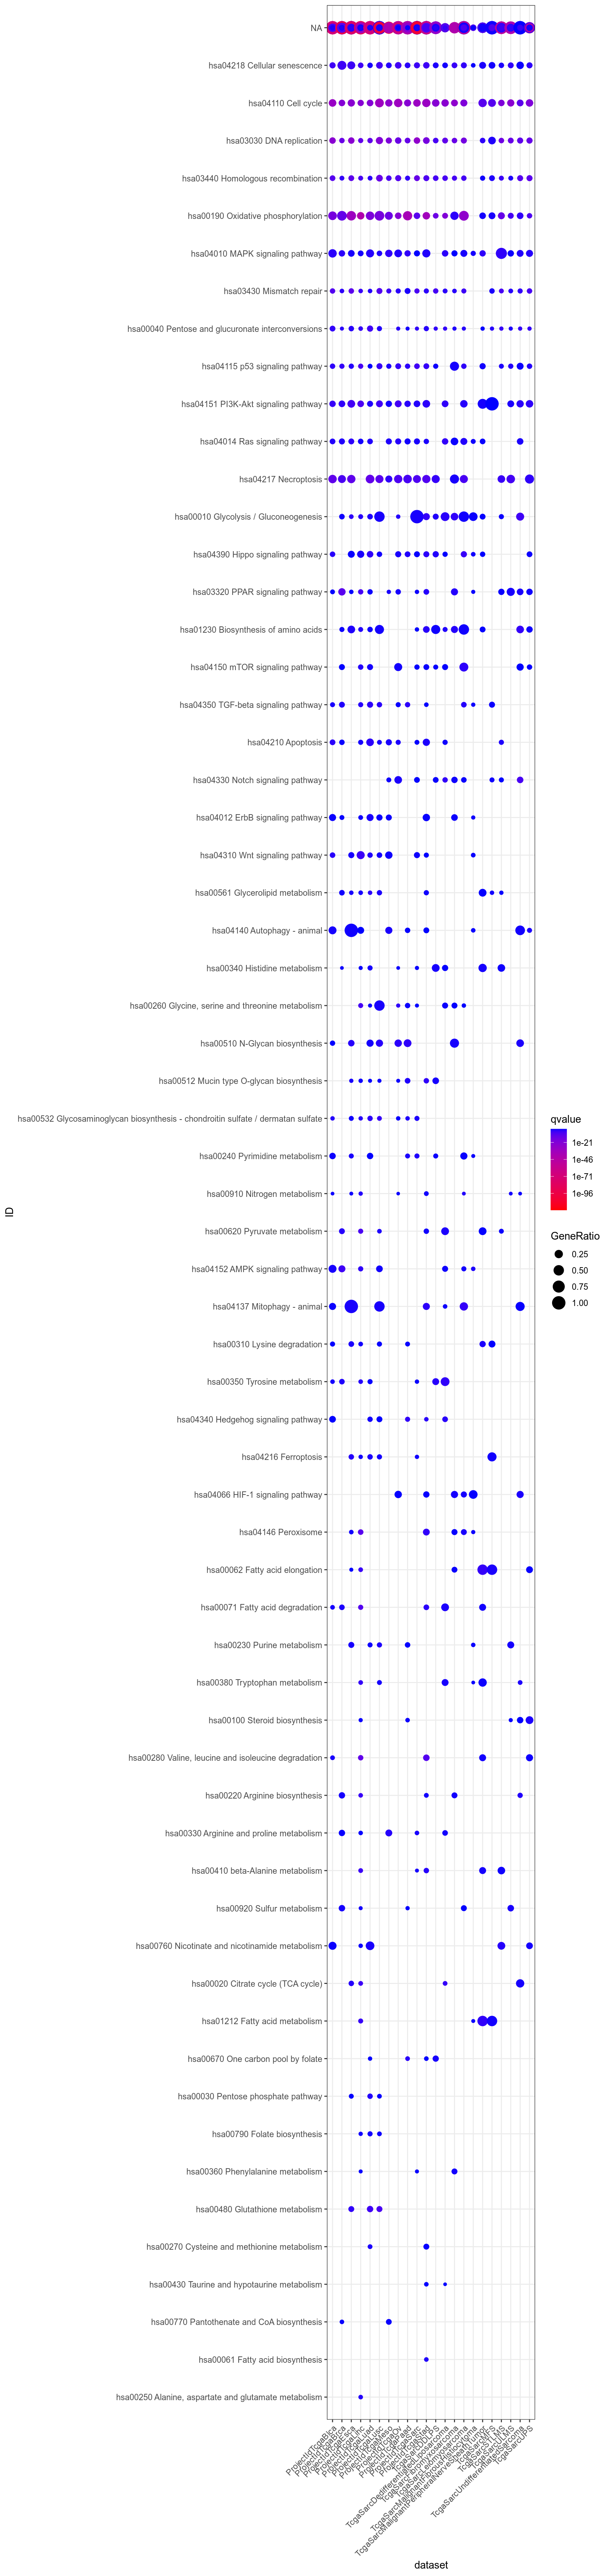
Figure 3.164: Dotplot for Kegg significant (q-value < 0.05) in at least one dataset.
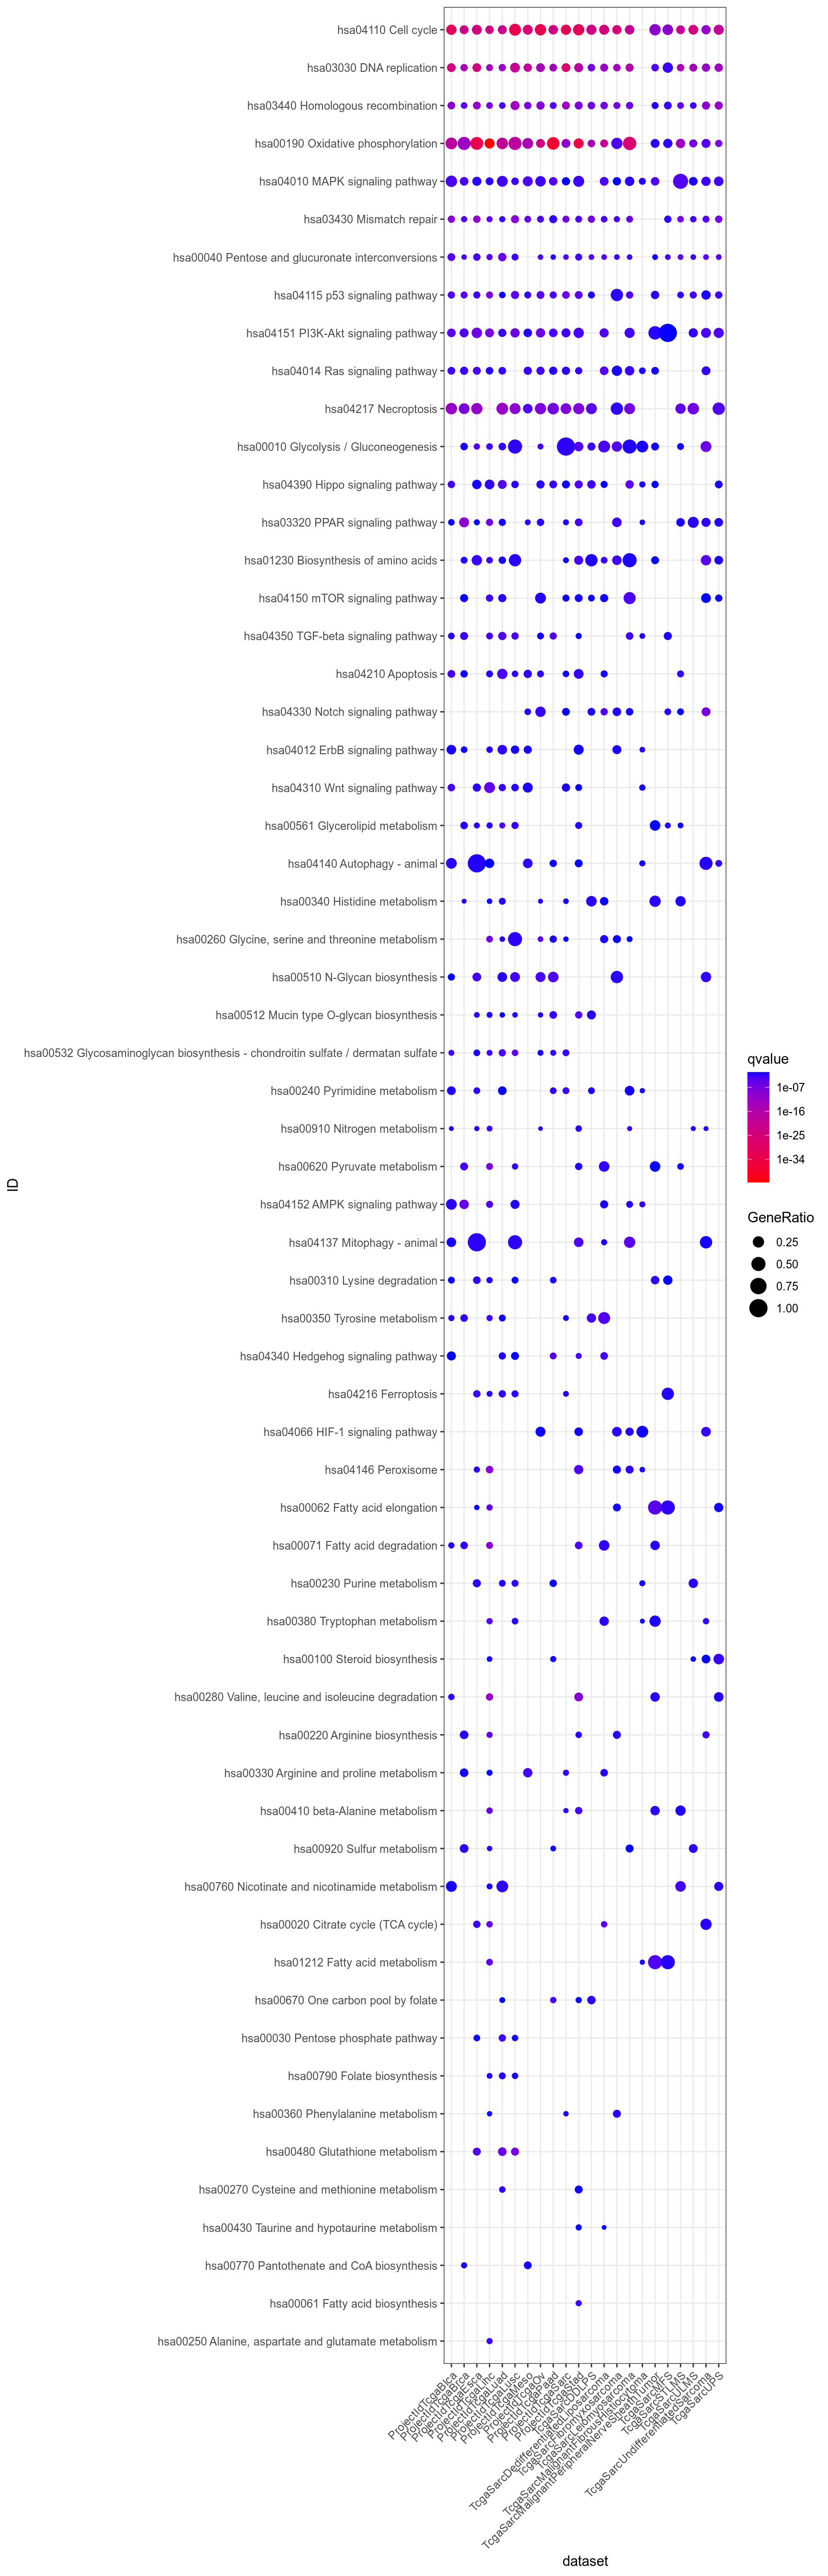
Figure 3.165: Dotplot for Kegg which are significant (q-value < 0.05) in at least one dataset and non ubiquitous, i.e. not significant for all datasets.
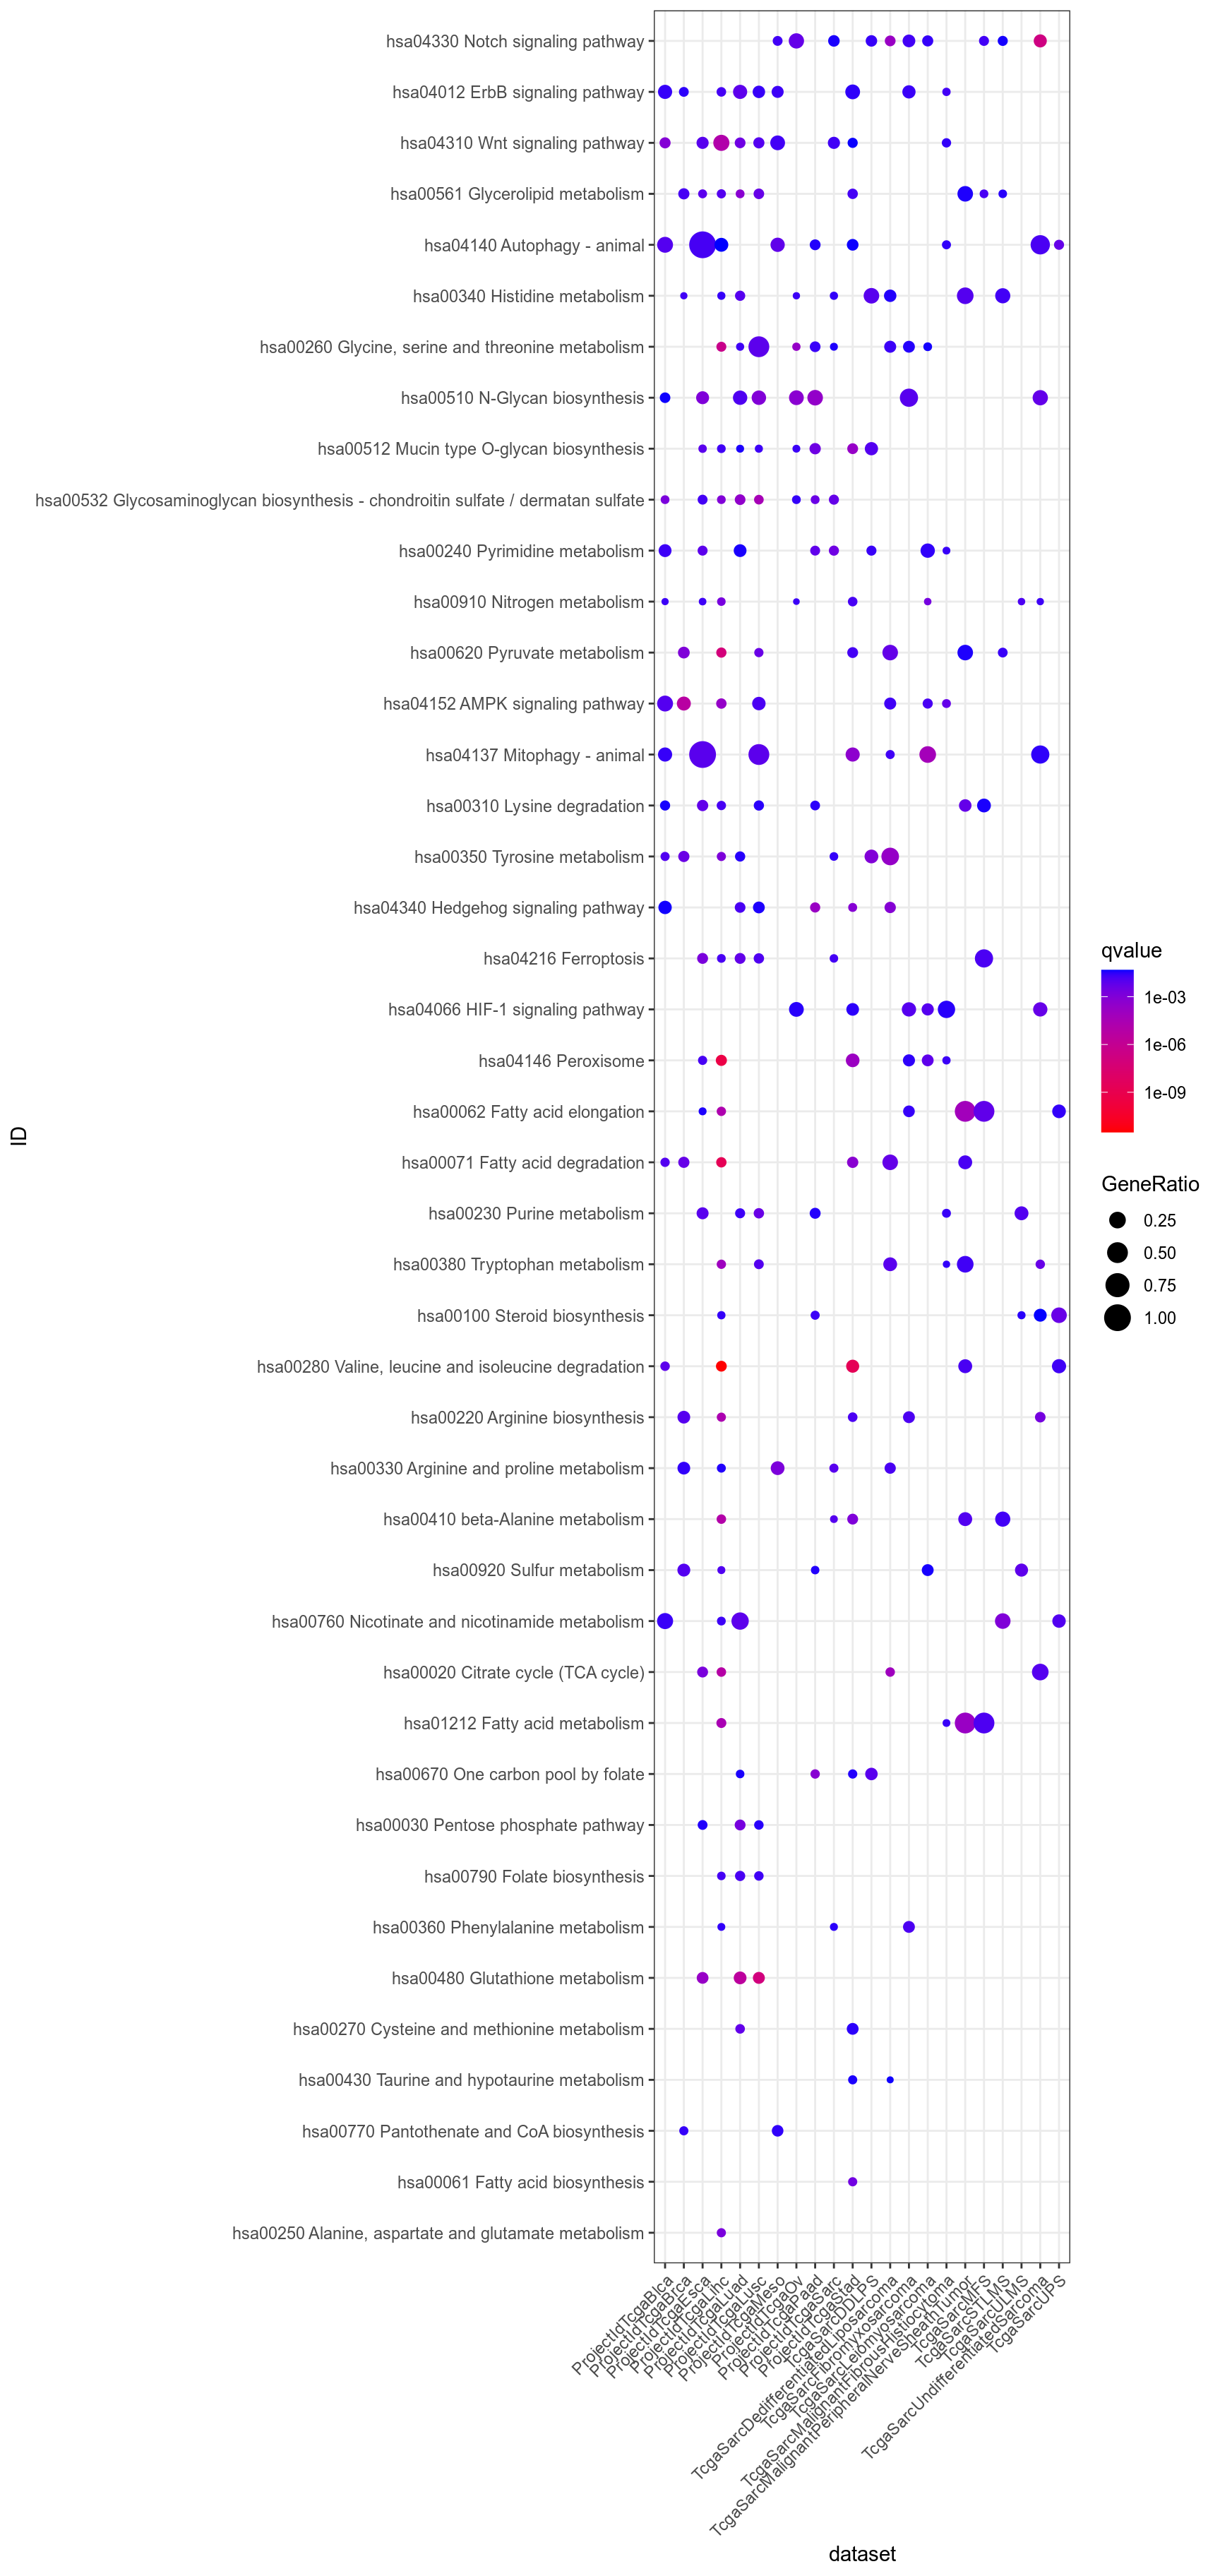
Figure 3.166: Dotplot for Kegg which are significant (q-value < 0.05) in at least one dataset, and uncommon, i.e. significant in less than half the datasets.