3.1.2.1 Primary diagnosis subtypes
TODO: Add filter by * project_id * site_of_resection_or_biopsy

Figure 3.17: Number of samples by sarcoma subtypes.

Figure 3.18: Number of samples by sarcoma subtypes and sex.

Figure 3.19: Distribution of VNN1 signal in all sarcoma subtypes from TCGA-SARC dataset as histogram

Figure 3.20: Distribution of VNN1 signal in all sarcoma subtypes from TCGA-SARC dataset as box-beeswarm-plots
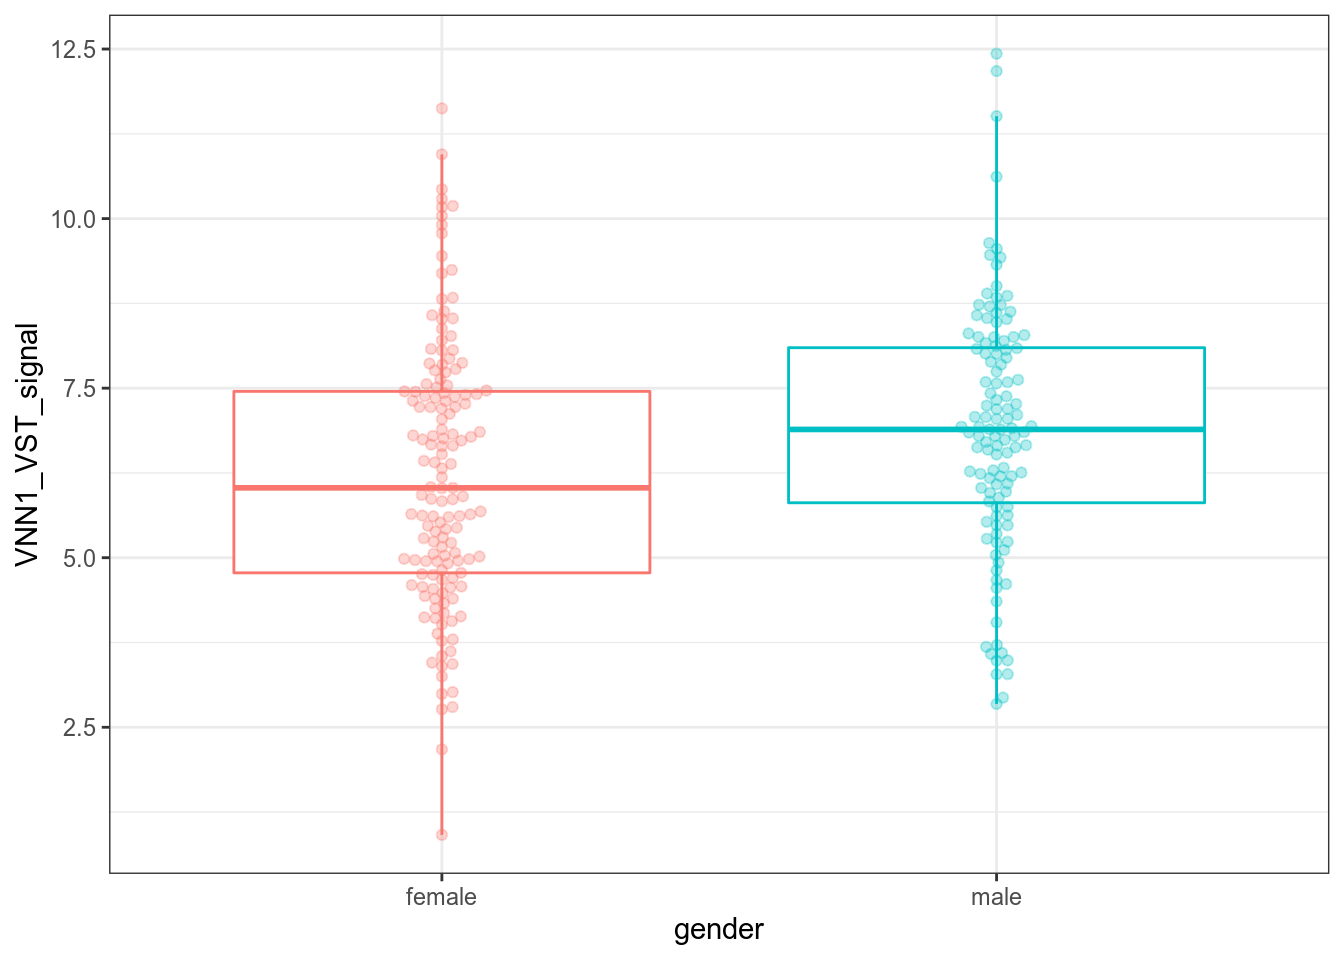
Figure 3.21: Distribution of VNN1 signal in all sarcoma subtypes from TCGA-SARC dataset as box-beeswarm-plots, splitted by gender

Figure 3.22: Distribution of VNN1 signal in all sarcoma subtypes from TCGA-SARC dataset as box-beeswarm-plots, splitted by gender and primary_diagnosis
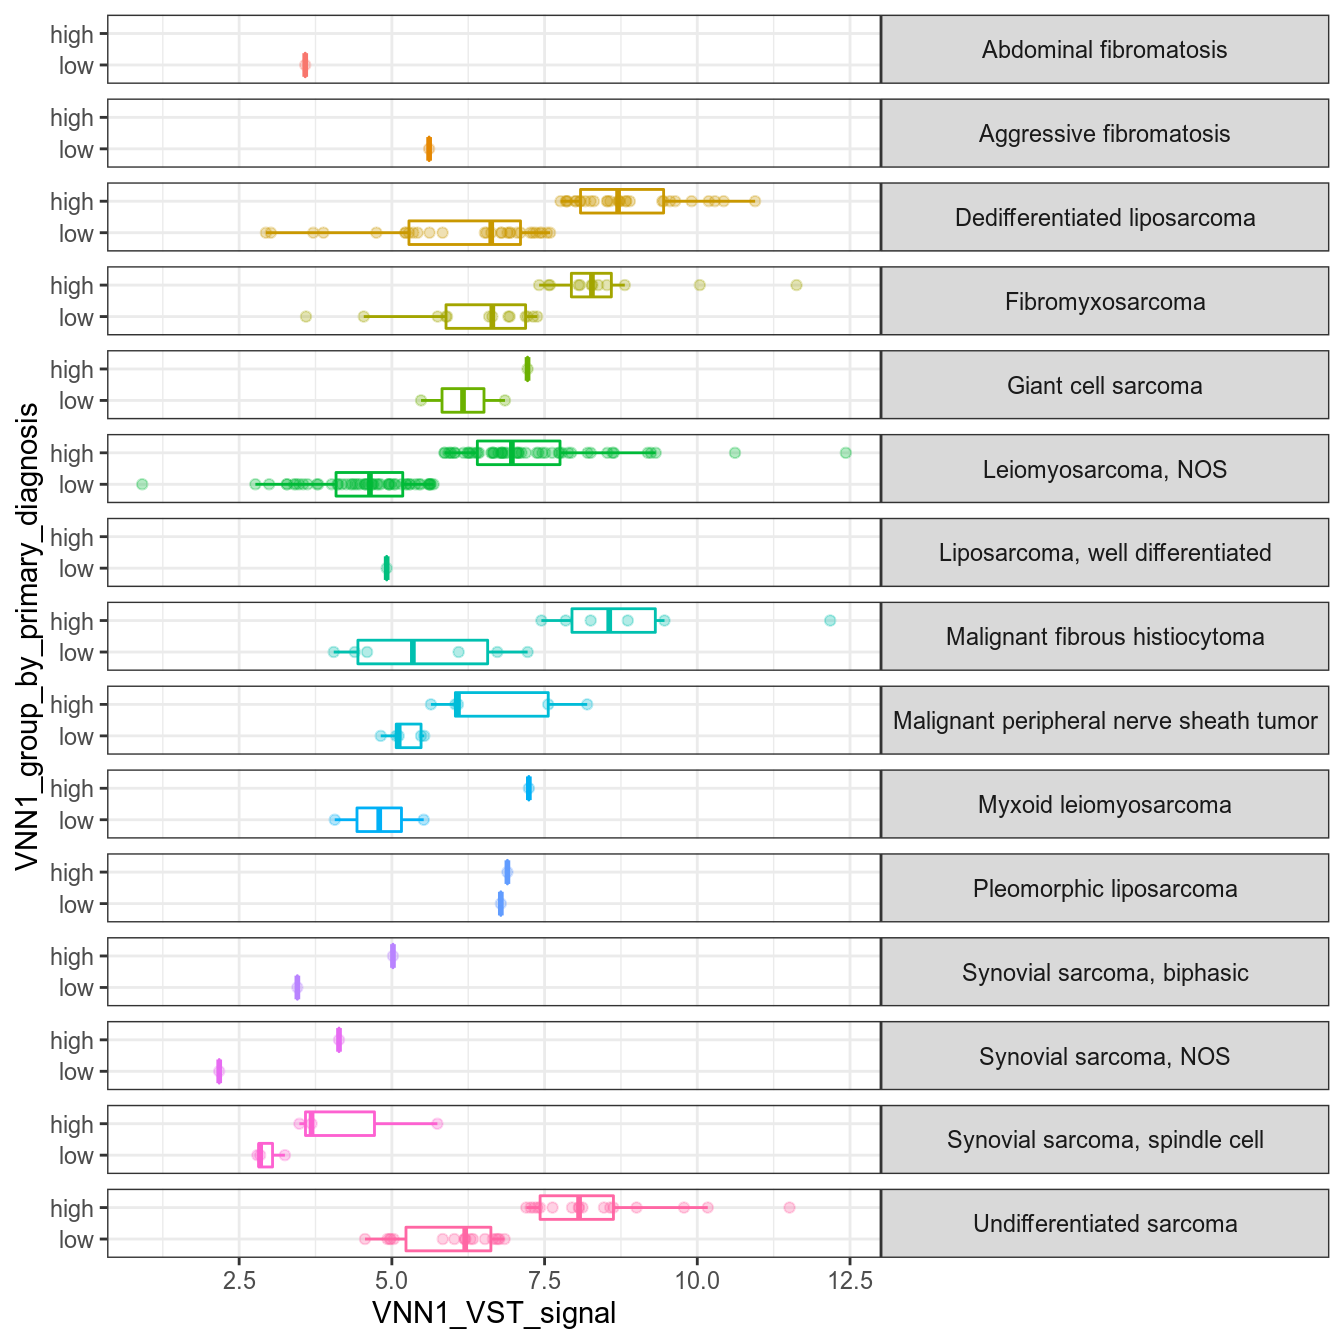
Figure 3.23: Distribution of VNN1 signal in all sarcoma subtypes from TCGA-SARC dataset. VNN1+ and VNN1- classes are called using the median VNN1 VST signal as threshold.