3.2.1.6 TCGA-LUAD dataset
There are 36886 genes and 594 samples in the dataset.
All samples and genes look good for the analysis.
##    Power SFT.R.sq  slope truncated.R.sq  mean.k. median.k.  max.k.
## 1      1   0.0234 -0.465          0.854 4.05e+03  4.00e+03 7730.00
## 2      3   0.6750 -1.990          0.917 2.10e+02  1.58e+02 1040.00
## 3      5   0.8860 -1.980          0.989 2.95e+01  1.29e+01  351.00
## 4      7   0.9230 -1.870          0.997 7.56e+00  1.54e+00  202.00
## 5      9   0.9240 -1.750          0.996 2.79e+00  2.53e-01  129.00
## 6     11   0.9160 -1.670          0.996 1.28e+00  5.25e-02   87.30
## 7     13   0.9060 -1.630          0.986 6.68e-01  1.23e-02   61.00
## 8     15   0.9040 -1.590          0.991 3.82e-01  3.22e-03   43.90
## 9     17   0.9000 -1.560          0.991 2.33e-01  8.96e-04   32.30
## 10    19   0.9050 -1.520          0.989 1.50e-01  2.60e-04   24.20
## 11    21   0.9140 -1.480          0.982 1.00e-01  7.83e-05   18.40
## 12    23   0.9530 -1.410          0.992 6.94e-02  2.42e-05   14.30
## 13    25   0.9570 -1.390          0.990 4.95e-02  7.54e-06   11.70
## 14    27   0.9410 -1.400          0.979 3.62e-02  2.44e-06    9.89
## 15    29   0.9430 -1.390          0.975 2.71e-02  8.01e-07    8.42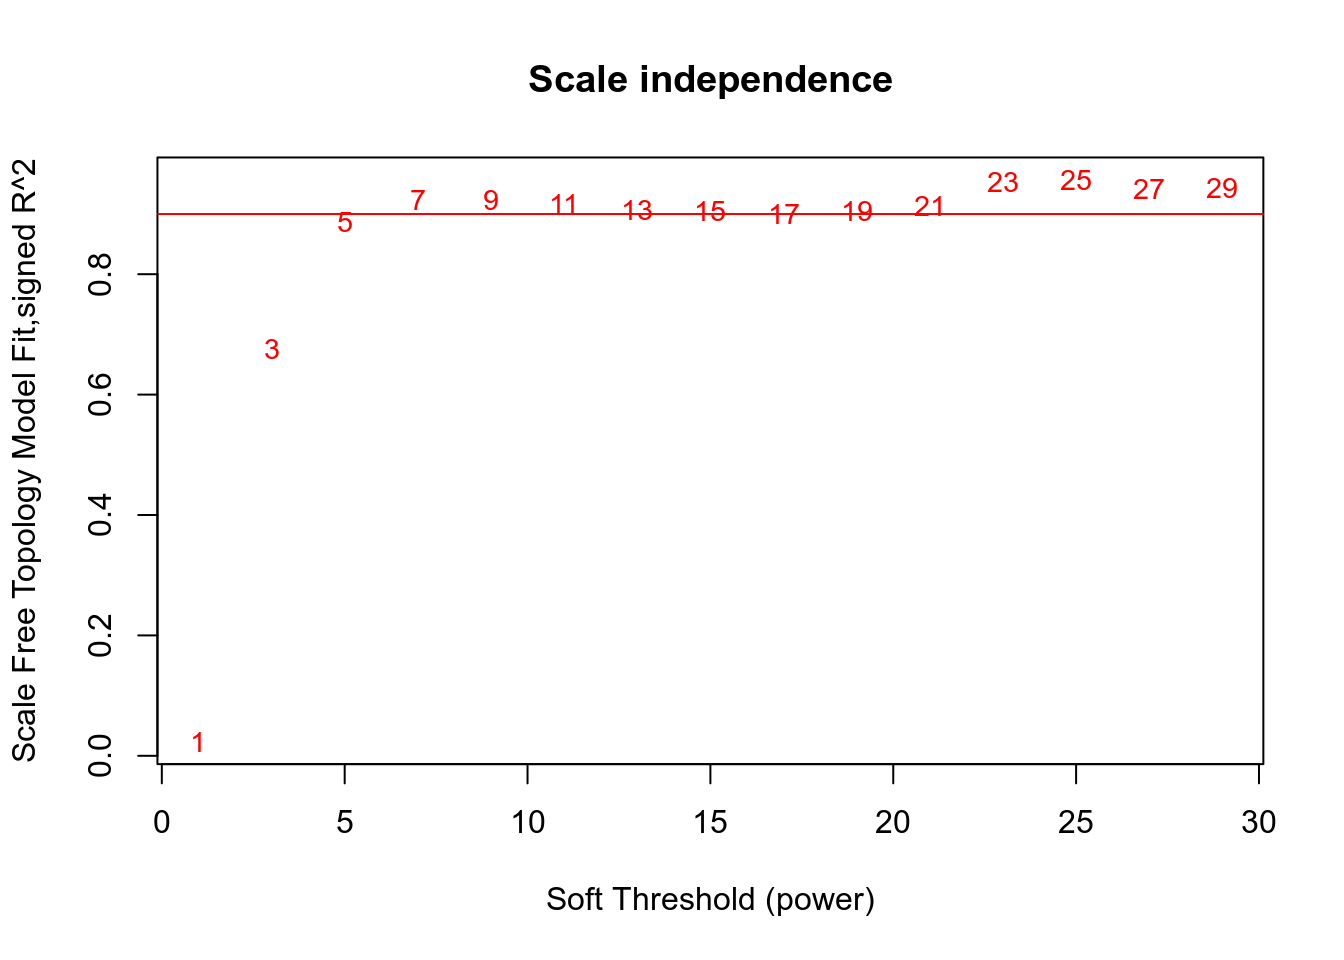

Network is computed using power=5.
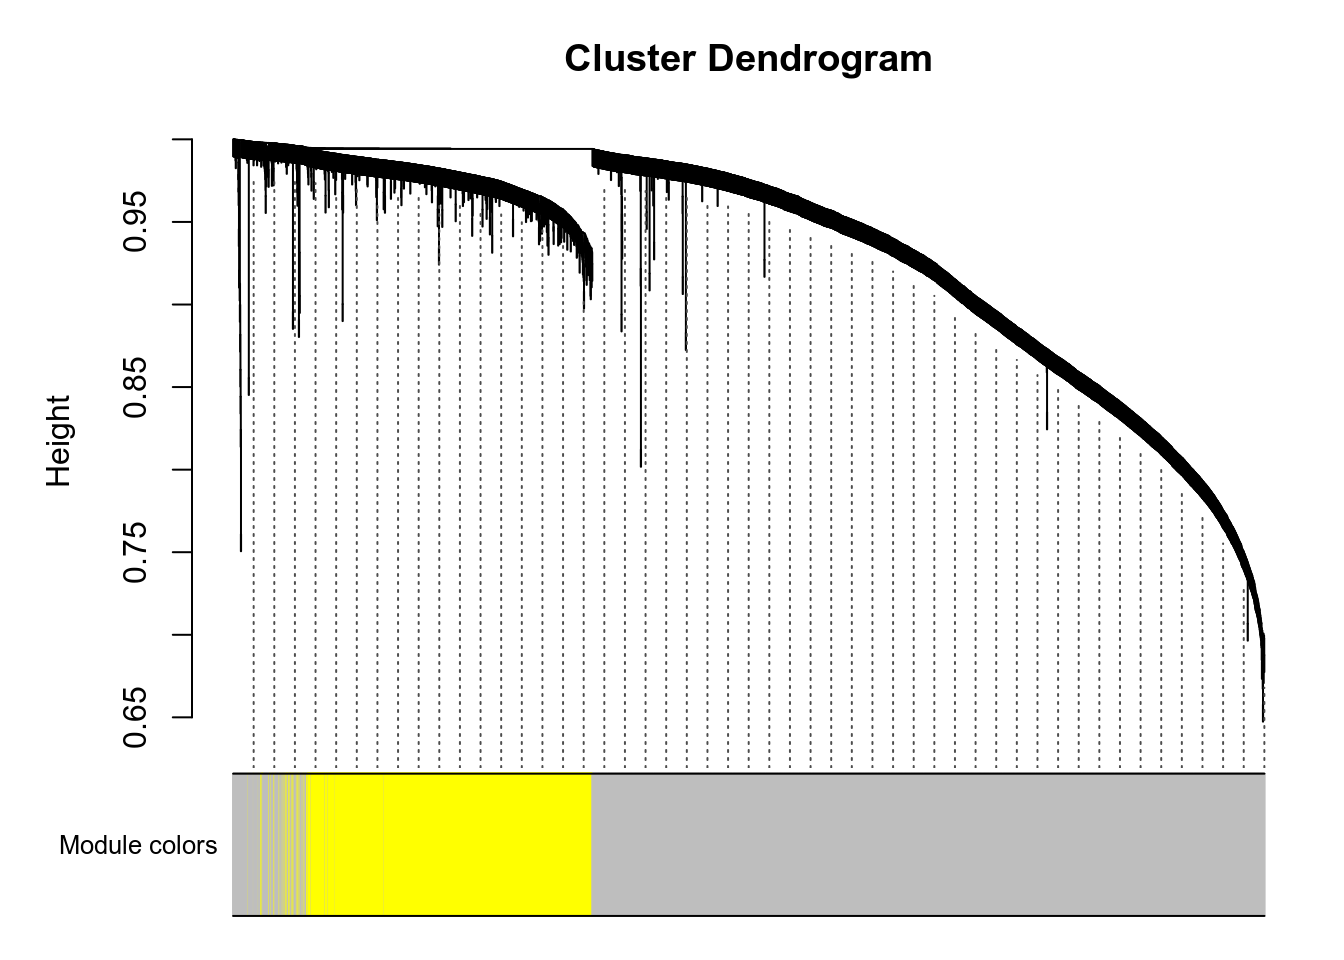
Here are the modules for a few genes of interest:
- VNN1 is in the grey module.
- PPARA is in the red module.
- PPARD is in the yellowgreen module.
- PPARG is in the purple module.
- PPARGC1A is in the tan module.
- PPARGC1B is in the violet module.
g:Profiler results for all modules are available here. Since there are many modules, you should expect at least 1 minute computation on the g:Profiler website for this query. Check below for faster queries focused on VNN1 module.

Figure 3.56: Pathway

Figure 3.57: Kegg
.](_main_files/figure-html/resultsWgcnaProjectIdTcgaLuadKnitPlotEnrichHallmarks-1.png)
Figure 3.58: MSigDb Hallmarks. readable pdf version.
## No enriched DO term in these classesTo check that module-to-genes reattribution is working as expected, heatmap of signal for VNN1 module is produced, both as absolute values and as Z-score ones.
## VNN1 module contains more than 2000 genes. Heatmap generation is skippedVNN1 module contains more than 2000 genes. Heatmap generation is skipped
## VNN1 module contains more than 5000 genes. Correlation analysis is skippedMore than 5000 genes in VNN1 module. Analysis skipped. You should try to reduce module size.