3.2.3.3 DDLPS
There are 36886 genes and 50 samples in the dataset.
At least some samples or genes look not suitable for the co-expression analysis. After removing them, there remain 36748 genes and 50 samples.
##    Power SFT.R.sq slope truncated.R.sq  mean.k. median.k.  max.k.
## 1      1    0.626 -3.43          0.952 5740.000  5.43e+03 10800.0
## 2      3    0.871 -2.58          0.977  457.000  3.40e+02  2390.0
## 3      5    0.873 -2.33          0.964   76.400  3.91e+01   898.0
## 4      7    0.877 -2.11          0.967   19.800  6.45e+00   443.0
## 5      9    0.919 -1.88          0.983    6.970  1.36e+00   259.0
## 6     11    0.946 -1.71          0.990    3.080  3.41e-01   170.0
## 7     13    0.968 -1.58          0.995    1.610  9.87e-02   120.0
## 8     15    0.974 -1.49          0.991    0.964  3.15e-02    90.1
## 9     17    0.976 -1.42          0.991    0.638  1.09e-02    72.2
## 10    19    0.962 -1.37          0.972    0.457  3.98e-03    59.3
## 11    21    0.961 -1.32          0.963    0.347  1.51e-03    49.7
## 12    23    0.947 -1.27          0.935    0.277  6.00e-04    42.2
## 13    25    0.945 -1.22          0.930    0.230  2.43e-04    36.3
## 14    27    0.944 -1.20          0.929    0.196  1.02e-04    34.3
## 15    29    0.885 -1.24          0.853    0.172  4.31e-05    34.0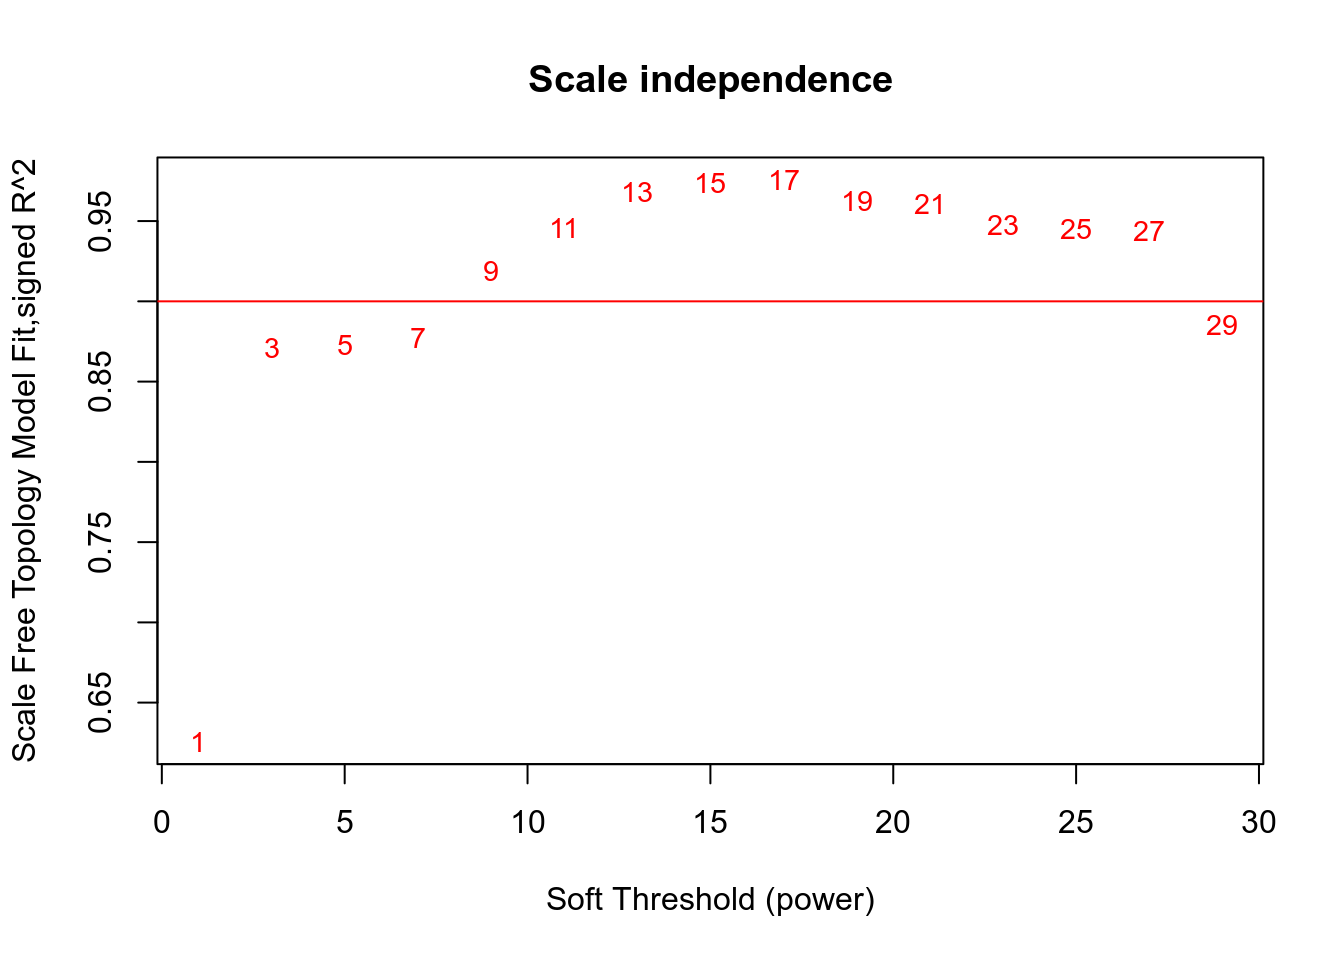
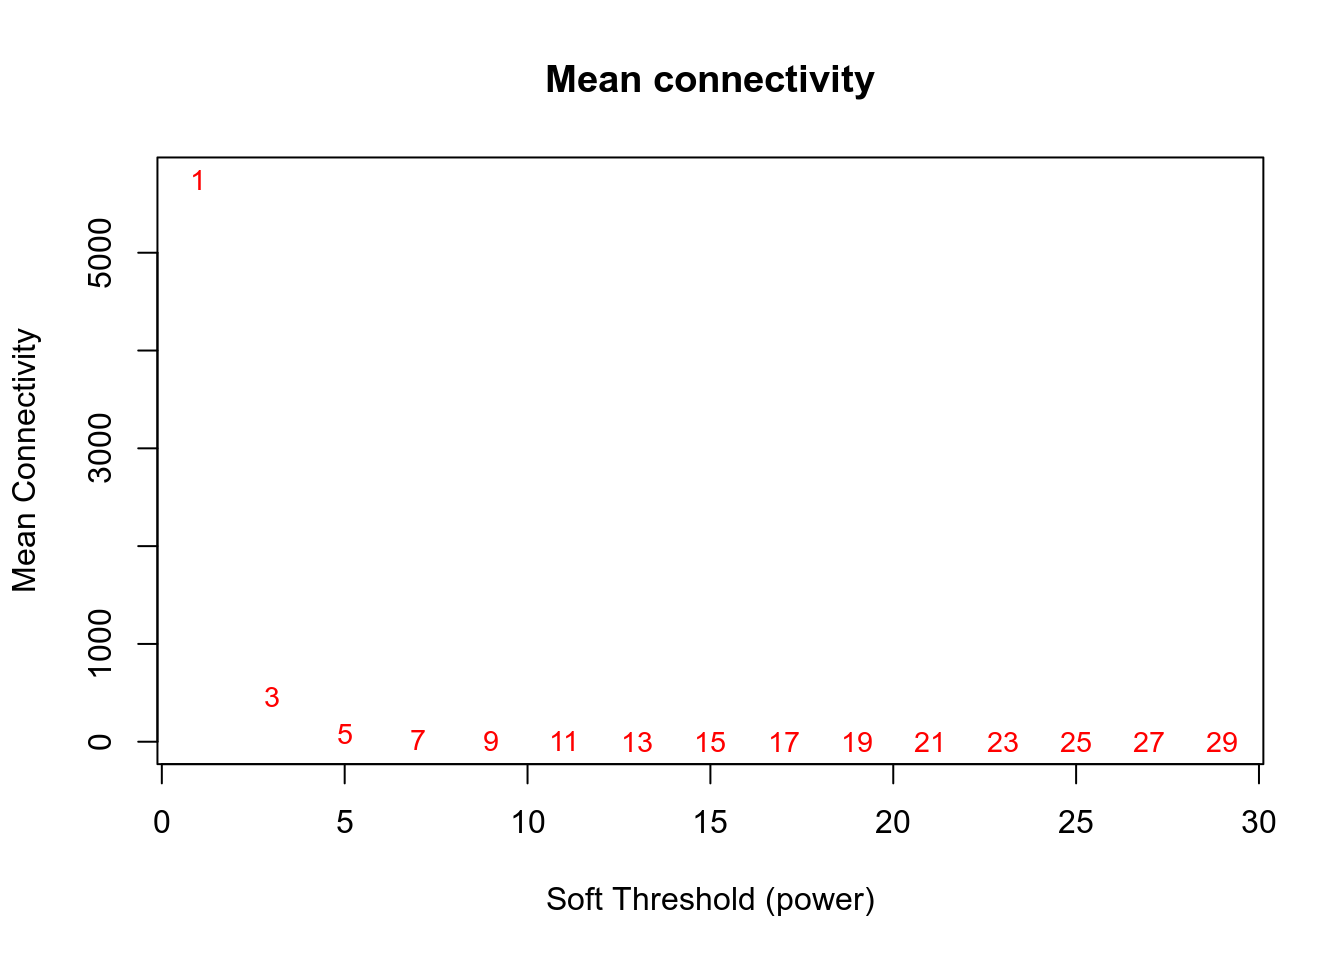
Network is computed using power=3.
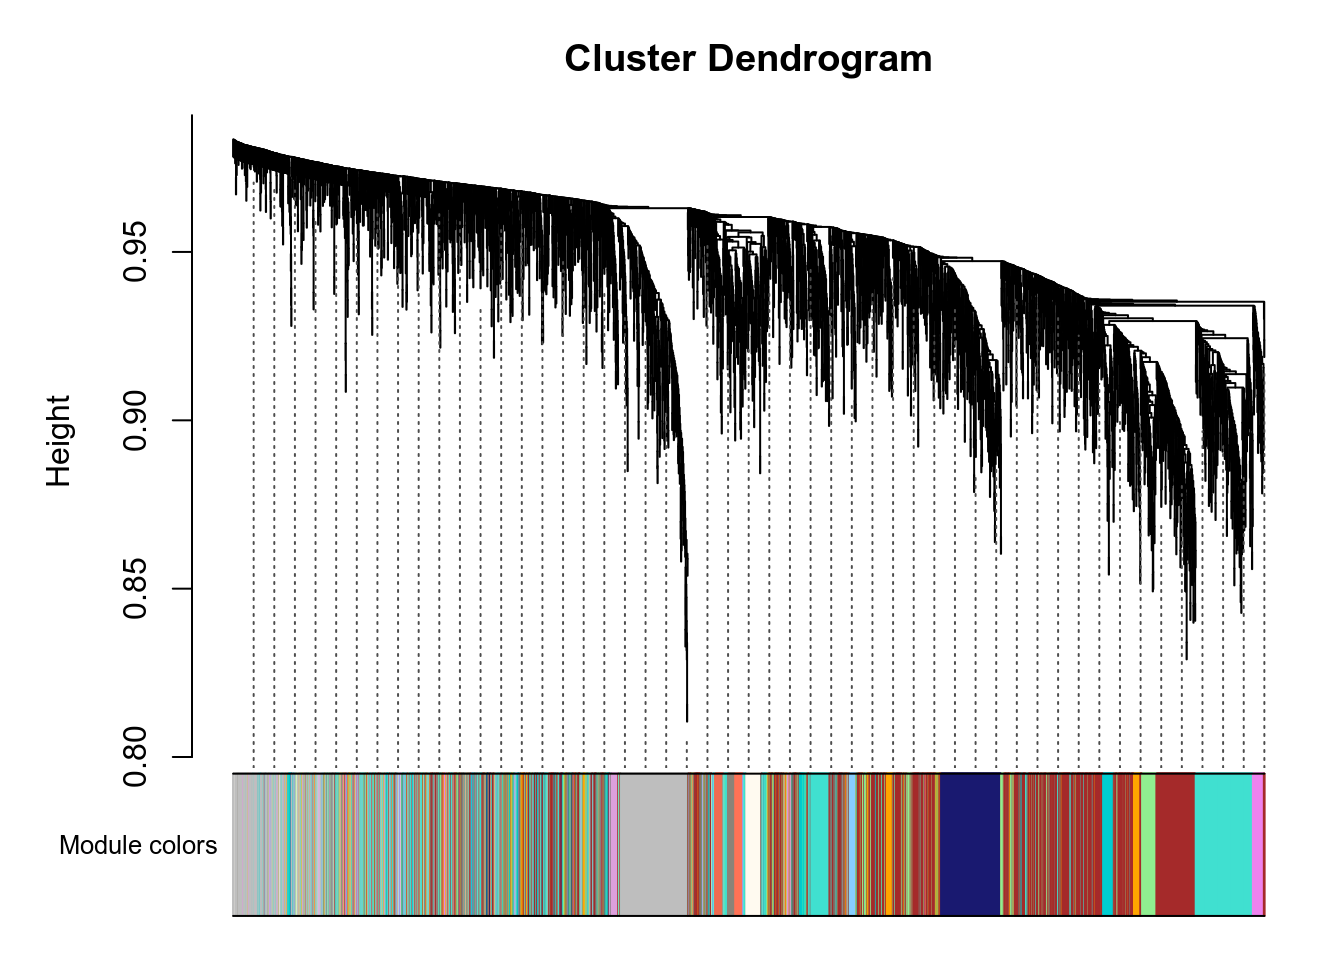
Here are the modules for a few genes of interest:
- VNN1 is in the blue module.
- PPARA is in the lightcyan module.
- PPARD is in the turquoise module.
- PPARG is in the lightyellow module.
- PPARGC1A is in the grey module.
- PPARGC1B is in the darkgrey module.
g:Profiler results for all modules are available here. Since there are many modules, you should expect at least 1 minute computation on the g:Profiler website for this query. Check below for faster queries focused on VNN1 module.
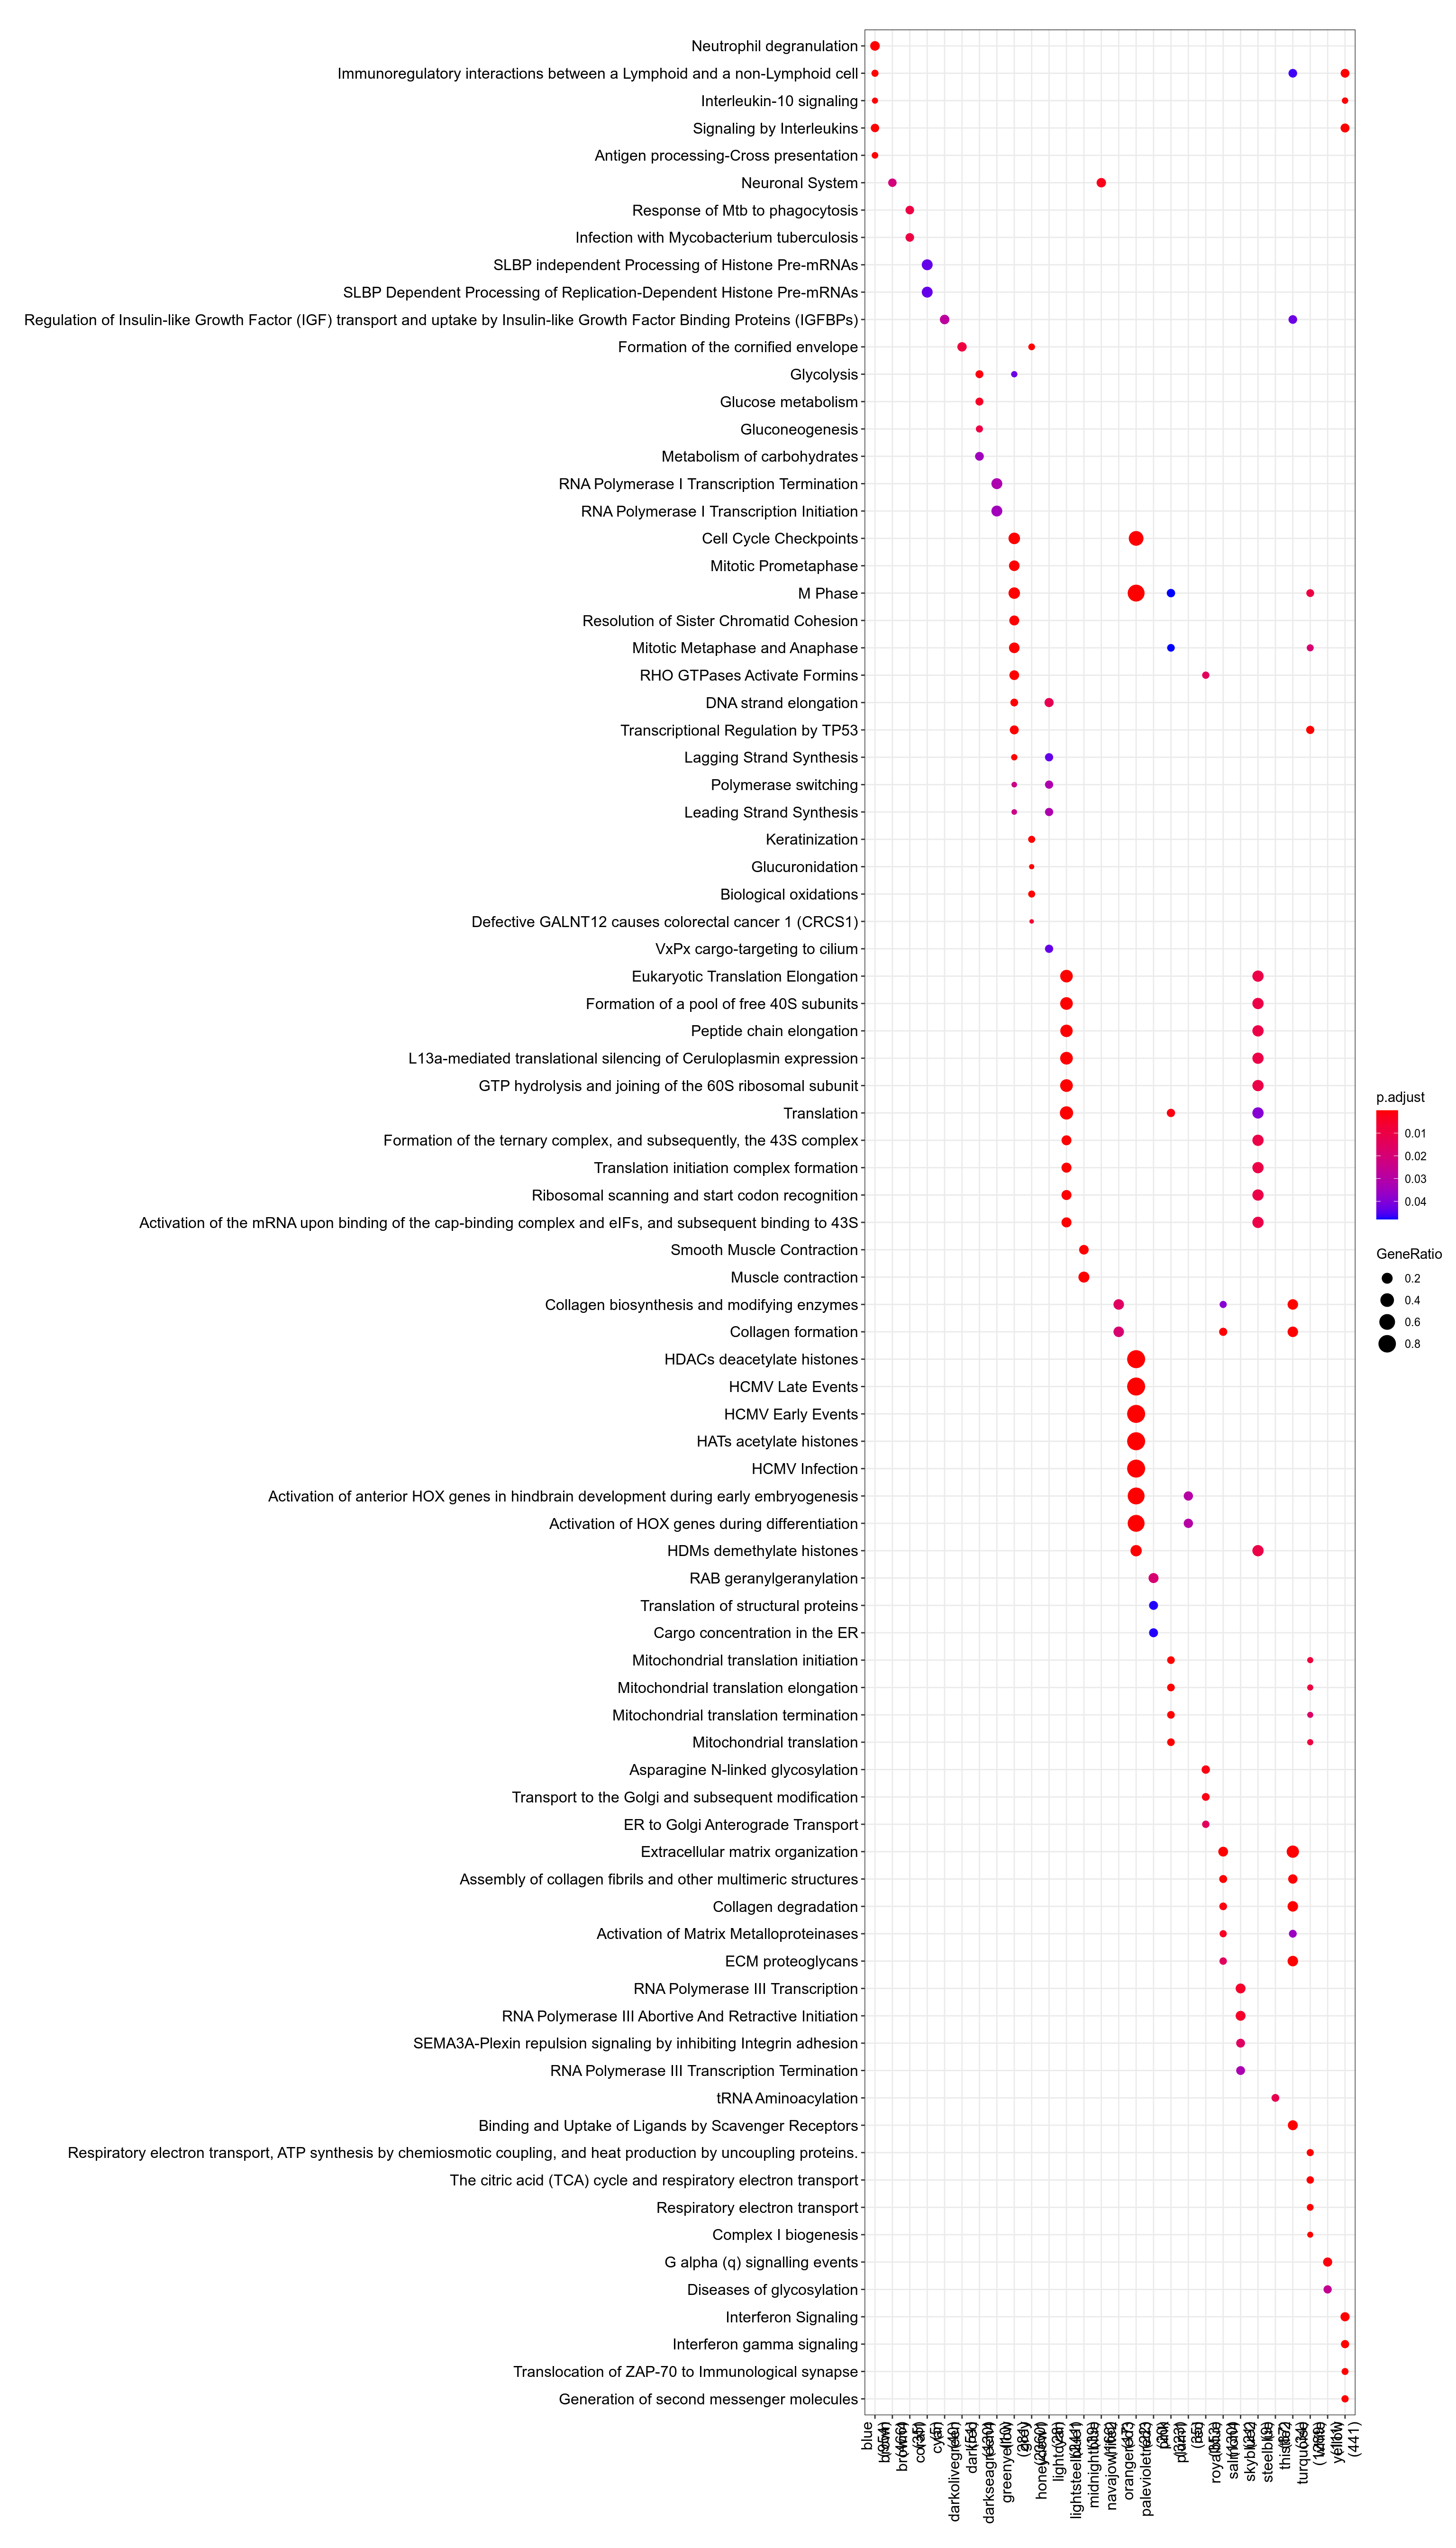
Figure 3.129: Pathway

Figure 3.130: Kegg
.](_main_files/figure-html/resultsWgcnaTcgaSarcDDLPSKnitPlotEnrichHallmarks-1.png)
Figure 3.131: MSigDb Hallmarks. readable pdf version.
## No enriched DO term in these classesTo check that module-to-genes reattribution is working as expected, heatmap of signal for VNN1 module is produced, both as absolute values and as Z-score ones.
## VNN1 module contains more than 2000 genes. Heatmap generation is skippedVNN1 module contains more than 2000 genes. Heatmap generation is skipped
.](_main_files/figure-html/resultsWgcnaTcgaSarcDDLPSKnitPlotGenesInVNN1ModuleCorPearson-1.png)
Figure 3.132: Genes in VNN1 module plotted by Pearson correlation against it. Details are available in this table.
- Enrichr results for all genes in VNN1 module are available here
- Enrichr results for genes in VNN1 module and positively correlated with it are available here
- Enrichr results for genes in VNN1 module and negatively correlated with it are available here
- g:Profiler results for all genes in VNN1 module are available here
- g:Profiler results for genes in VNN1 module and positively correlated with it are available here
- g:Profiler results for genes in VNN1 module and negatively correlated with it are available here
- g:Profiler results for comparison of the three queries above are available here