3.2.1.8 TCGA-MESO dataset
There are 36886 genes and 86 samples in the dataset.
At least some samples or genes look not suitable for the co-expression analysis. After removing them, there remain 36812 genes and 86 samples.
##    Power SFT.R.sq slope truncated.R.sq  mean.k. median.k. max.k.
## 1      1    0.195 -2.30          0.935 4.46e+03  4.39e+03 7170.0
## 2      3    0.701 -3.10          0.980 2.28e+02  1.93e+02  957.0
## 3      5    0.787 -3.00          0.981 2.70e+01  1.68e+01  246.0
## 4      7    0.916 -2.04          0.984 5.49e+00  2.19e+00   86.2
## 5      9    0.948 -1.80          0.966 1.68e+00  3.82e-01   54.7
## 6     11    0.947 -1.64          0.963 7.03e-01  8.18e-02   41.8
## 7     13    0.913 -1.54          0.942 3.66e-01  2.03e-02   33.0
## 8     15    0.923 -1.44          0.955 2.21e-01  5.60e-03   26.7
## 9     17    0.930 -1.38          0.956 1.47e-01  1.66e-03   21.9
## 10    19    0.924 -1.33          0.934 1.04e-01  5.12e-04   18.2
## 11    21    0.916 -1.34          0.937 7.76e-02  1.65e-04   17.1
## 12    23    0.417 -1.65          0.325 6.00e-02  5.58e-05   16.2
## 13    25    0.862 -1.38          0.865 4.77e-02  1.92e-05   15.4
## 14    27    0.454 -1.66          0.368 3.90e-02  6.73e-06   14.8
## 15    29    0.394 -1.89          0.282 3.25e-02  2.39e-06   14.2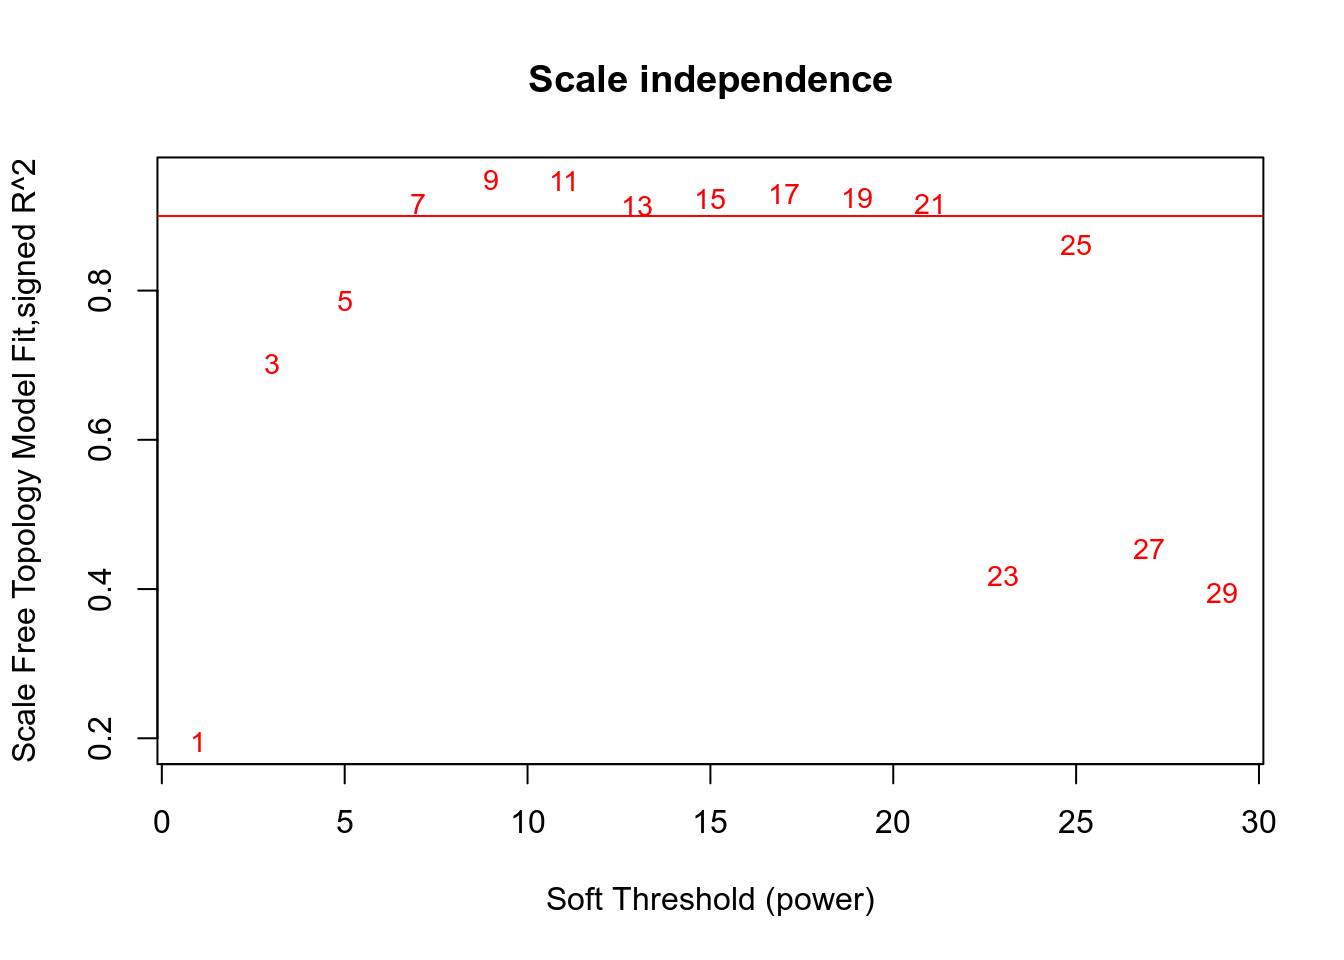
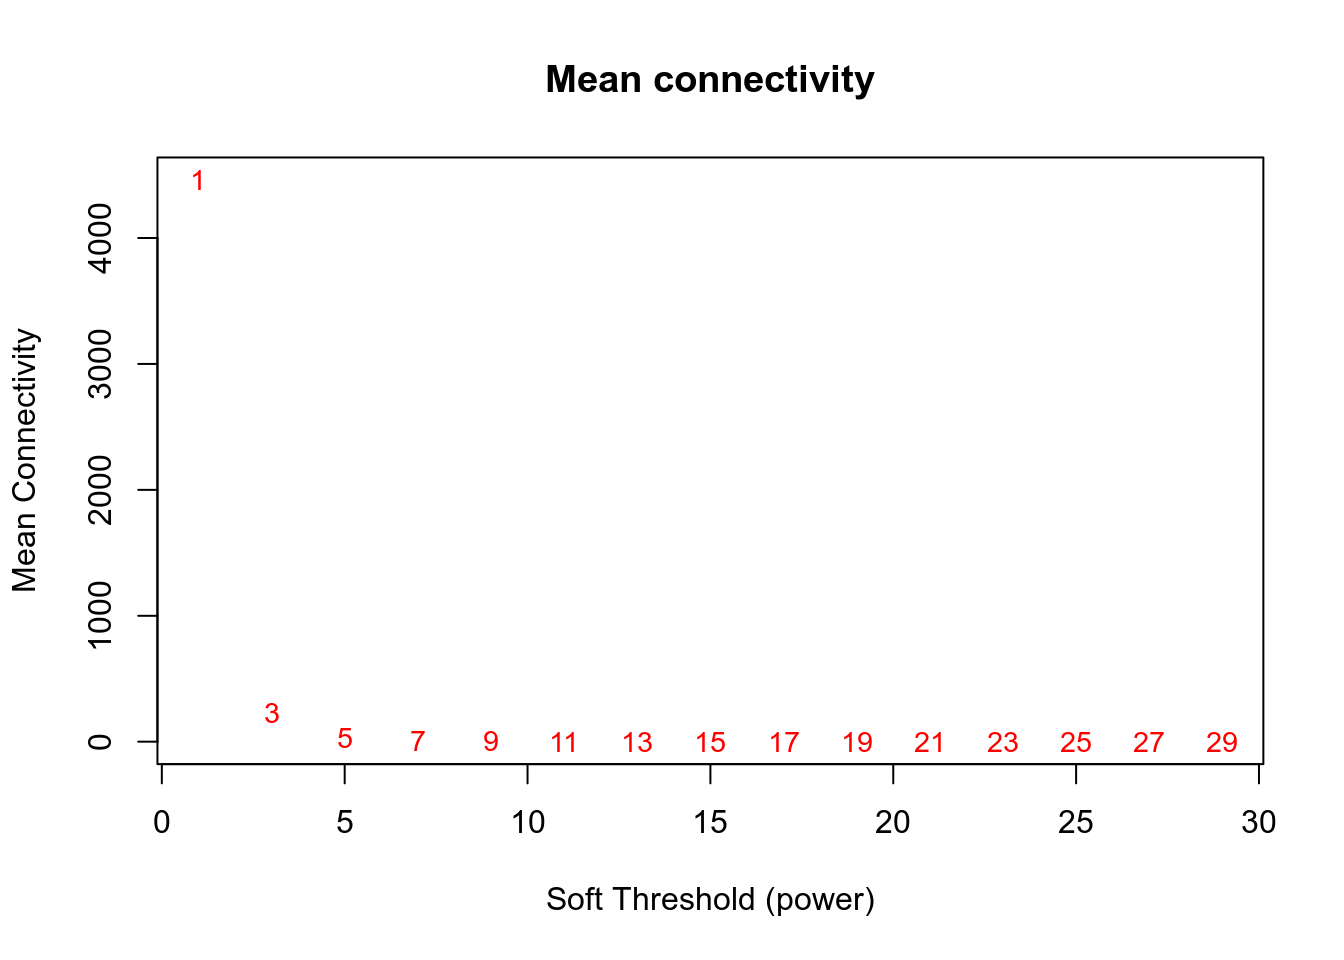
Network is computed using power=7.
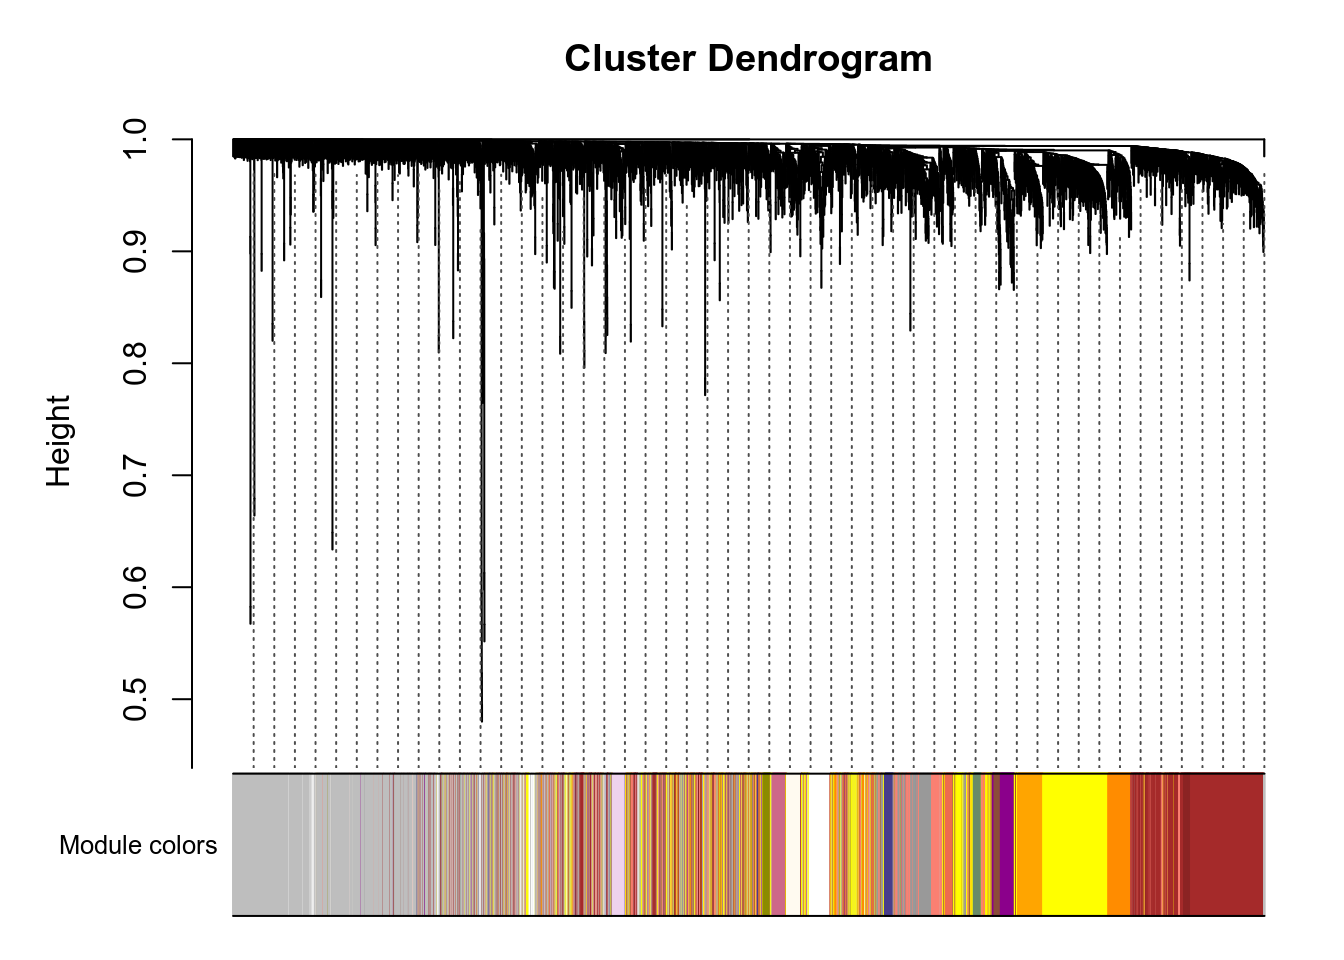
Here are the modules for a few genes of interest:
- VNN1 is in the greenyellow module.
- PPARA is in the grey module.
- PPARD is in the grey module.
- PPARG is in the blue module.
- PPARGC1A is in the turquoise module.
- PPARGC1B is in the turquoise module.
g:Profiler results for all modules are available here. Since there are many modules, you should expect at least 1 minute computation on the g:Profiler website for this query. Check below for faster queries focused on VNN1 module.
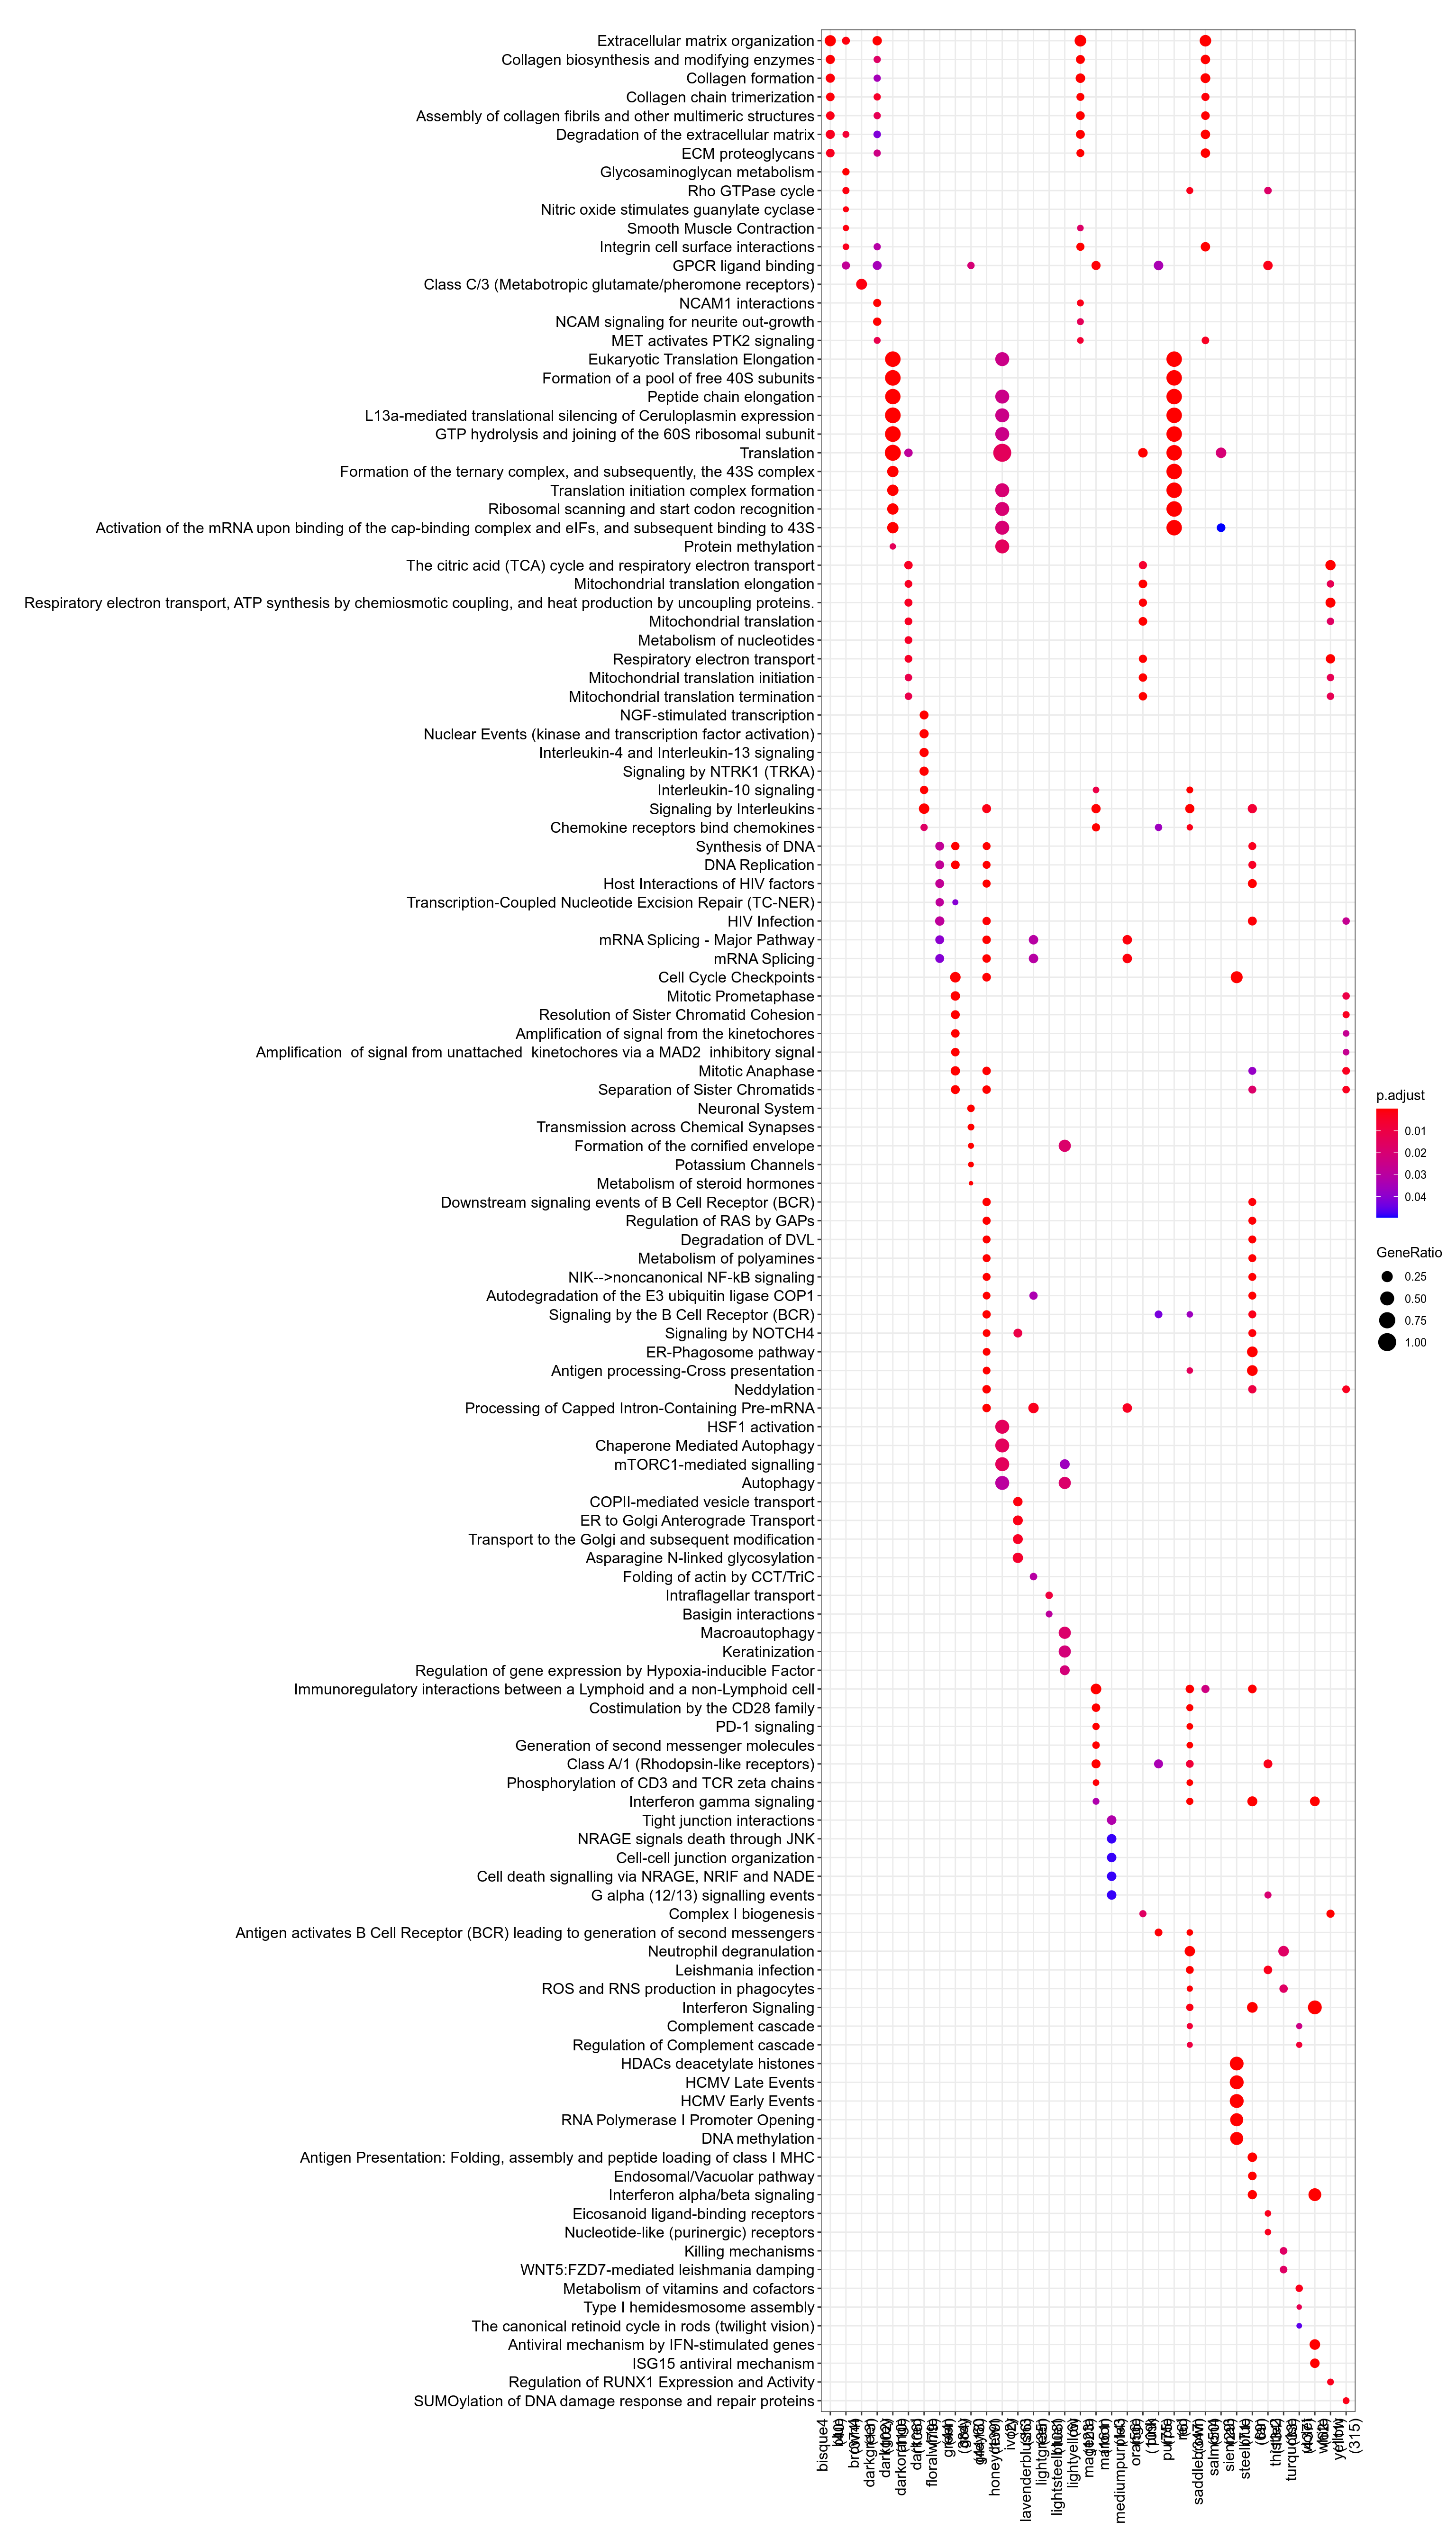
Figure 3.63: Pathway
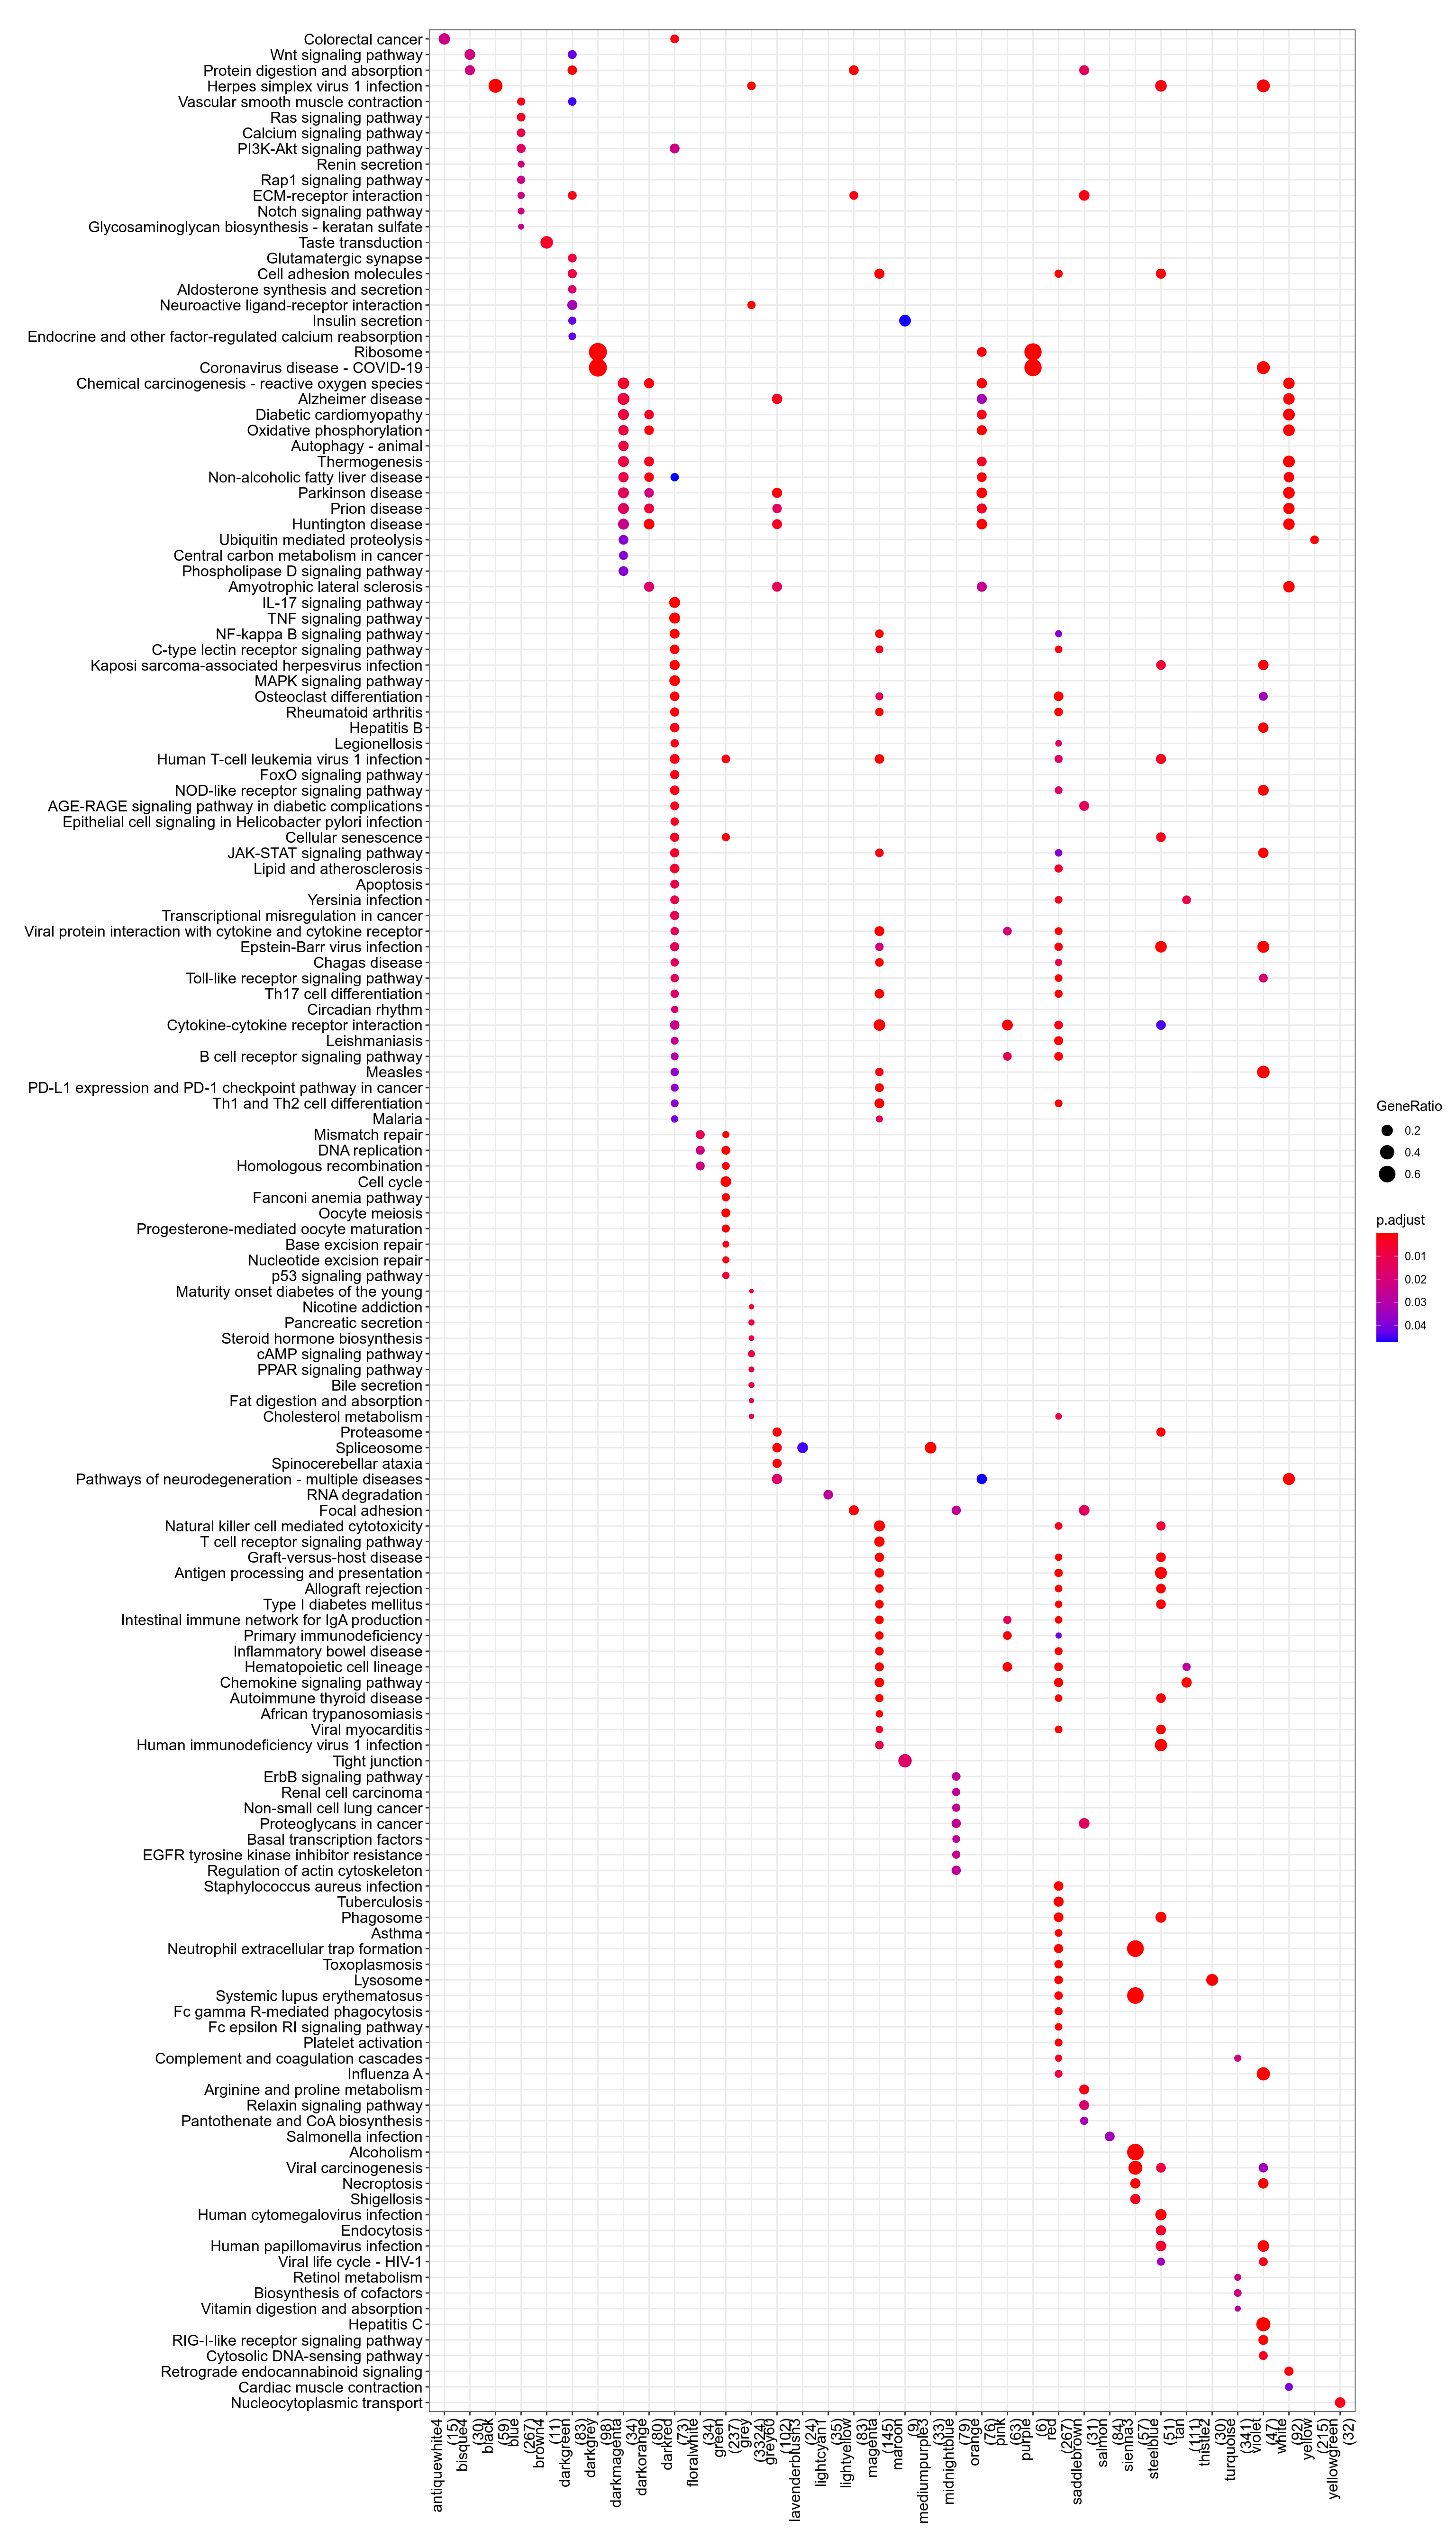
Figure 3.64: Kegg
.](_main_files/figure-html/resultsWgcnaProjectIdTcgaMesoKnitPlotEnrichHallmarks-1.png)
Figure 3.65: MSigDb Hallmarks. readable pdf version.
## No enriched DO term in these classesTo check that module-to-genes reattribution is working as expected, heatmap of signal for VNN1 module is produced, both as absolute values and as Z-score ones.
.](../../../out/bookdown/VNN1_sarcoma/plots/resultsWgcnaProjectIdTcgaMesoKnitPlotHeatmapVNN1ModuleAbsoluteValues.png)
Figure 3.66: log2(vst) signal in VNN1 module. Rows were gene name is prefixed with "-" display negative Z-score for these genes, meaning their signal is anticorrelated with other genes in the cluster. pdf version with readable genes and findable VNN1.
.](../../../out/bookdown/VNN1_sarcoma/plots/resultsWgcnaProjectIdTcgaMesoKnitPlotHeatmapVNN1ModuleZscoreValues.png)
Figure 3.67: Zscore of log2(vst) signal in VNN1 module. Rows were gene name is prefixed with "-" display negative Z-score for these genes, meaning their signal is anticorrelated with other genes in the cluster. pdf version with readable genes and findable VNN1.
.](_main_files/figure-html/resultsWgcnaProjectIdTcgaMesoKnitPlotGenesInVNN1ModuleCorPearson-1.png)
Figure 3.68: Genes in VNN1 module plotted by Pearson correlation against it. Details are available in this table.
- Enrichr results for all genes in VNN1 module are available here
- Enrichr results for genes in VNN1 module and positively correlated with it are available here
- Enrichr results for genes in VNN1 module and negatively correlated with it are available here
- g:Profiler results for all genes in VNN1 module are available here
- g:Profiler results for genes in VNN1 module and positively correlated with it are available here
- g:Profiler results for genes in VNN1 module and negatively correlated with it are available here
- g:Profiler results for comparison of the three queries above are available here