3.5 Correlation analyses
In this section, correlation analyses are produced using Pearson coefficient correlation r.
3.5.1 All selected projects

Figure 3.223: Correlogram for VNN1 signal and metadata converted as numeric. Note that some conversions to numeric are actually meaningless here, e.g. samples names... Black cross highlight comparisons not passing a p-value < 0.05 threshold.
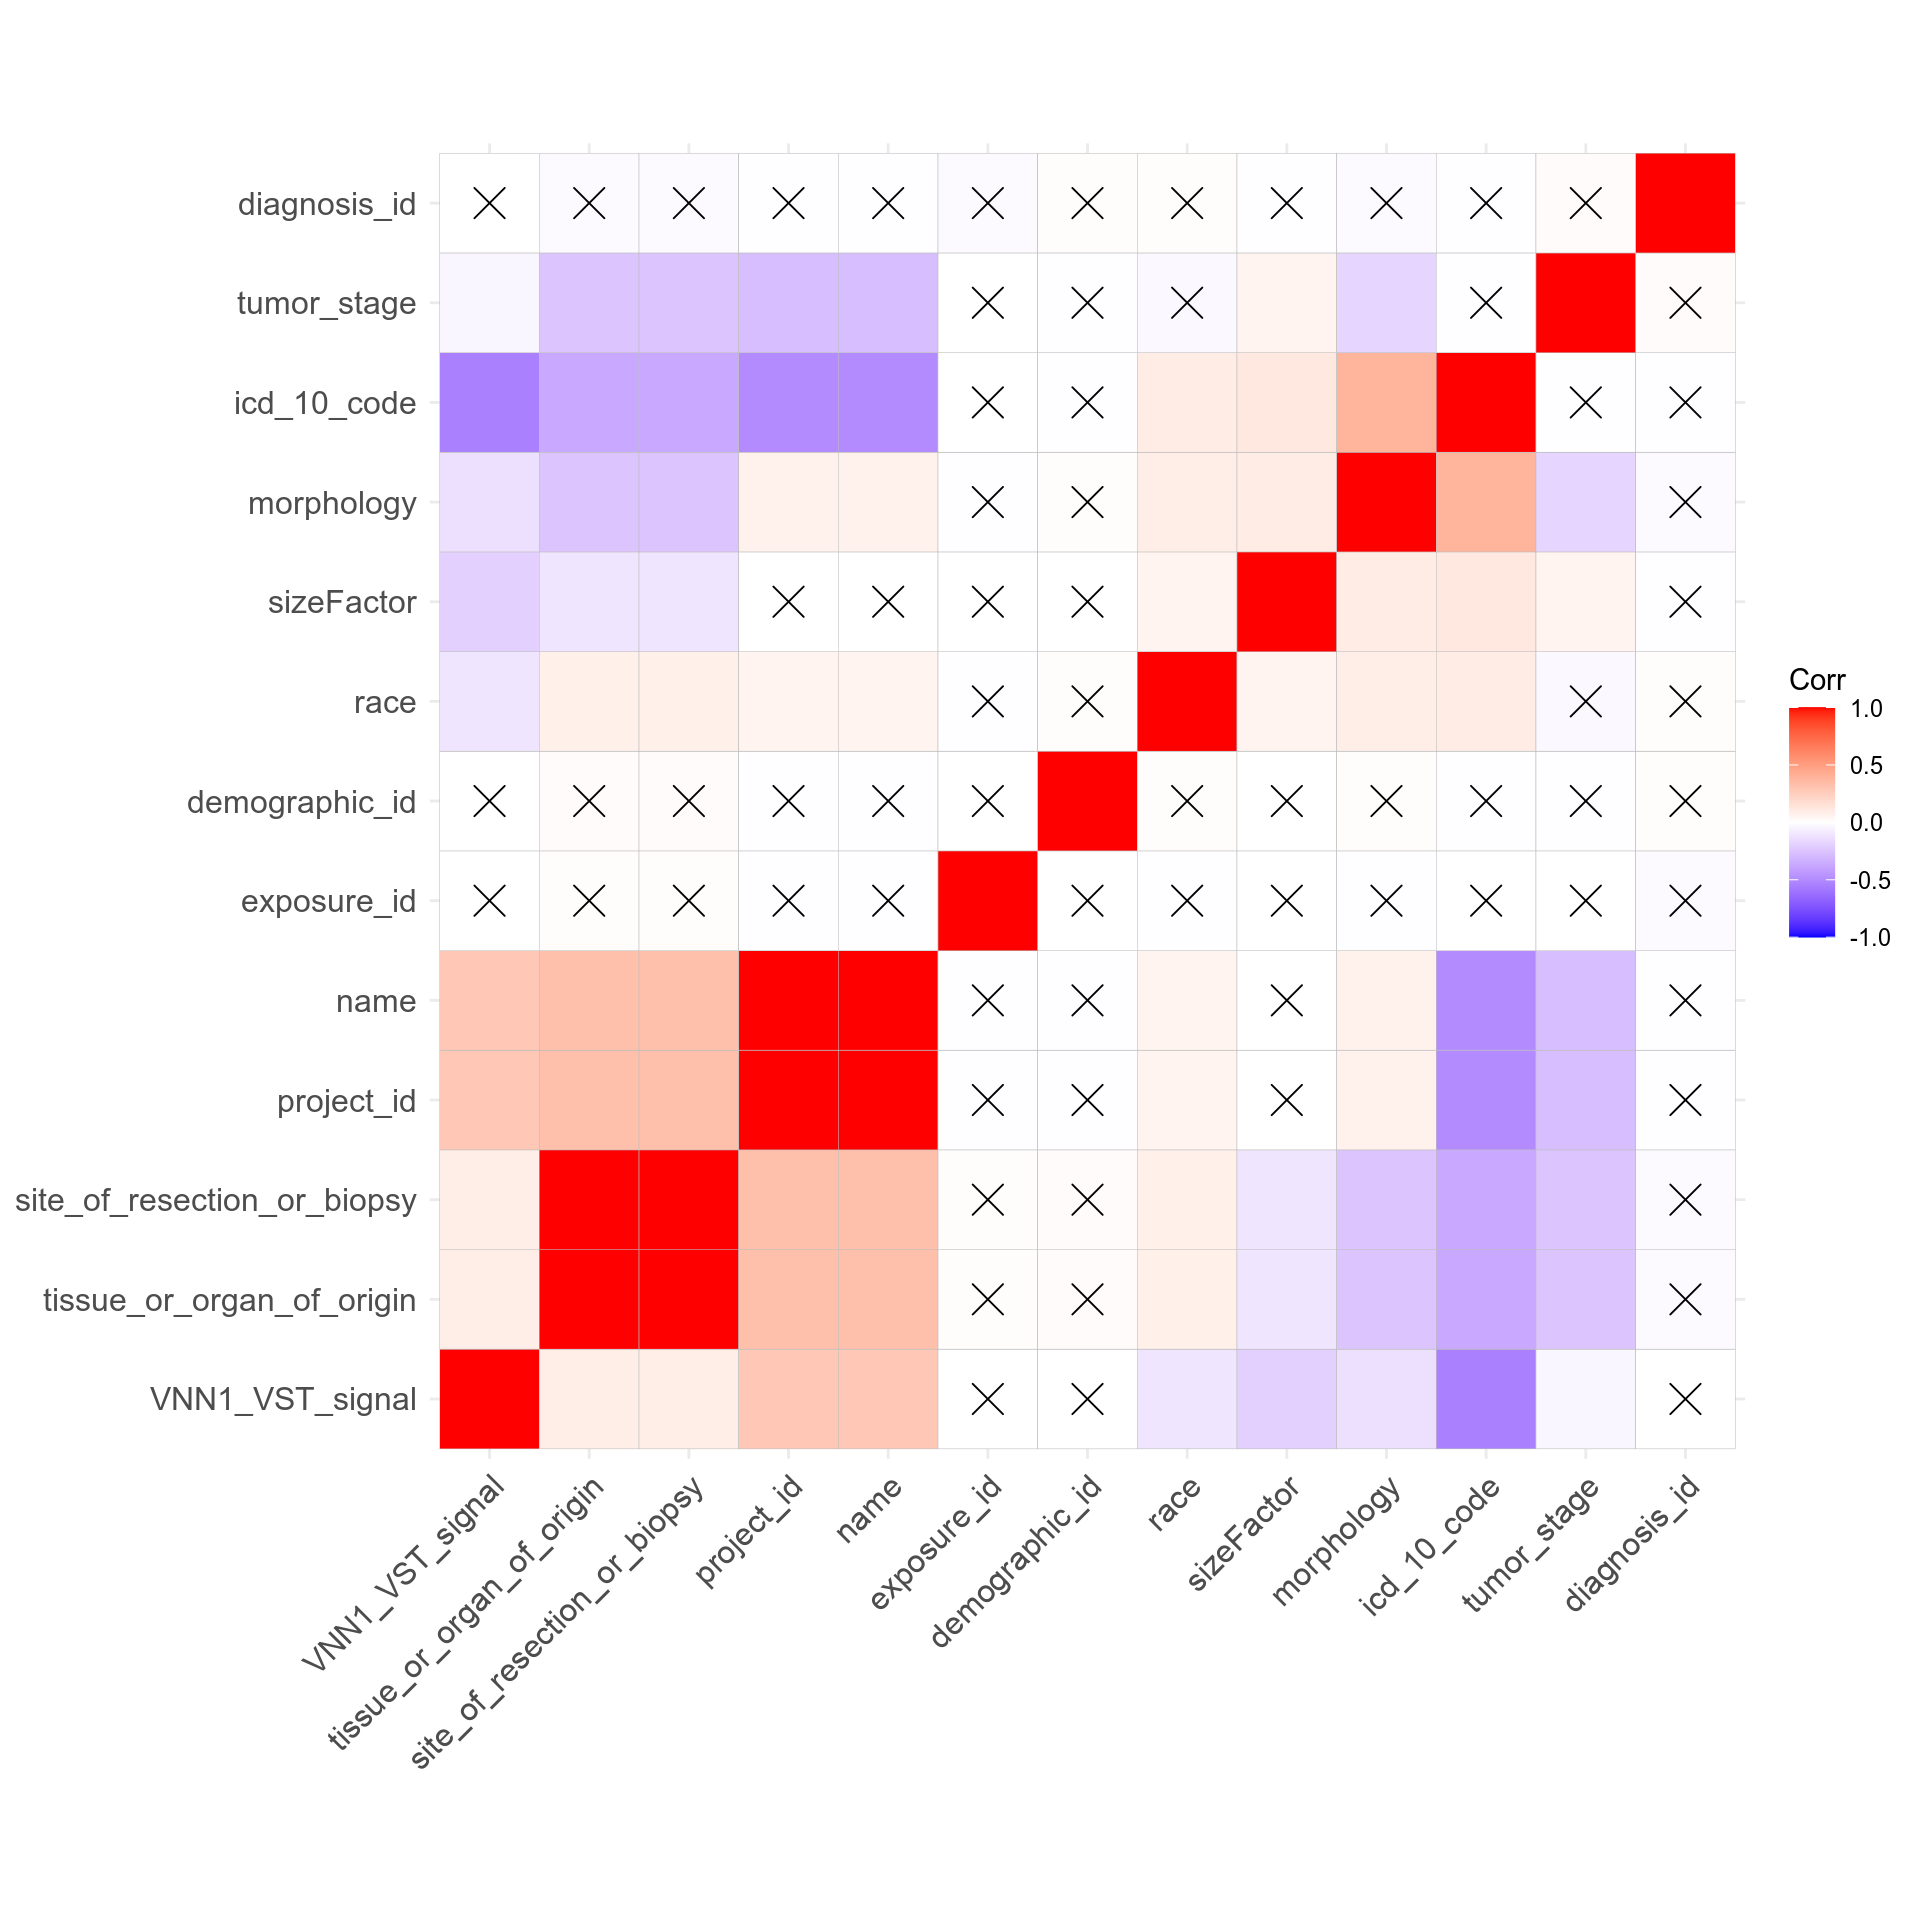
Figure 3.224: Correlogram for VNN1 signal and metadata converted as numeric. Note that some conversions to numeric are actually meaningless here, e.g. samples names... Black cross highlight comparisons not passing a p-value < 0.001 threshold.
3.5.2 TCGA-SARC only with cell deconvolution
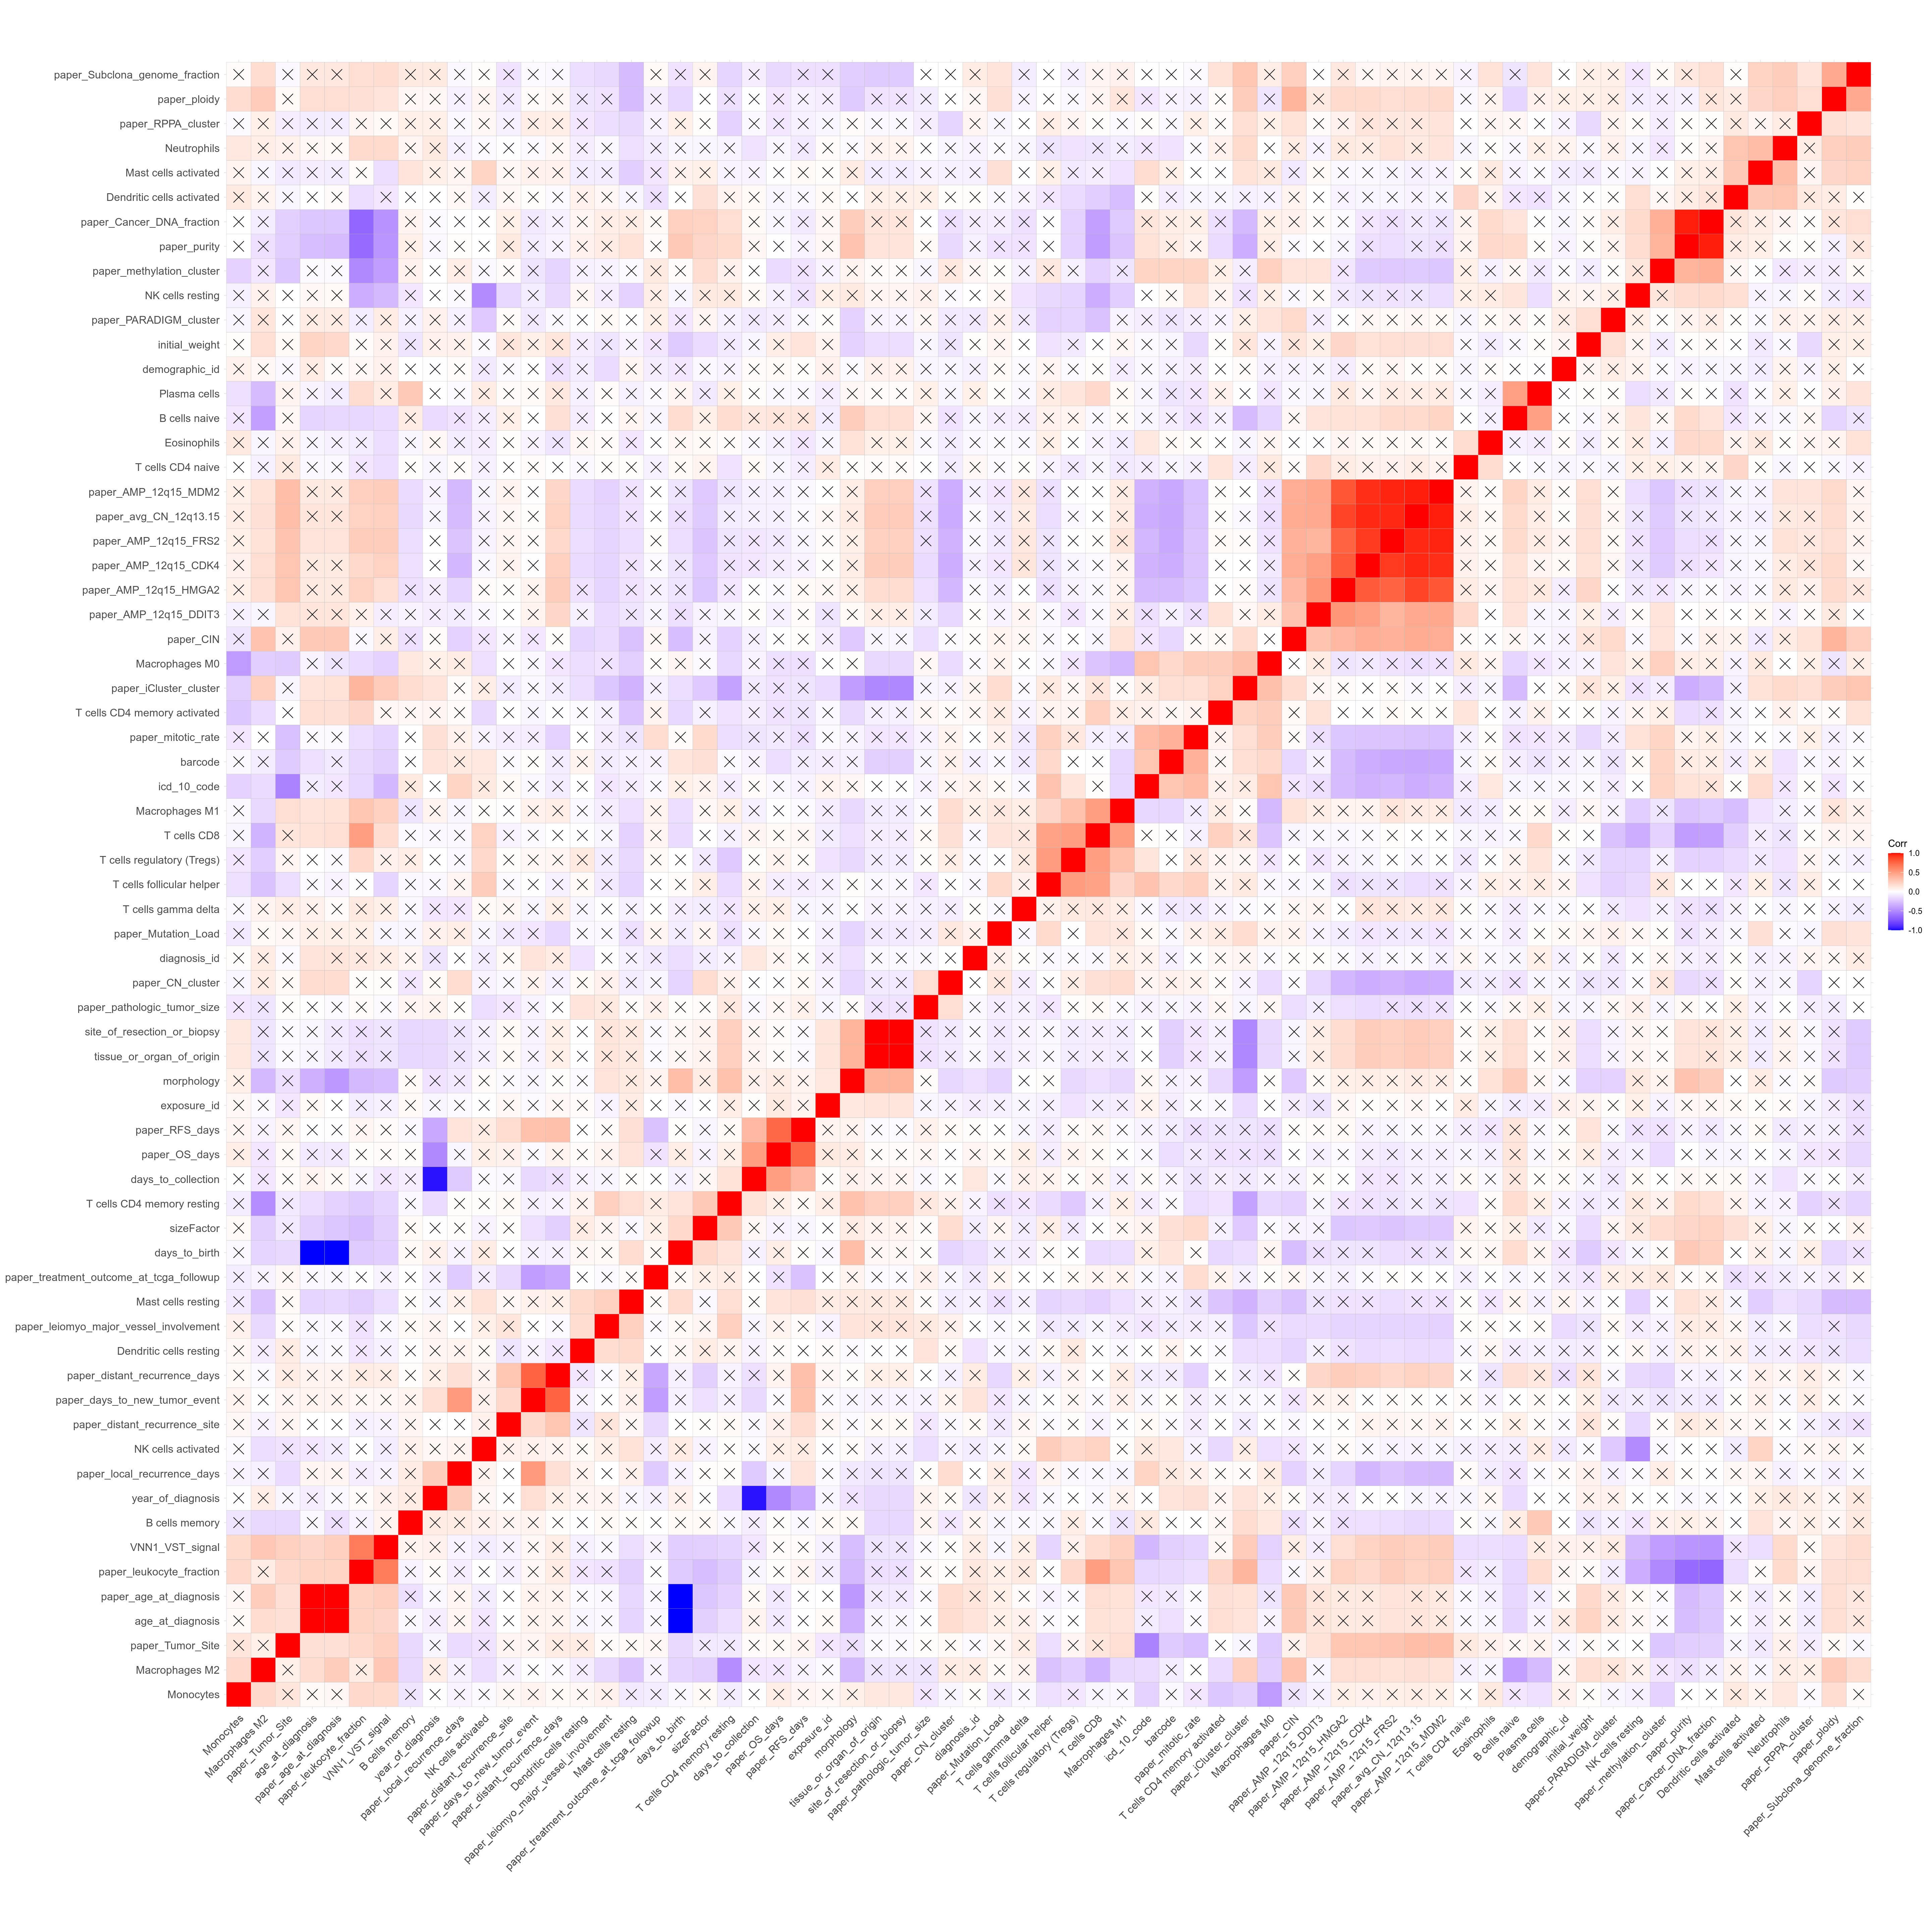
Figure 3.225: Correlogram for VNN1 signal, CIBERSORTx mixture decomposition and metadata converted as numeric. Note that some conversions to numeric are actually meaningless here, e.g. samples names... Black cross highlight comparisons not passing a p-value < 0.05 threshold.
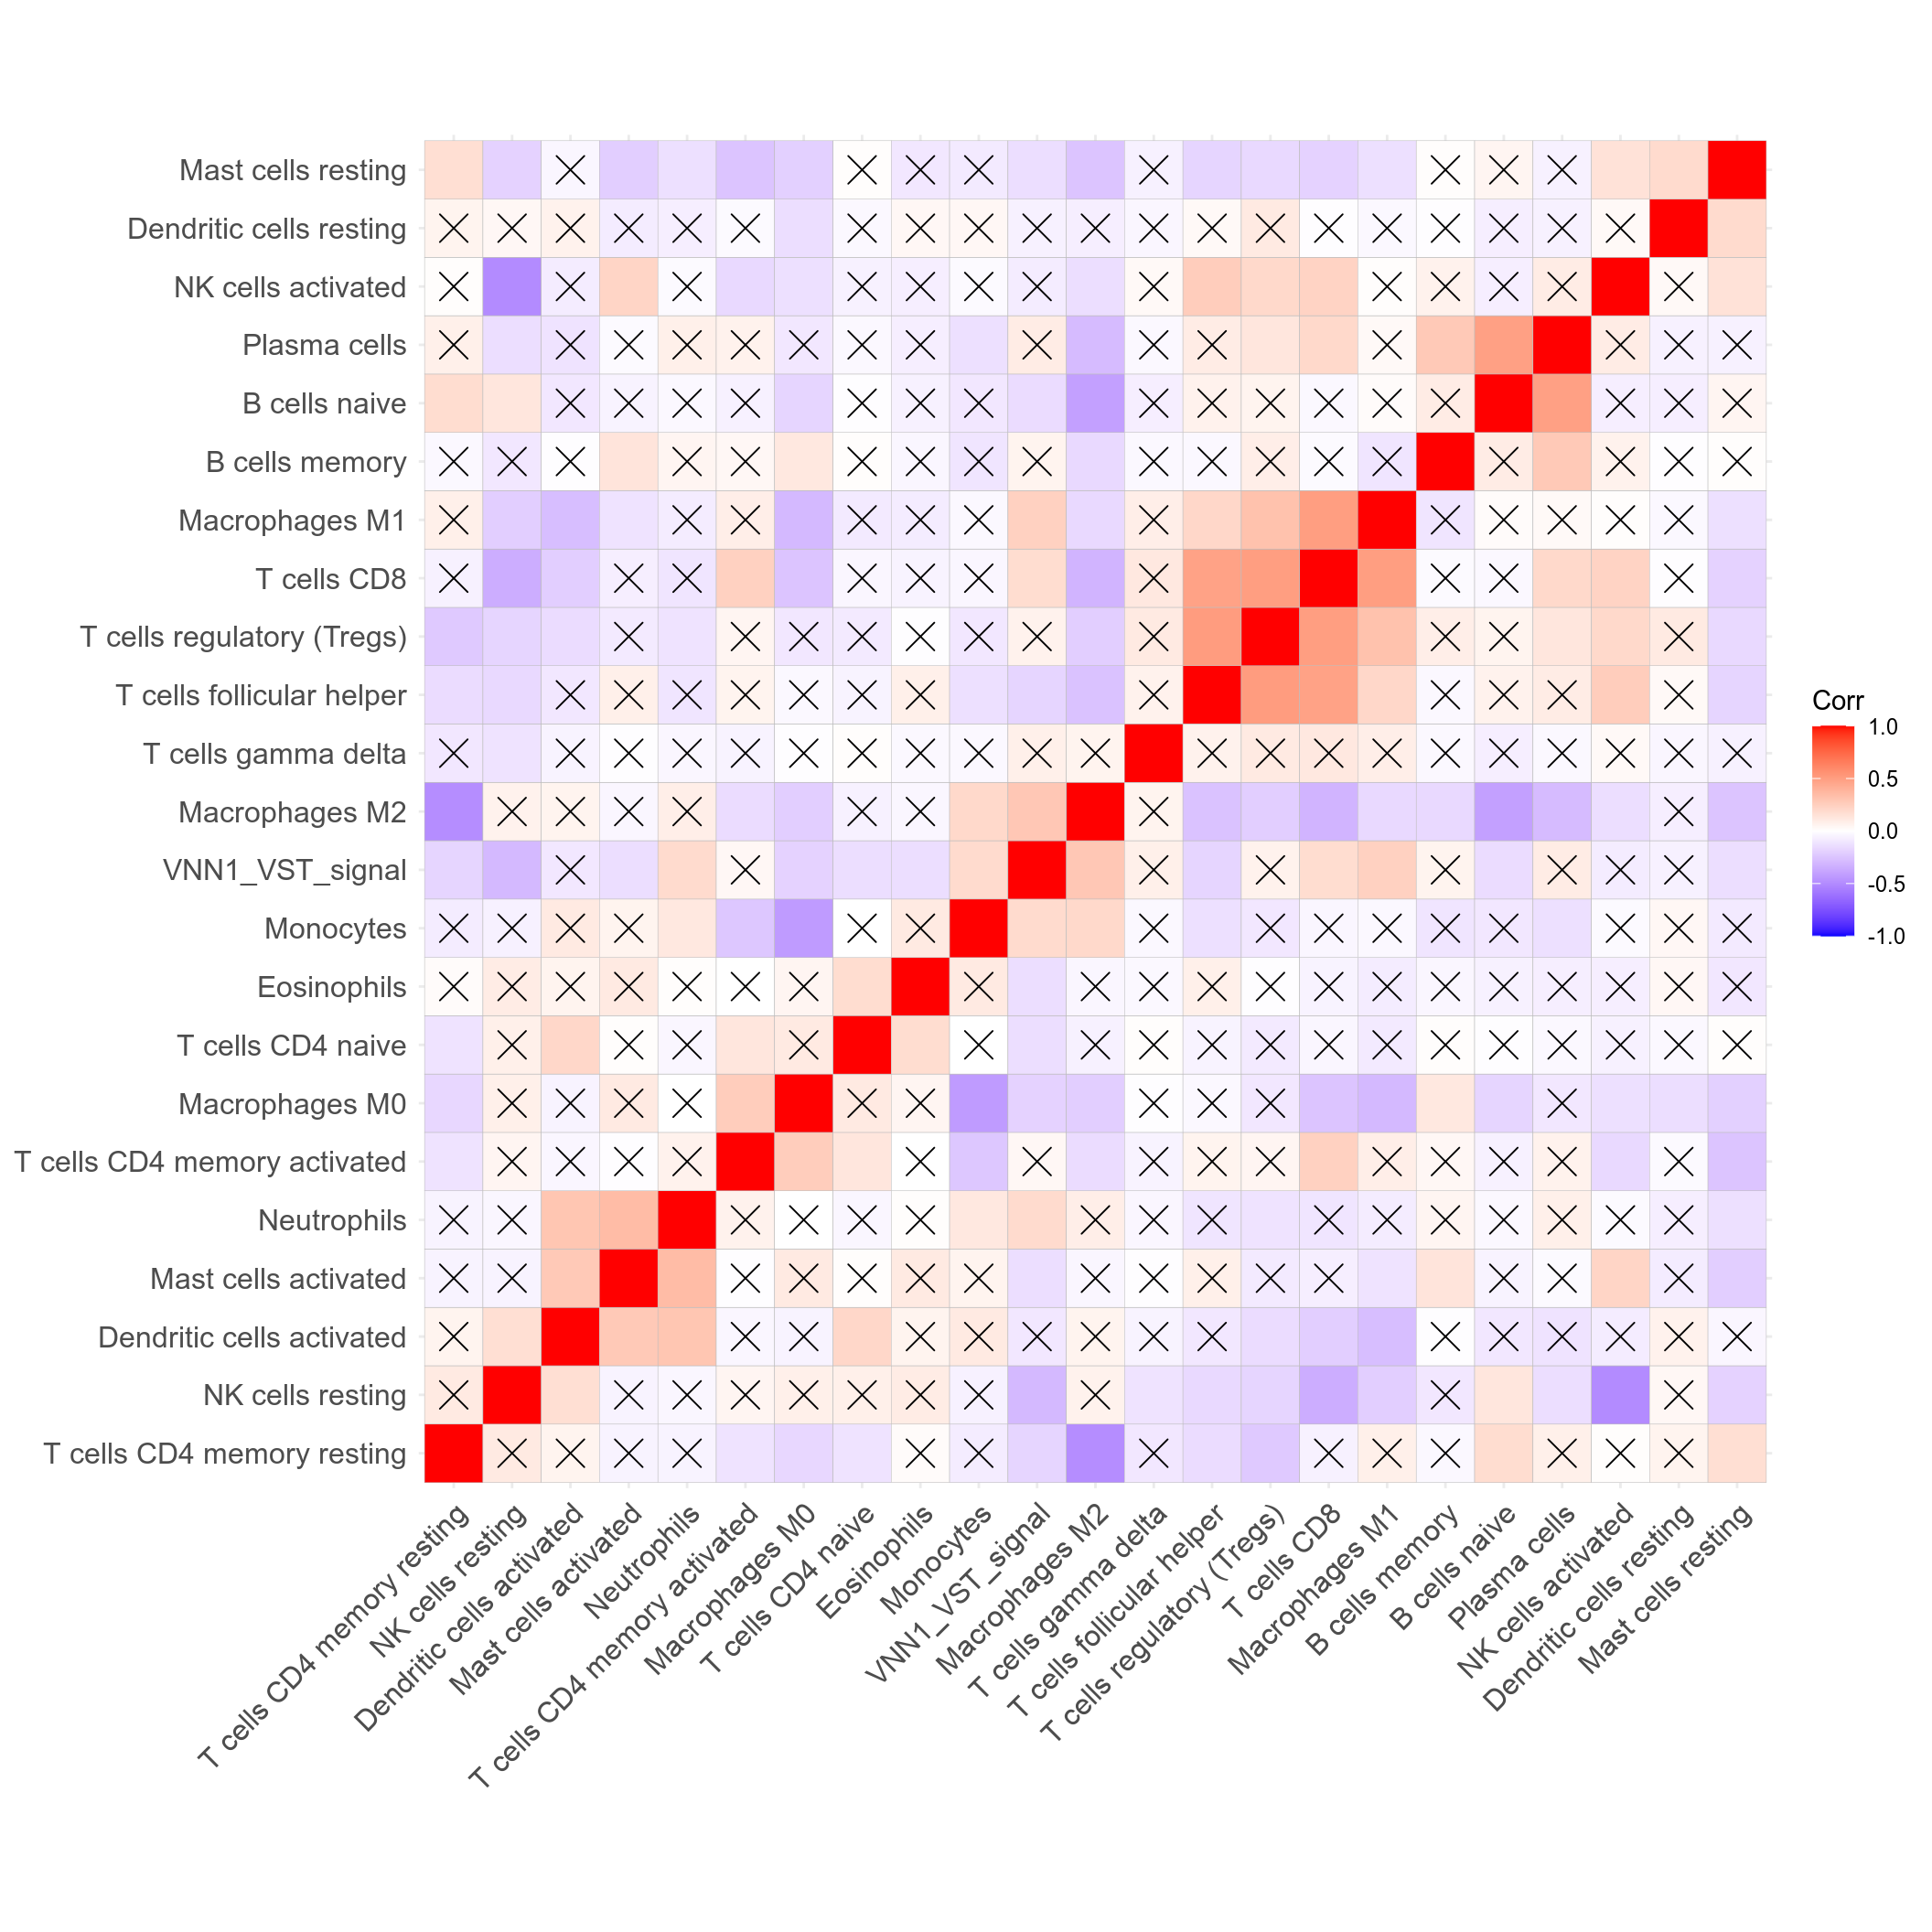
Figure 3.226: Correlogram for VNN1 signal and CIBERSORTx mixture decomposition. Black cross highlight comparisons not passing a p-value < 0.05 threshold.
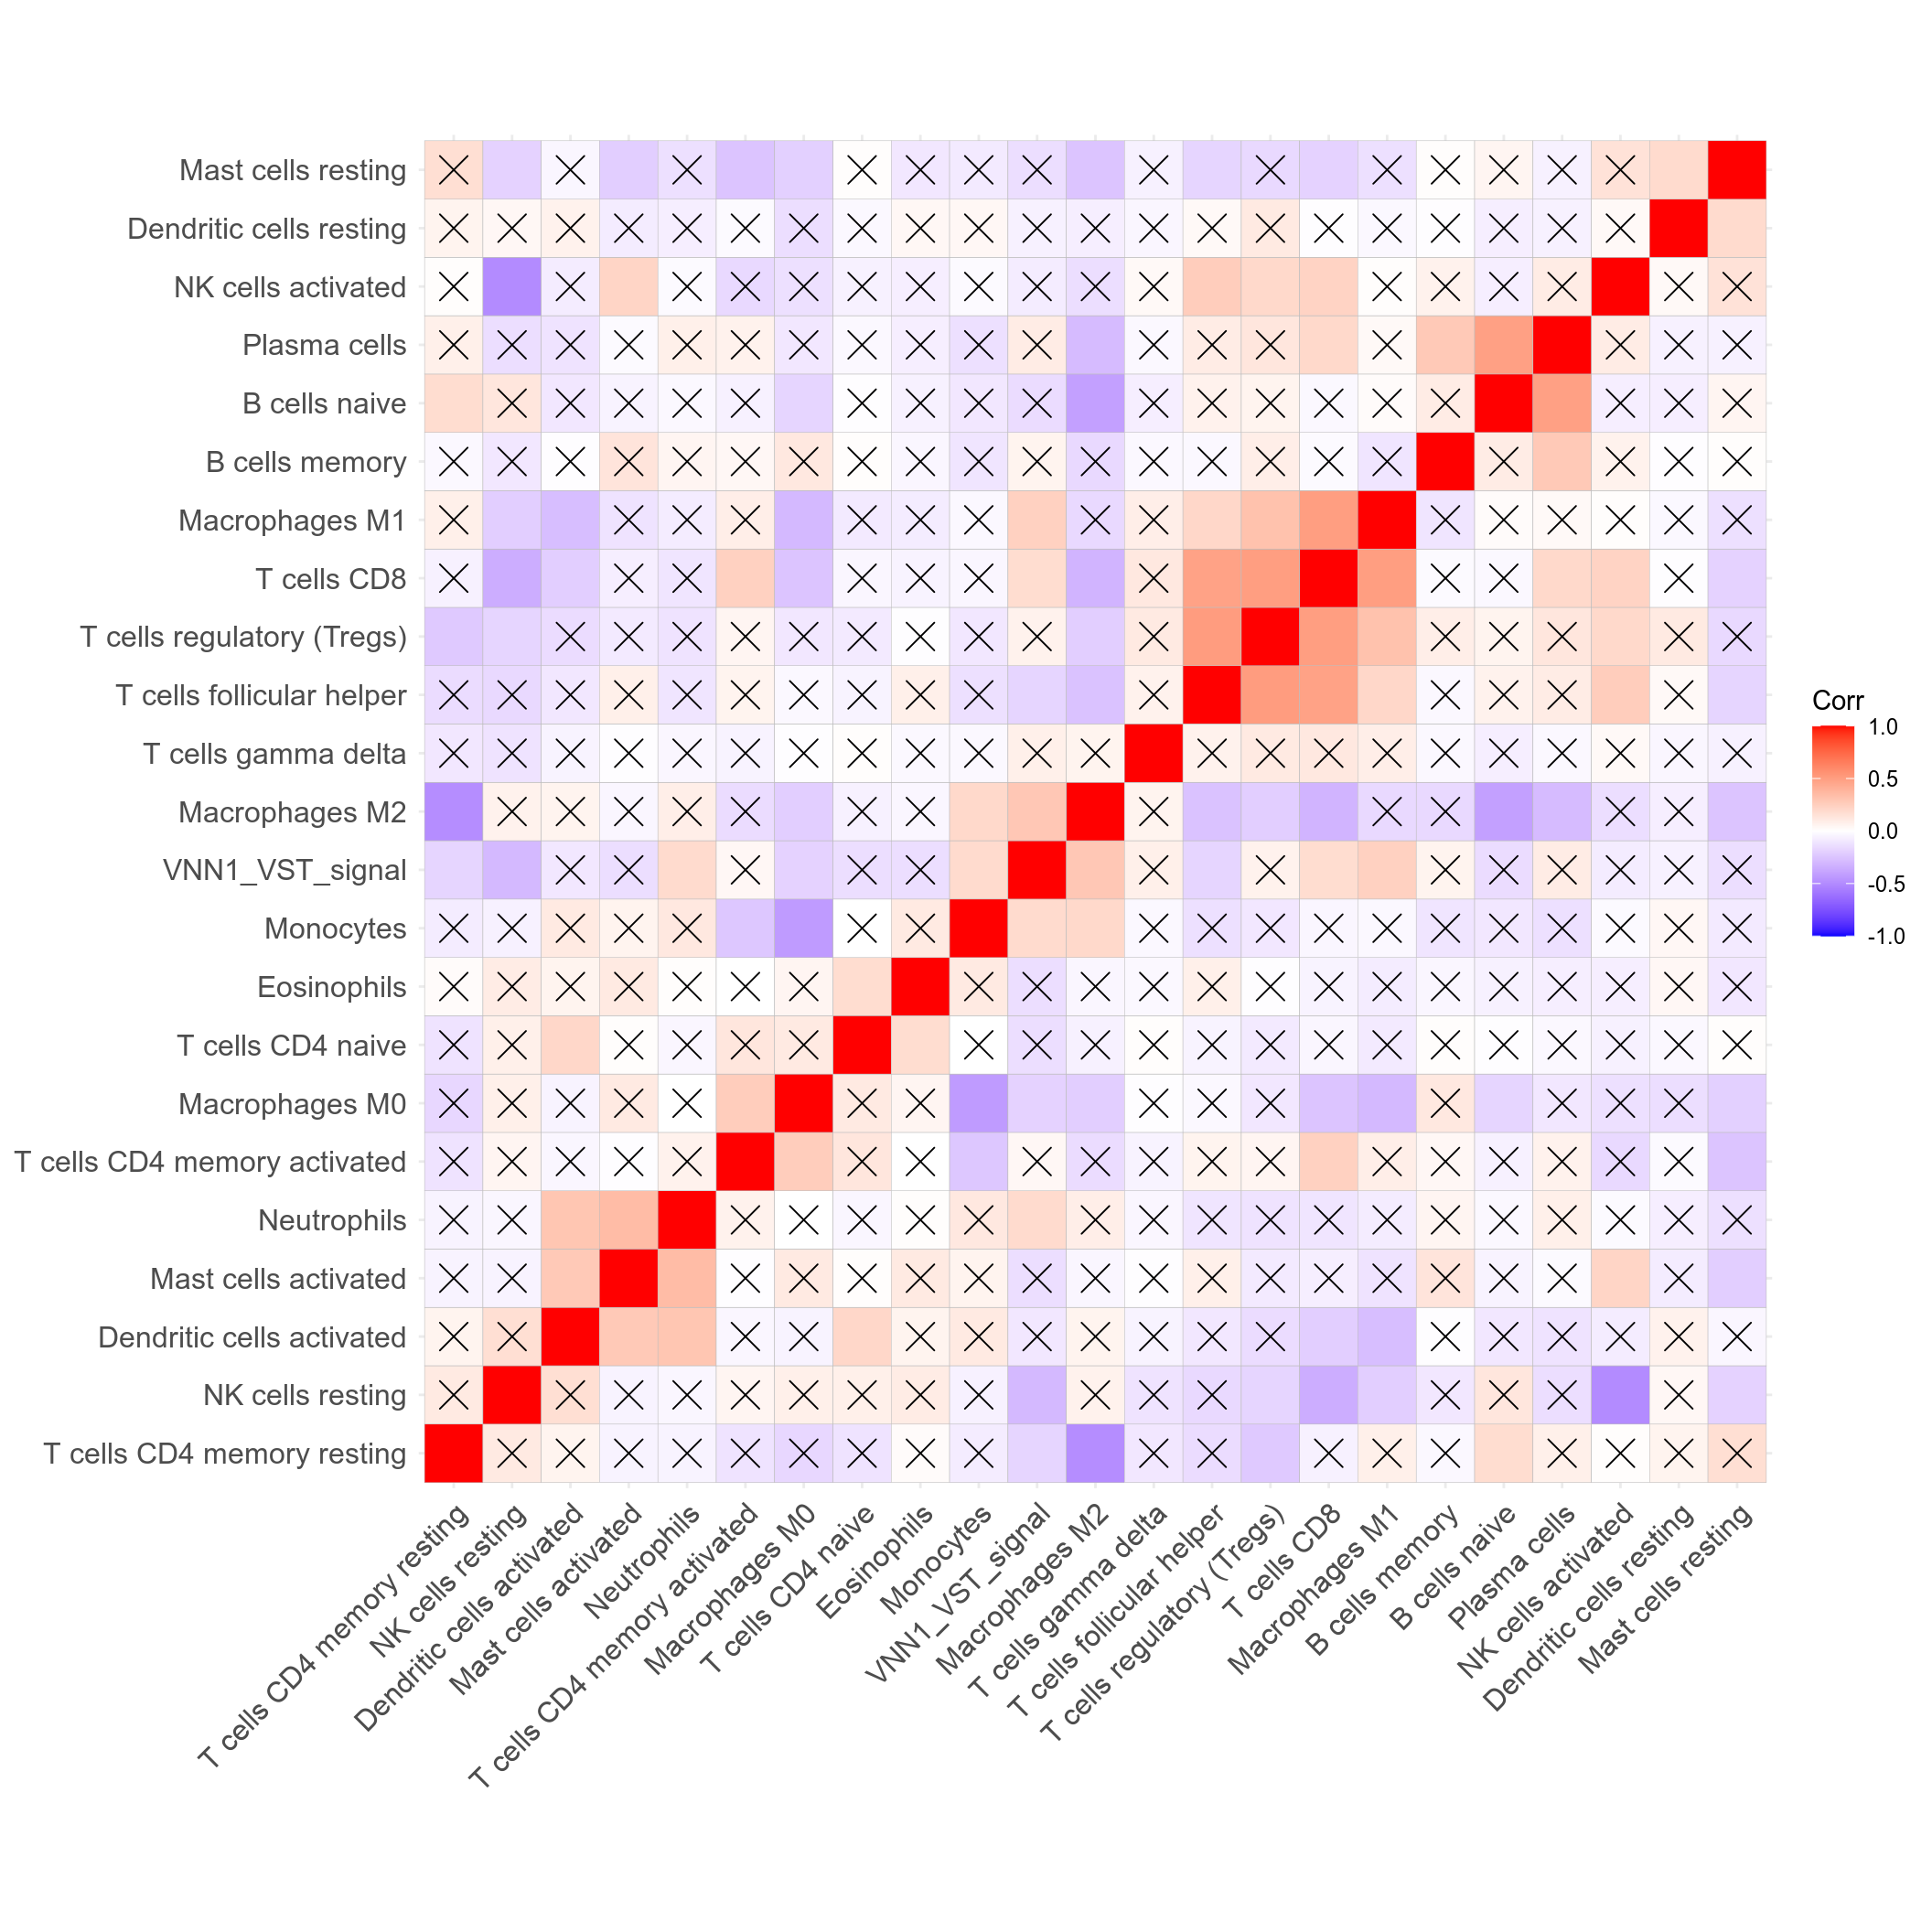
Figure 3.227: Correlogram for VNN1 signal and CIBERSORTx mixture decomposition. Black cross highlight comparisons not passing a p-value < 0.001 threshold.

Figure 3.228: Comparison of VNN1 Signal in LM22 signatures with VNN1 correlation with deconvolve subtypes.
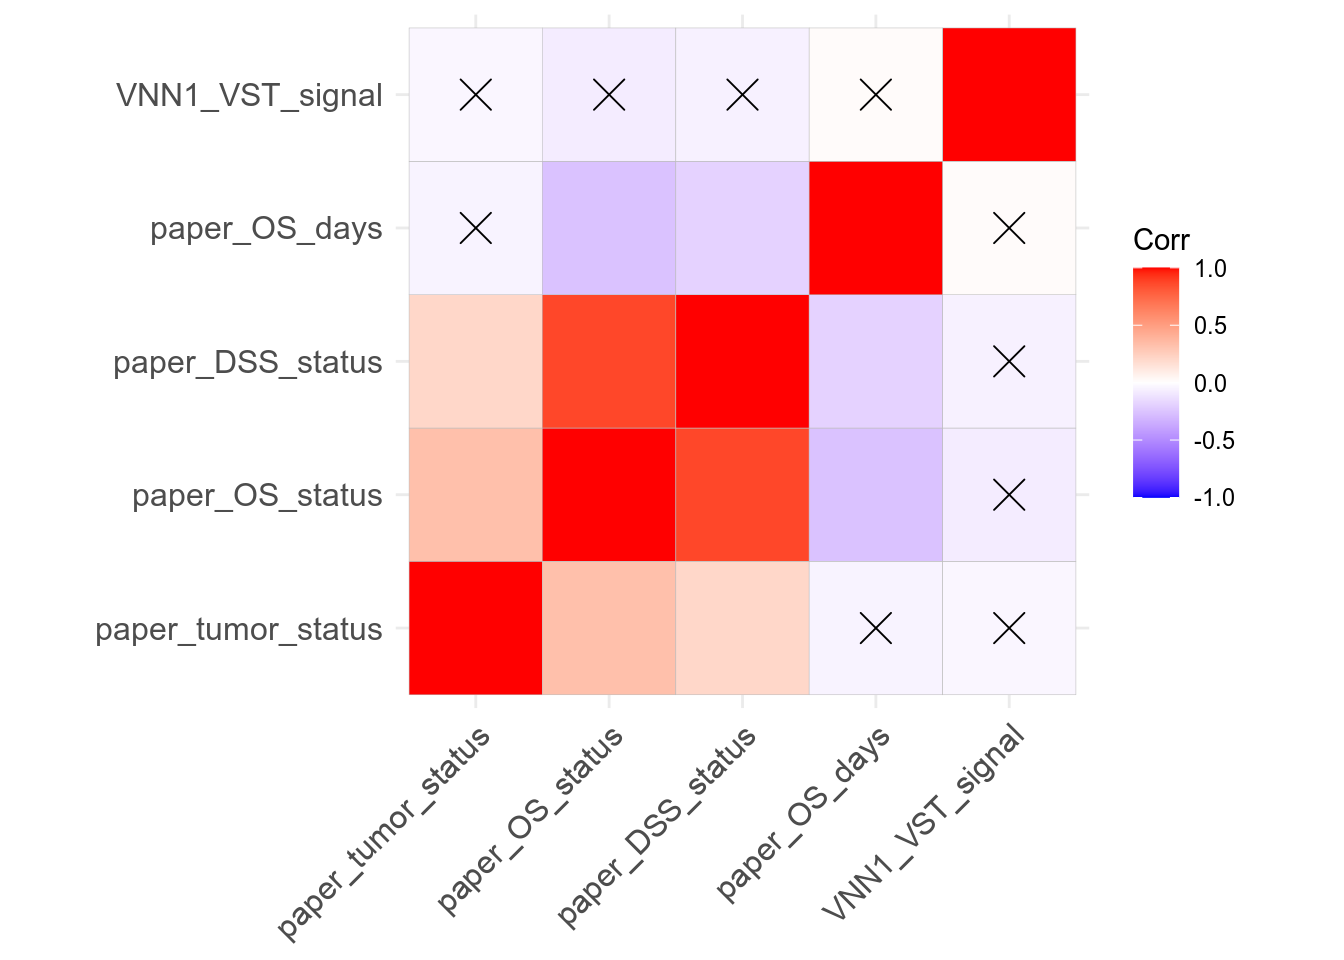
Figure 3.229: Focus on Survival metadata