3.2.2.5 Malignant fibrous histiocytoma
There are 36886 genes and 12 samples in the dataset.
At least some samples or genes look not suitable for the co-expression analysis. After removing them, there remain 35847 genes and 12 samples.
##    Power SFT.R.sq  slope truncated.R.sq mean.k. median.k. max.k.
## 1      1   0.1160  4.250          0.938 9260.00   9170.00  11900
## 2      3   0.0488 -0.982          0.916 1660.00   1590.00   3240
## 3      5   0.3610 -2.040          0.922  507.00    469.00   1350
## 4      7   0.6370 -1.950          0.821  206.00    181.00    697
## 5      9   0.7590 -2.700          0.727  101.00     83.30    508
## 6     11   0.7680 -2.930          0.703   57.50     42.80    435
## 7     13   0.7640 -2.700          0.697   36.50     23.90    393
## 8     15   0.7280 -2.480          0.650   25.40     14.30    367
## 9     17   0.6980 -2.290          0.612   19.10      9.04    348
## 10    19   0.6590 -2.130          0.562   15.30      5.94    334
## 11    21   0.6530 -1.980          0.556   12.90      4.03    324
## 12    23   0.6380 -1.890          0.541   11.20      2.83    316
## 13    25   0.6090 -1.840          0.508   10.10      2.03    309
## 14    27   0.5870 -1.760          0.477    9.29      1.50    304
## 15    29   0.5780 -1.710          0.469    8.71      1.12    300

Network is computed using power=30.

Here are the modules for a few genes of interest:
- VNN1 is in the grey module.
- PPARA is in the grey module.
- PPARD is in the grey module.
- PPARG is in the grey module.
- PPARGC1A is in the grey module.
- PPARGC1B is in the grey module.
g:Profiler results for all modules are available here. Since there are many modules, you should expect at least 1 minute computation on the g:Profiler website for this query. Check below for faster queries focused on VNN1 module.

Figure 3.111: Pathway
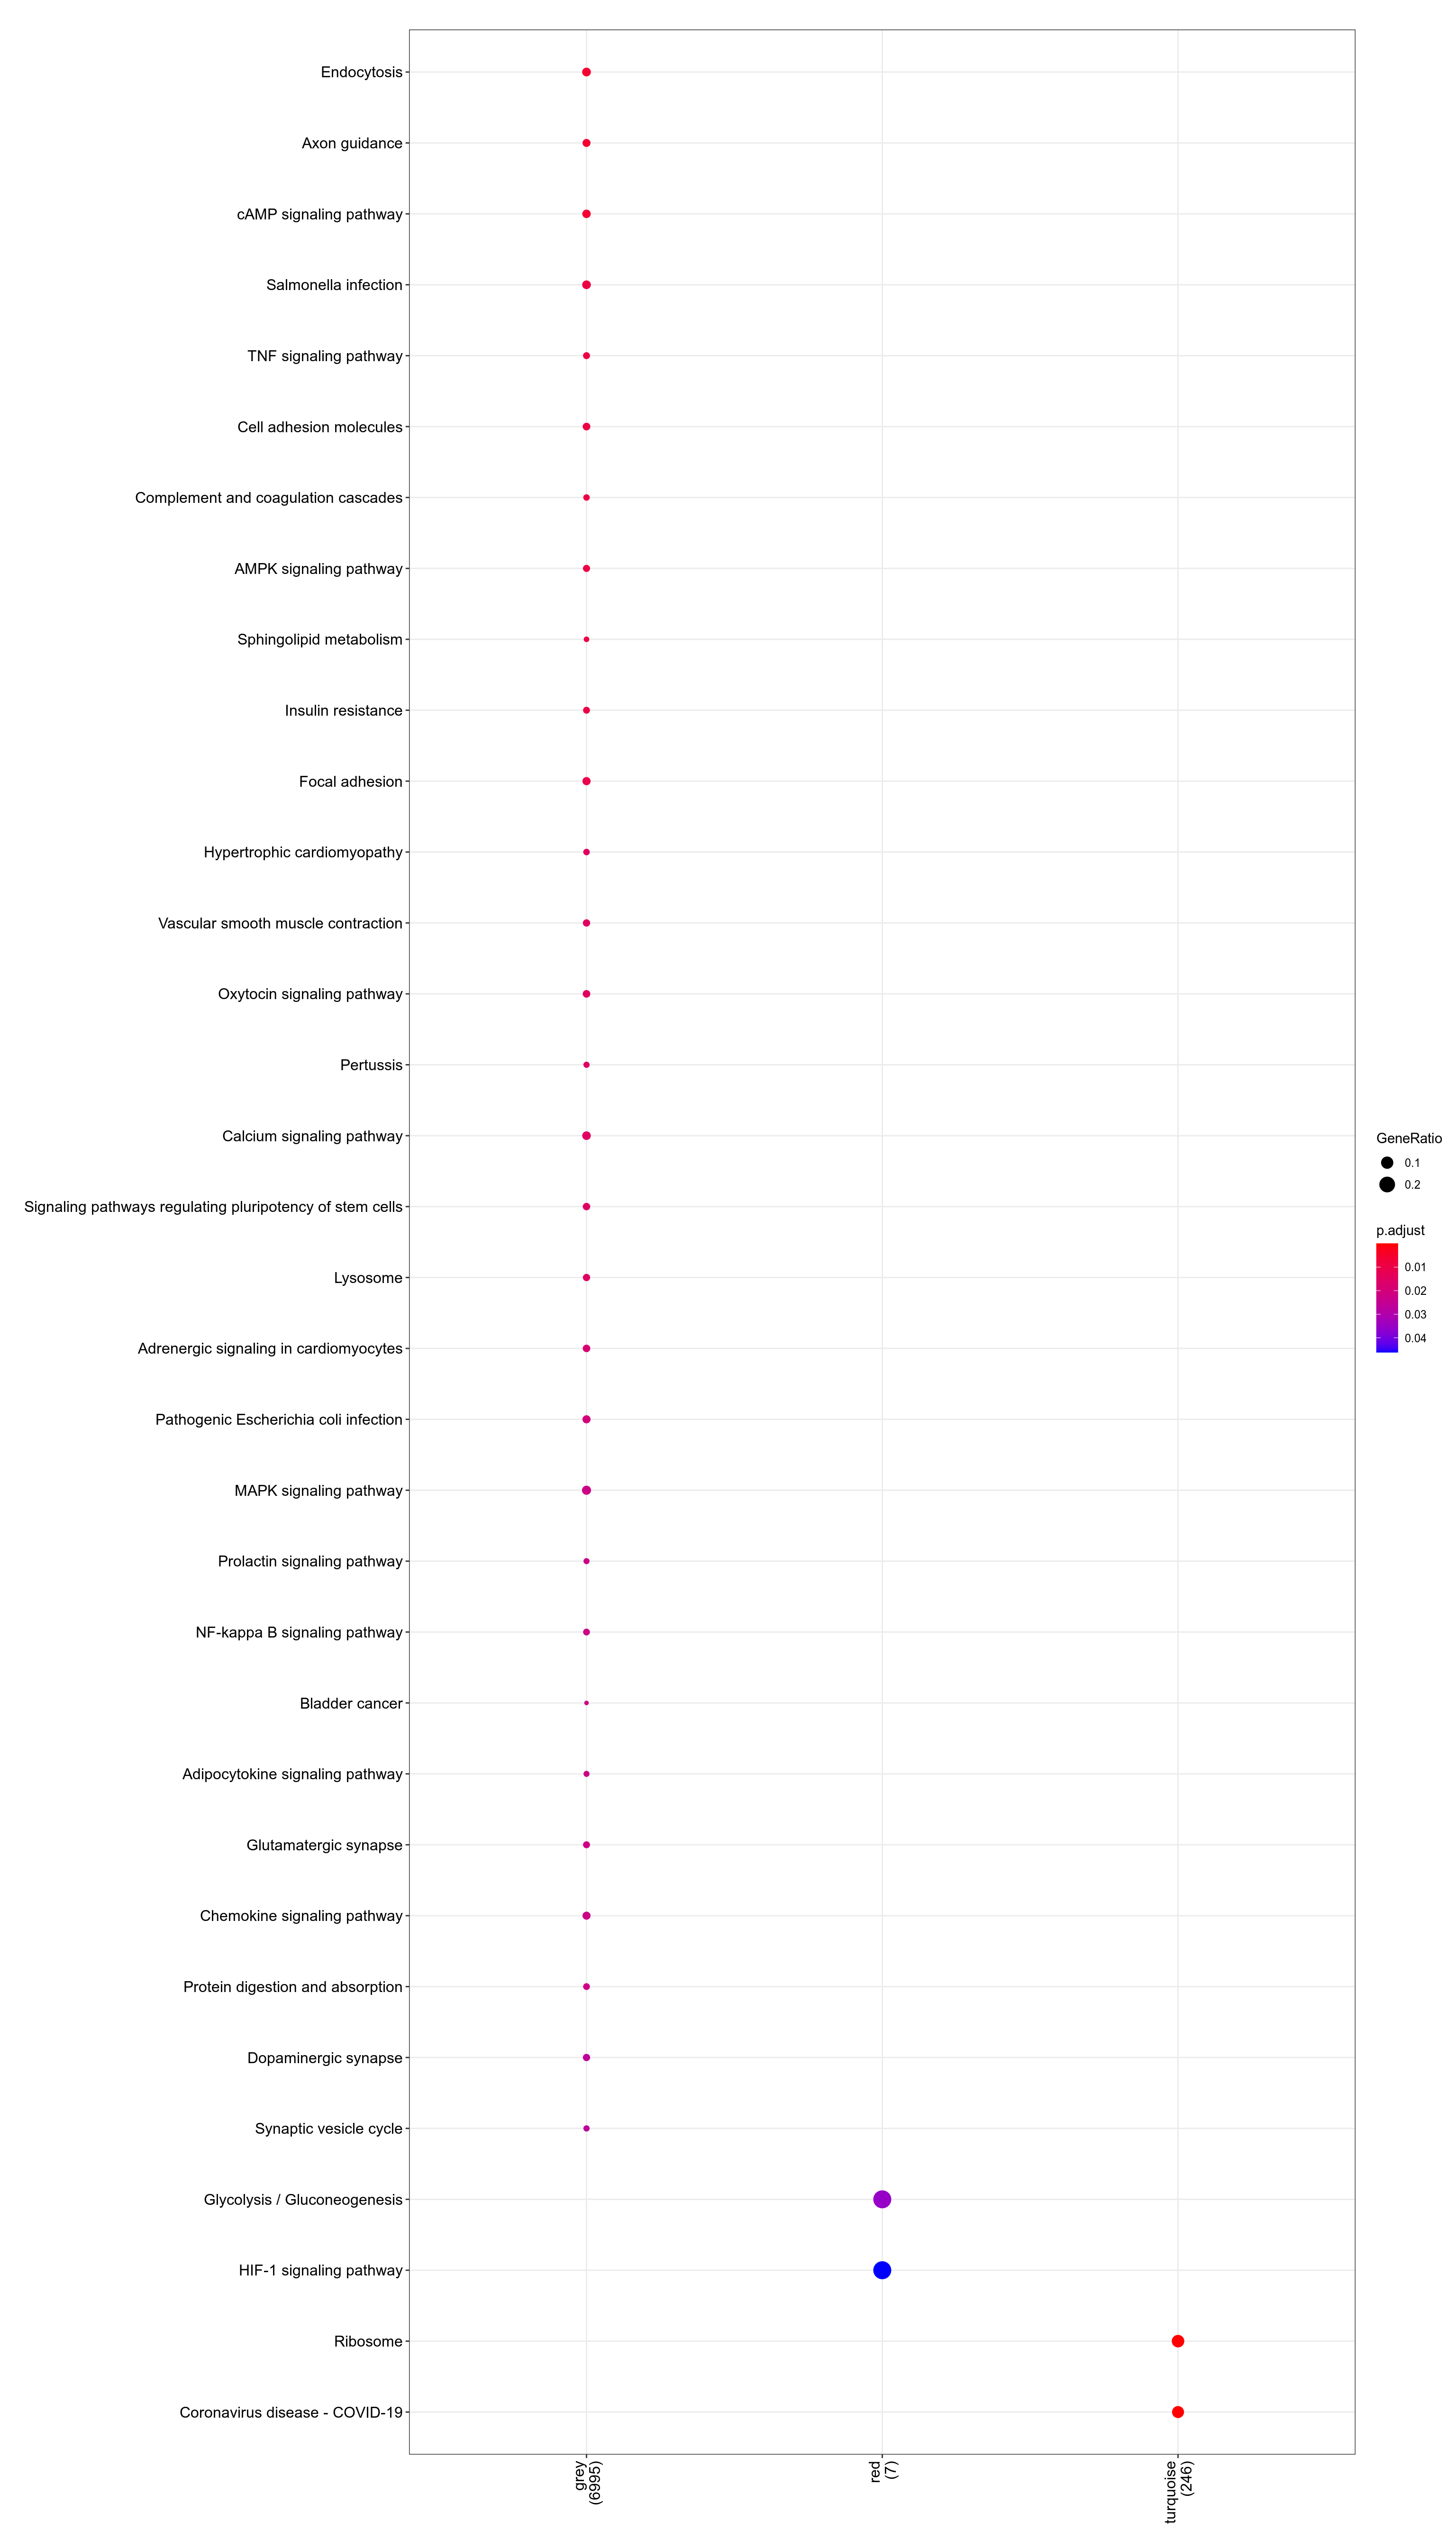
Figure 3.112: Kegg
.](_main_files/figure-html/resultsWgcnaTcgaSarcMalignantFibrousHistiocytomaKnitPlotEnrichHallmarks-1.png)
Figure 3.113: MSigDb Hallmarks. readable pdf version.
## No enriched DO term in these classesTo check that module-to-genes reattribution is working as expected, heatmap of signal for VNN1 module is produced, both as absolute values and as Z-score ones.
## VNN1 module contains more than 2000 genes. Heatmap generation is skippedVNN1 module contains more than 2000 genes. Heatmap generation is skipped
## VNN1 module contains more than 5000 genes. Correlation analysis is skippedMore than 5000 genes in VNN1 module. Analysis skipped. You should try to reduce module size.