3.8 Survival analyses
Aim: Compare with KPM analyses done by Philippe Naquet and Richard Miallot.
Todo: adapt this tutorial
- RFS: In cancer, the length of time after primary treatment for a cancer ends that the patient survives without any signs or symptoms of that cancer. In a clinical trial, measuring the RFS is one way to see how well a new treatment works. Also called DFS, disease-free survival, and relapse-free survival.
- OS: The length of time from either the date of diagnosis or the start of treatment for a disease, such as cancer, that patients diagnosed with the disease are still alive. In a clinical trial, measuring the OS is one way to see how well a new treatment works. Also called overall survival.
3.8.1 VNN1 high VS low

Figure 3.266: Kaplan-Meier plot for all selected TCGA projects
3.8.1.1 By project id

Figure 3.267: Kaplan-Meier plot for TCGA-SARC

Figure 3.268: Kaplan-Meier plot for TCGA-OV

Figure 3.269: Kaplan-Meier plot for TCGA-ESCA

Figure 3.270: Kaplan-Meier plot for TCGA-PAAD

Figure 3.271: Kaplan-Meier plot for TCGA-MESO
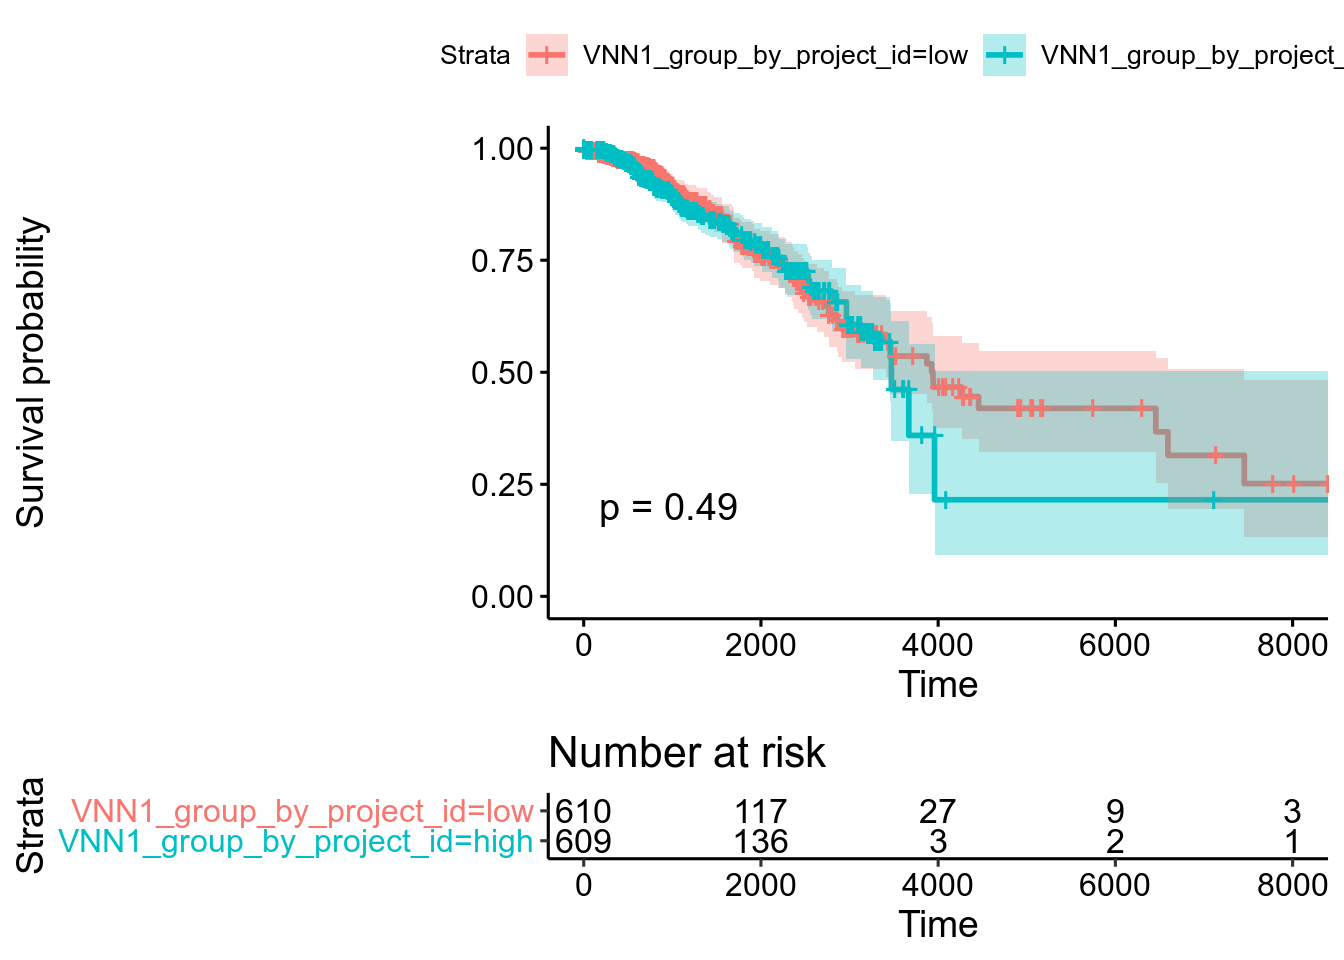
Figure 3.272: Kaplan-Meier plot for TCGA-BRCA

Figure 3.273: Kaplan-Meier plot for TCGA-LIHC

Figure 3.274: Kaplan-Meier plot for TCGA-BLCA
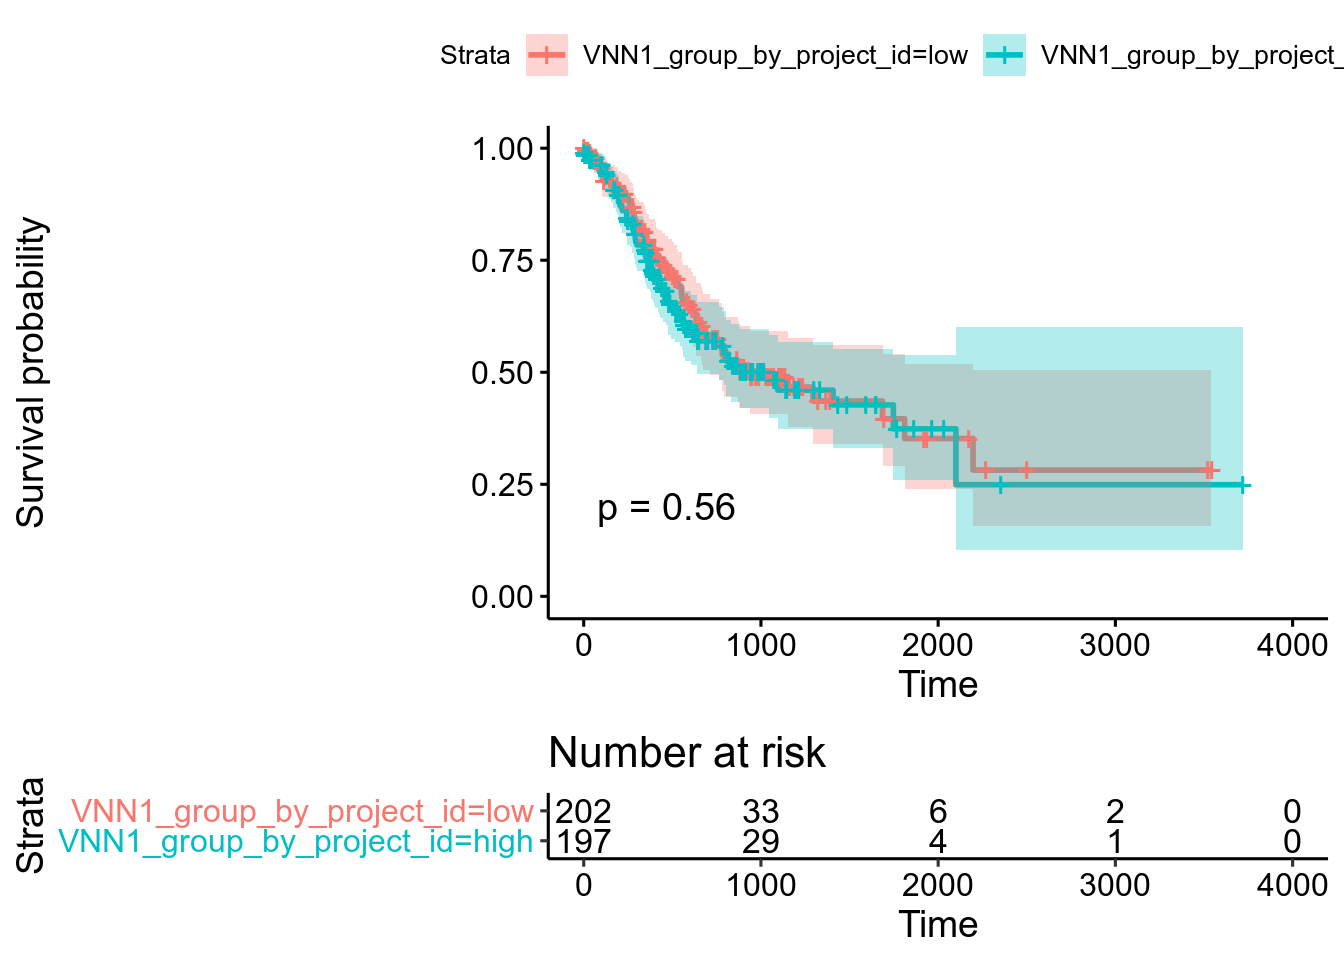
Figure 3.275: Kaplan-Meier plot for TCGA-STAD

Figure 3.276: Kaplan-Meier plot for TCGA-LUSC

Figure 3.277: Kaplan-Meier plot for TCGA-LUAD
3.8.1.2 By primary diagnosis
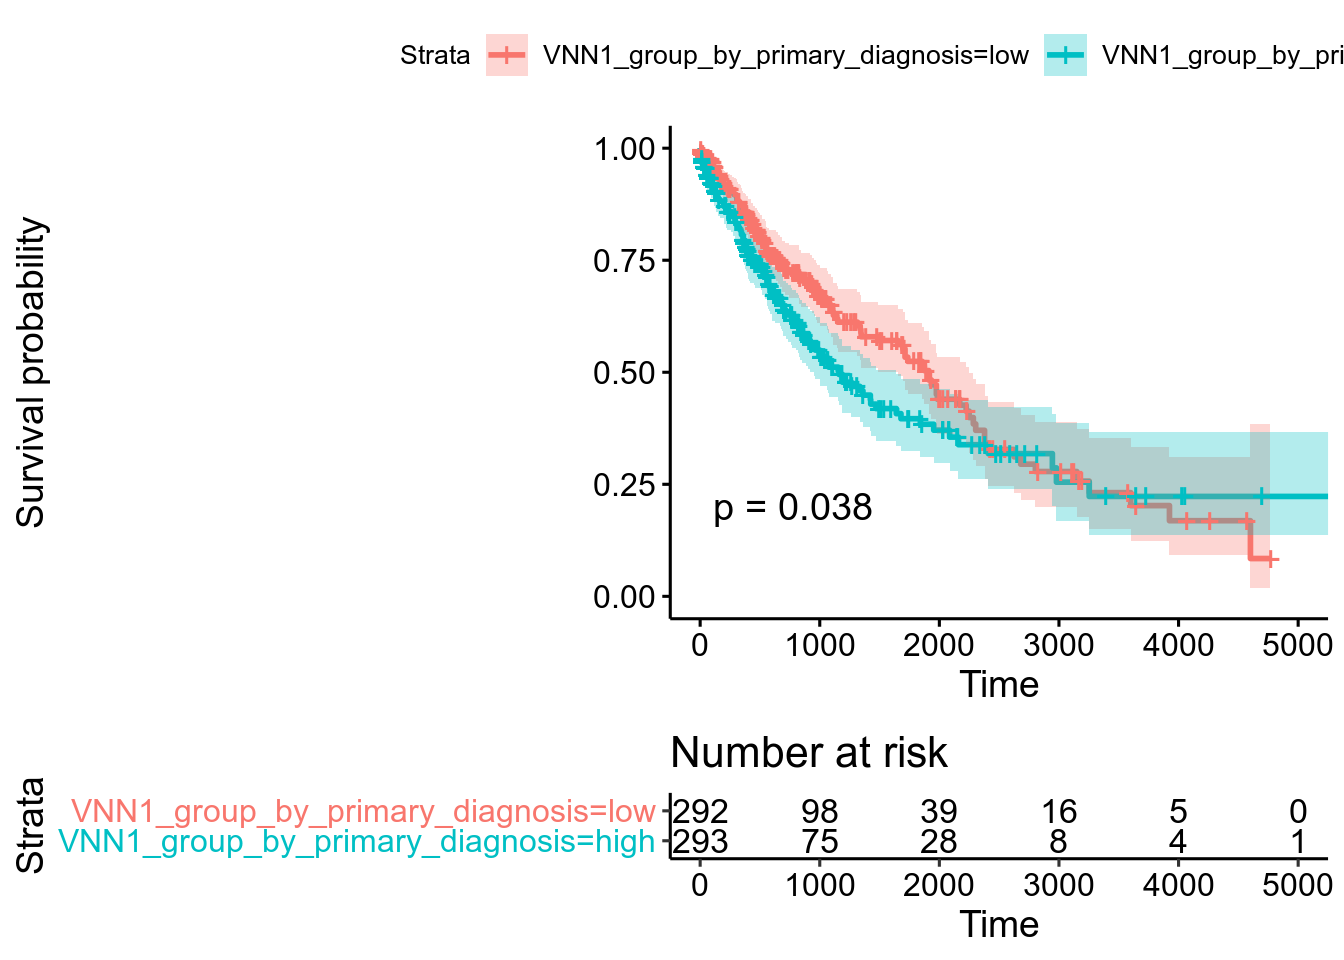
Figure 3.278: Kaplan-Meier plot for Squamous cell carcinoma, NOS