3.4 Cell deconvolution with CIBSERSORTx
The dataset is imported to CIBERSORTx and cell deconvolution is run using these parameters:
- Date: 2021-01-16 07:05:59
- Job type: Impute Cell Fractions
- Signature matrix file: LM22.update-gene-symbols.txt
- Mixture file: TCGA-SARC_data_for_cibersort.tsv
- Batch correction: enabled
- Batch correction mode: B-mode
- Source GEP file used for batch correction: LM22.update-gene-symbols.txt
- Disable quantile normalization: true
- Run mode (relative or absolute): relative
- Permutations: 100
Results correspond to Job3 from Philippe Naquet account and are retrieved and available in the mw-sarcoma-data repository (Private until publication).

Figure 3.212: This barplot is a visual explanation for the ordering of samples used for other barplots below.

Figure 3.213: Stacked barplots for CIBERSORTx results. Fancy, but not really readable. See barplots below.

Figure 3.214: Same CIBERSORTx results but splitted by cell types on facets.

Figure 3.215: Focus on cell types that should express VNN1, or correlate with it.

Figure 3.216: Focus on cell types that should express VNN1. Facet by primary diagnosis. For each facet, samples are still ordered from high-to-low VNN1 expression from top-to-bottom.

Figure 3.217: Focus on cell types that should express VNN1. Facet by paper short histo.

Figure 3.218: Focus on cell types that should express VNN1. Stacked view allow to see the cell type distribution match VNN1 signal overall, but with a few strong exceptions, eg TCGA-HB-A2OT-01A-11R-A21T-07.

Figure 3.219: Focus on cell types that should express VNN1. Stacked view. Facet by primary diagnosis.

Figure 3.220: Focus on cell types that should express VNN1. Stacked view. Facet by paper short histo.
3.4.1 Highlight Neutrophils

Figure 3.221: Correlation between neutrophil proportion and VNN1 signal.

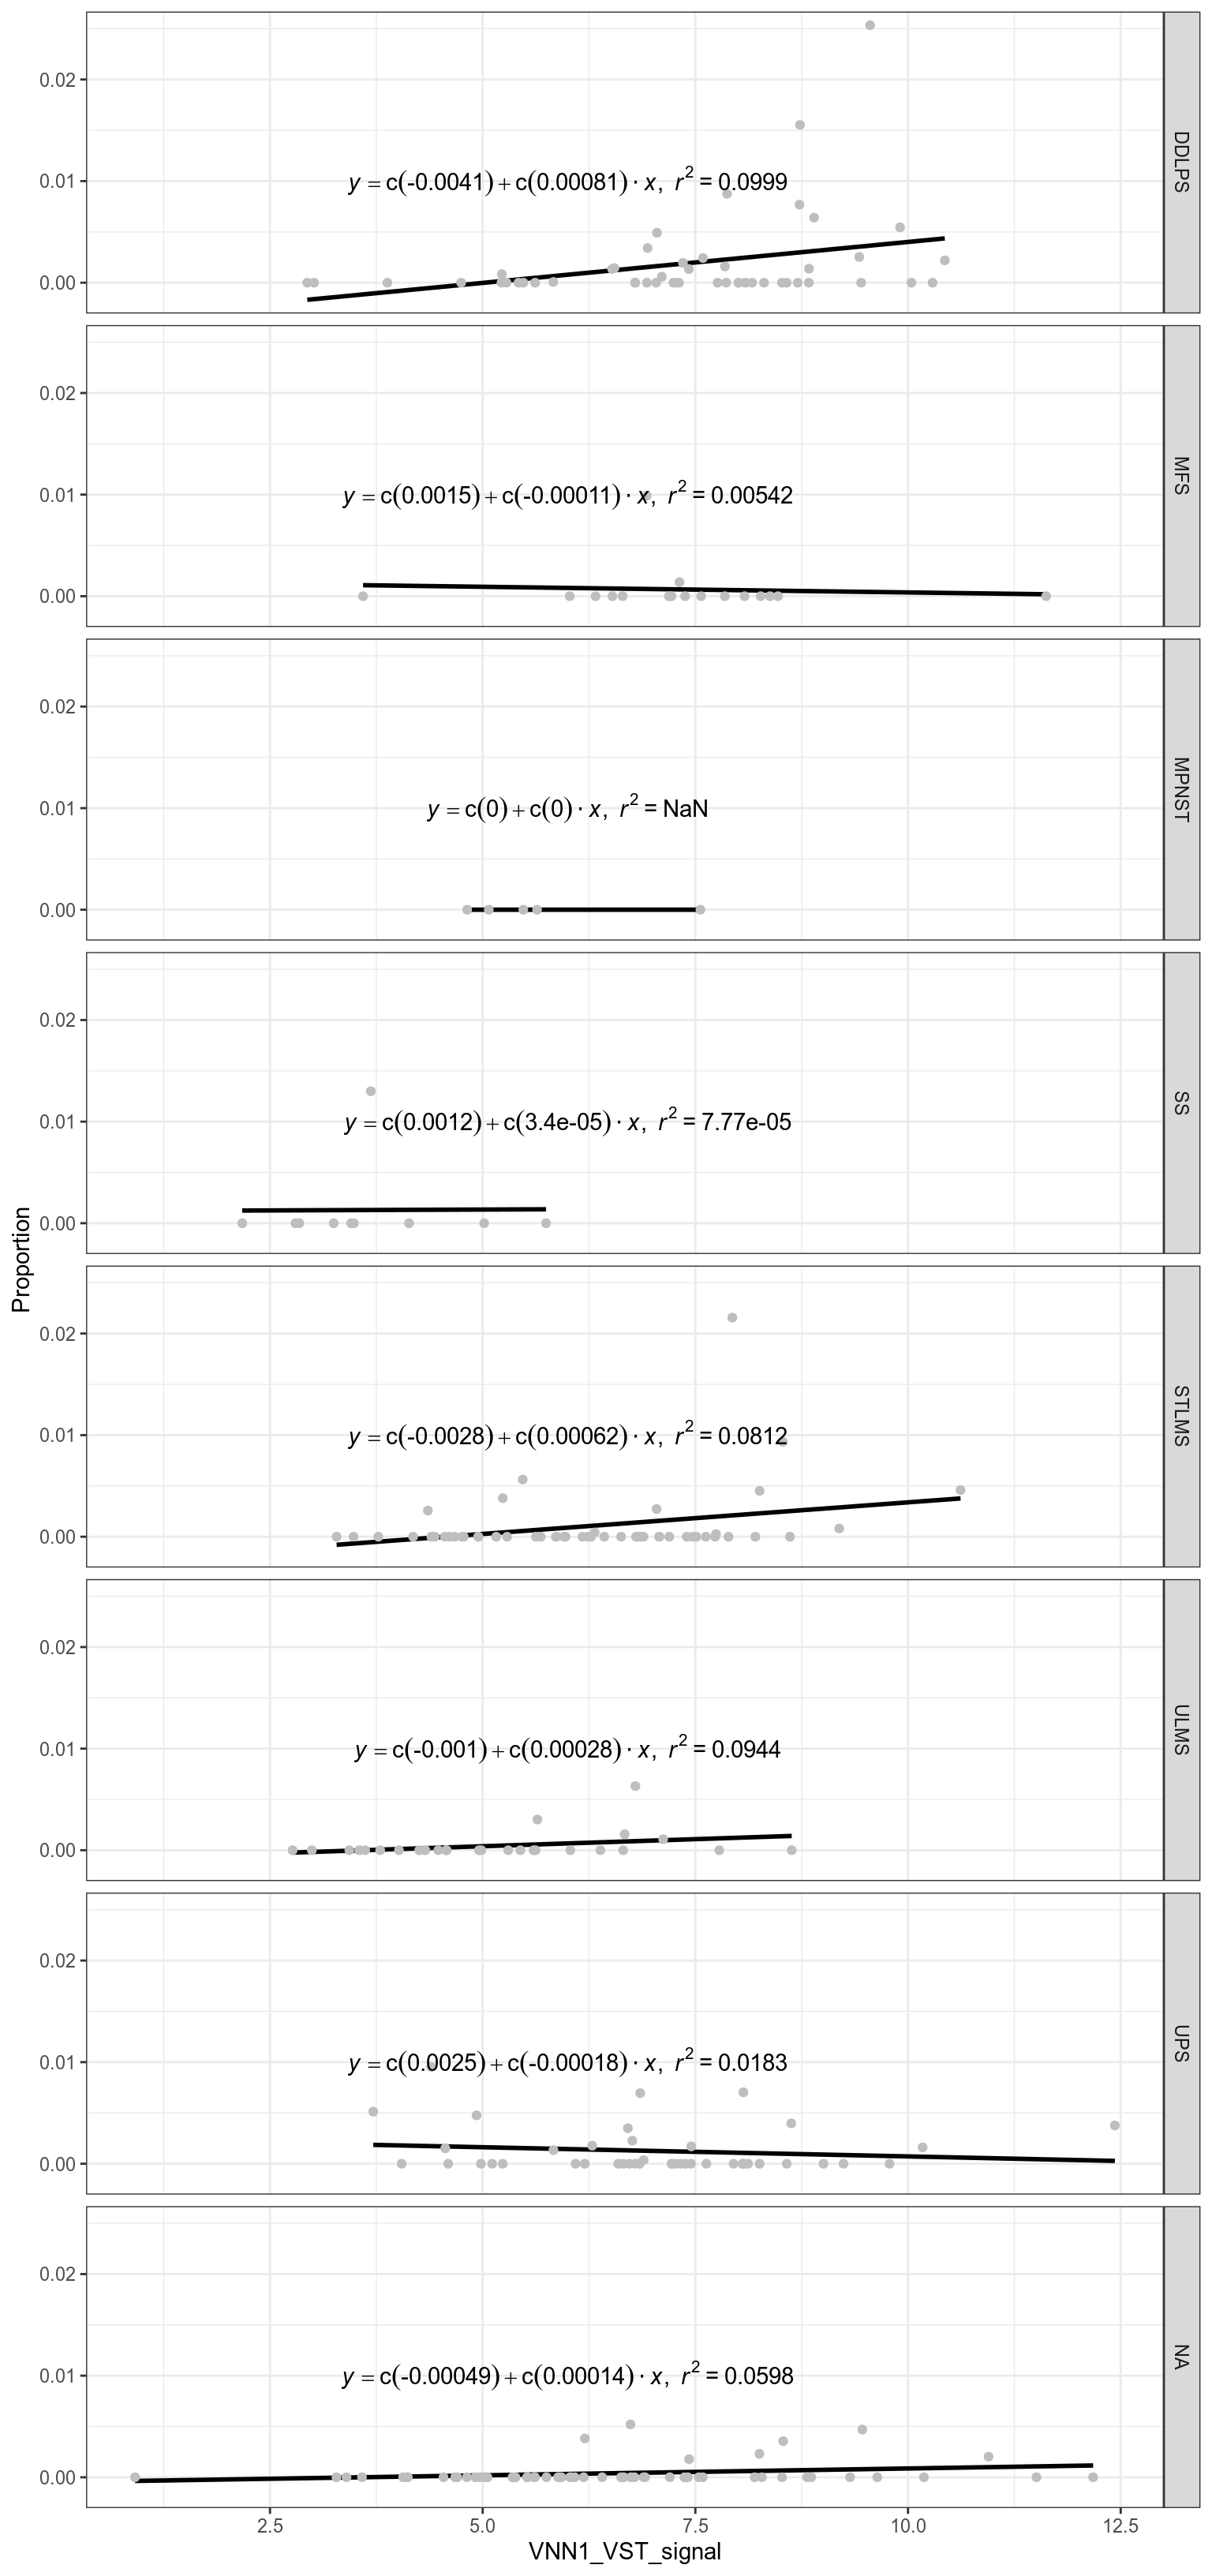
Figure 3.222: Correlation between neutrophil proportion and VNN1 signal, by sarcoma subtypes