3.2.3.4 UPS
There are 36886 genes and 44 samples in the dataset.
At least some samples or genes look not suitable for the co-expression analysis. After removing them, there remain 36769 genes and 44 samples.
##    Power SFT.R.sq slope truncated.R.sq  mean.k. median.k. max.k.
## 1      1    0.266 -2.47          0.782 5620.000  5.33e+03 9600.0
## 2      3    0.857 -2.68          0.967  430.000  3.29e+02 1930.0
## 3      5    0.872 -2.41          0.970   69.400  3.81e+01  659.0
## 4      7    0.876 -2.17          0.979   17.300  6.46e+00  285.0
## 5      9    0.900 -1.94          0.989    5.760  1.41e+00  141.0
## 6     11    0.913 -1.80          0.988    2.380  3.72e-01   84.1
## 7     13    0.914 -1.71          0.968    1.160  1.13e-01   59.2
## 8     15    0.937 -1.56          0.933    0.653  3.82e-02   43.6
## 9     17    0.877 -1.59          0.854    0.410  1.39e-02   40.7
## 10    19    0.389 -2.43          0.340    0.283  5.34e-03   39.9
## 11    21    0.402 -2.65          0.344    0.211  2.16e-03   39.4
## 12    23    0.416 -2.77          0.320    0.168  9.01e-04   39.0
## 13    25    0.424 -2.67          0.327    0.140  3.87e-04   38.8
## 14    27    0.430 -2.58          0.327    0.122  1.70e-04   38.6
## 15    29    0.436 -2.53          0.331    0.109  7.56e-05   38.5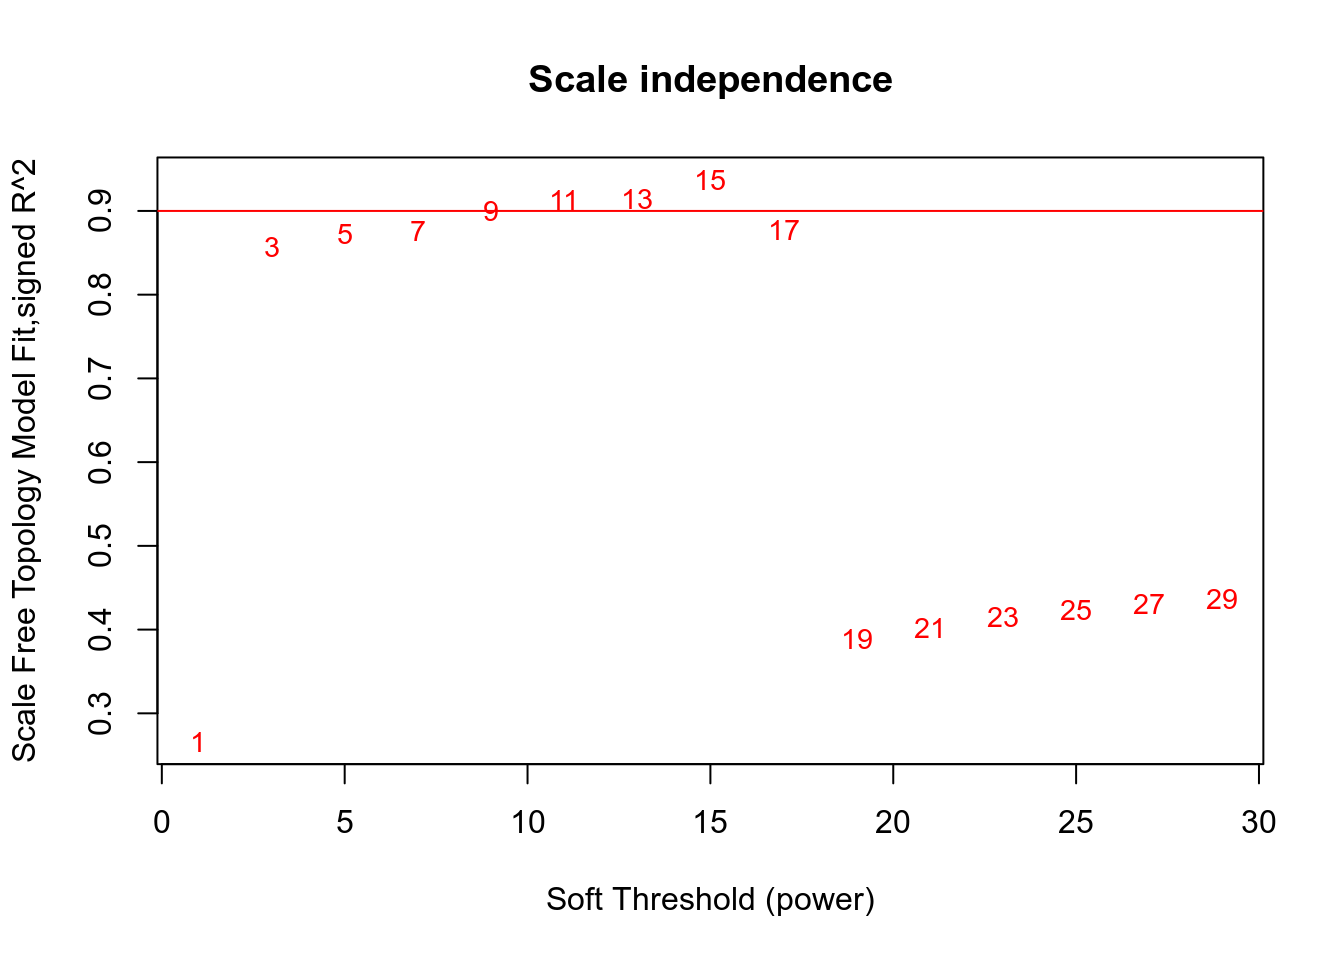
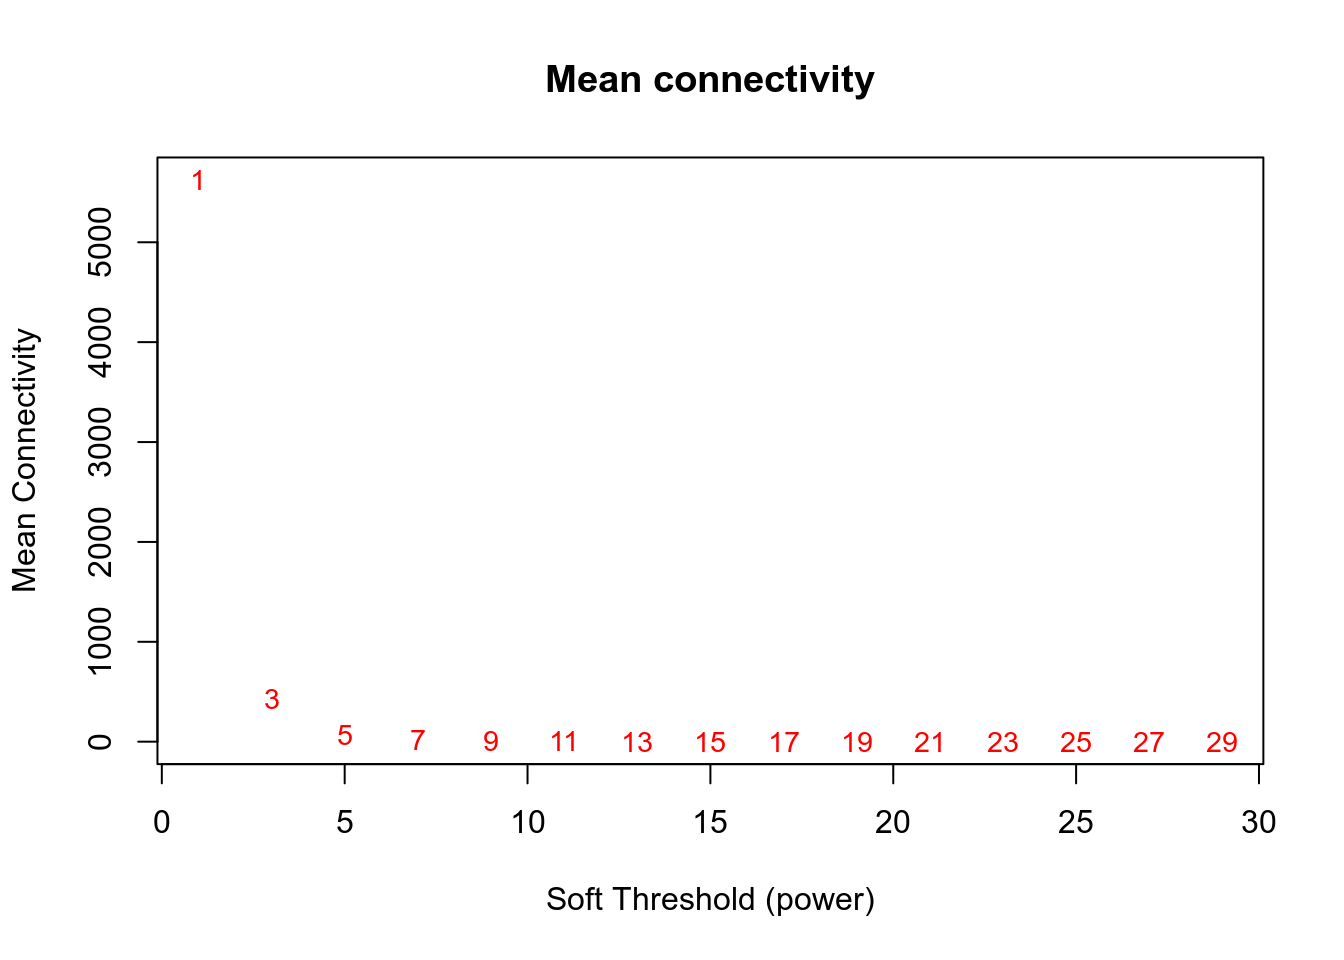
Network is computed using power=3.
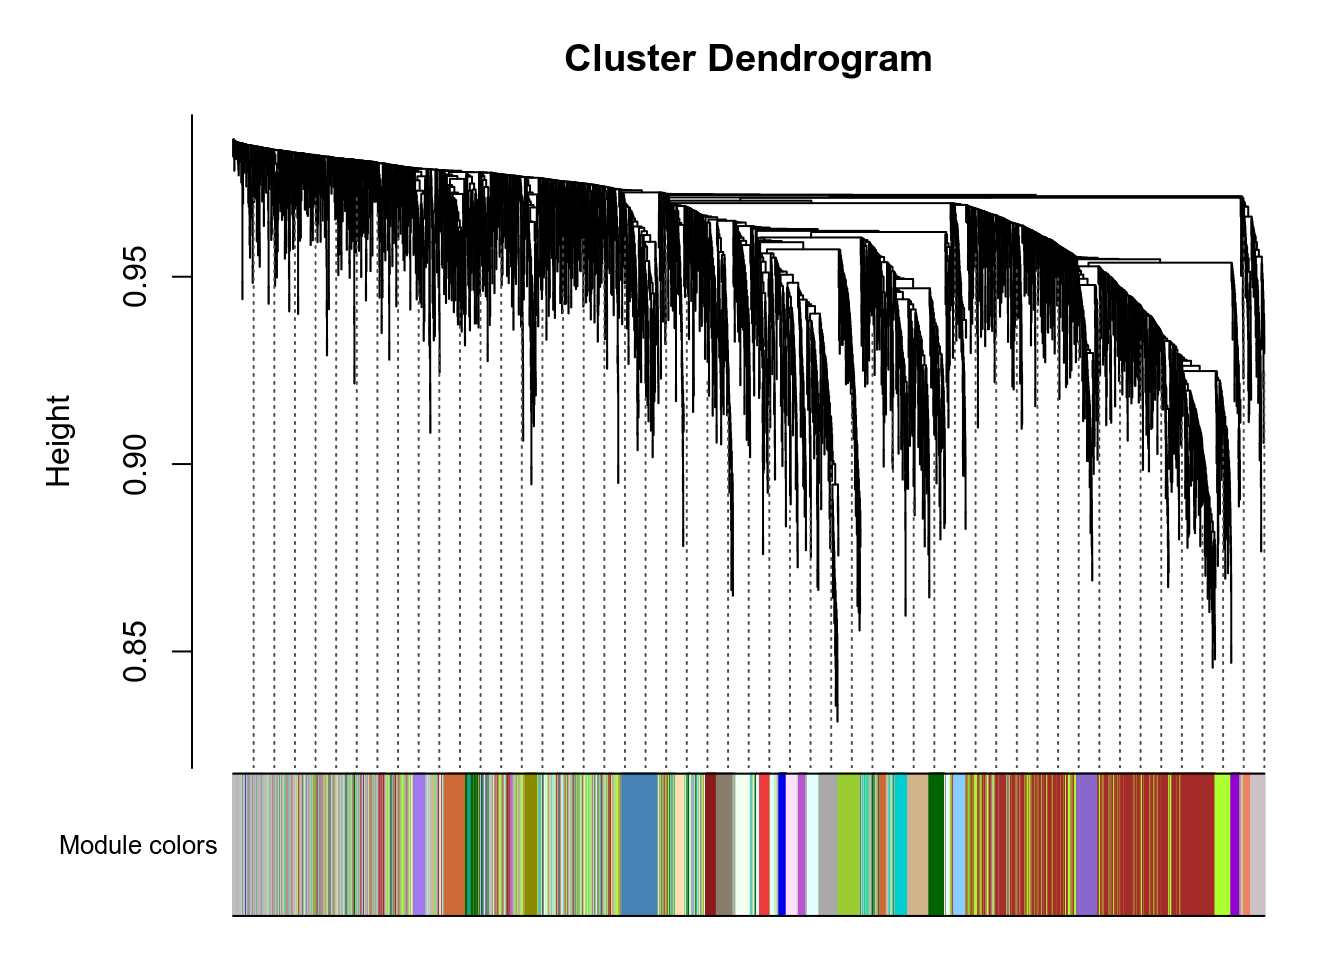
Here are the modules for a few genes of interest:
- VNN1 is in the blue module.
- PPARA is in the saddlebrown module.
- PPARD is in the grey module.
- PPARG is in the grey module.
- PPARGC1A is in the grey module.
- PPARGC1B is in the lightgreen module.
g:Profiler results for all modules are available here. Since there are many modules, you should expect at least 1 minute computation on the g:Profiler website for this query. Check below for faster queries focused on VNN1 module.
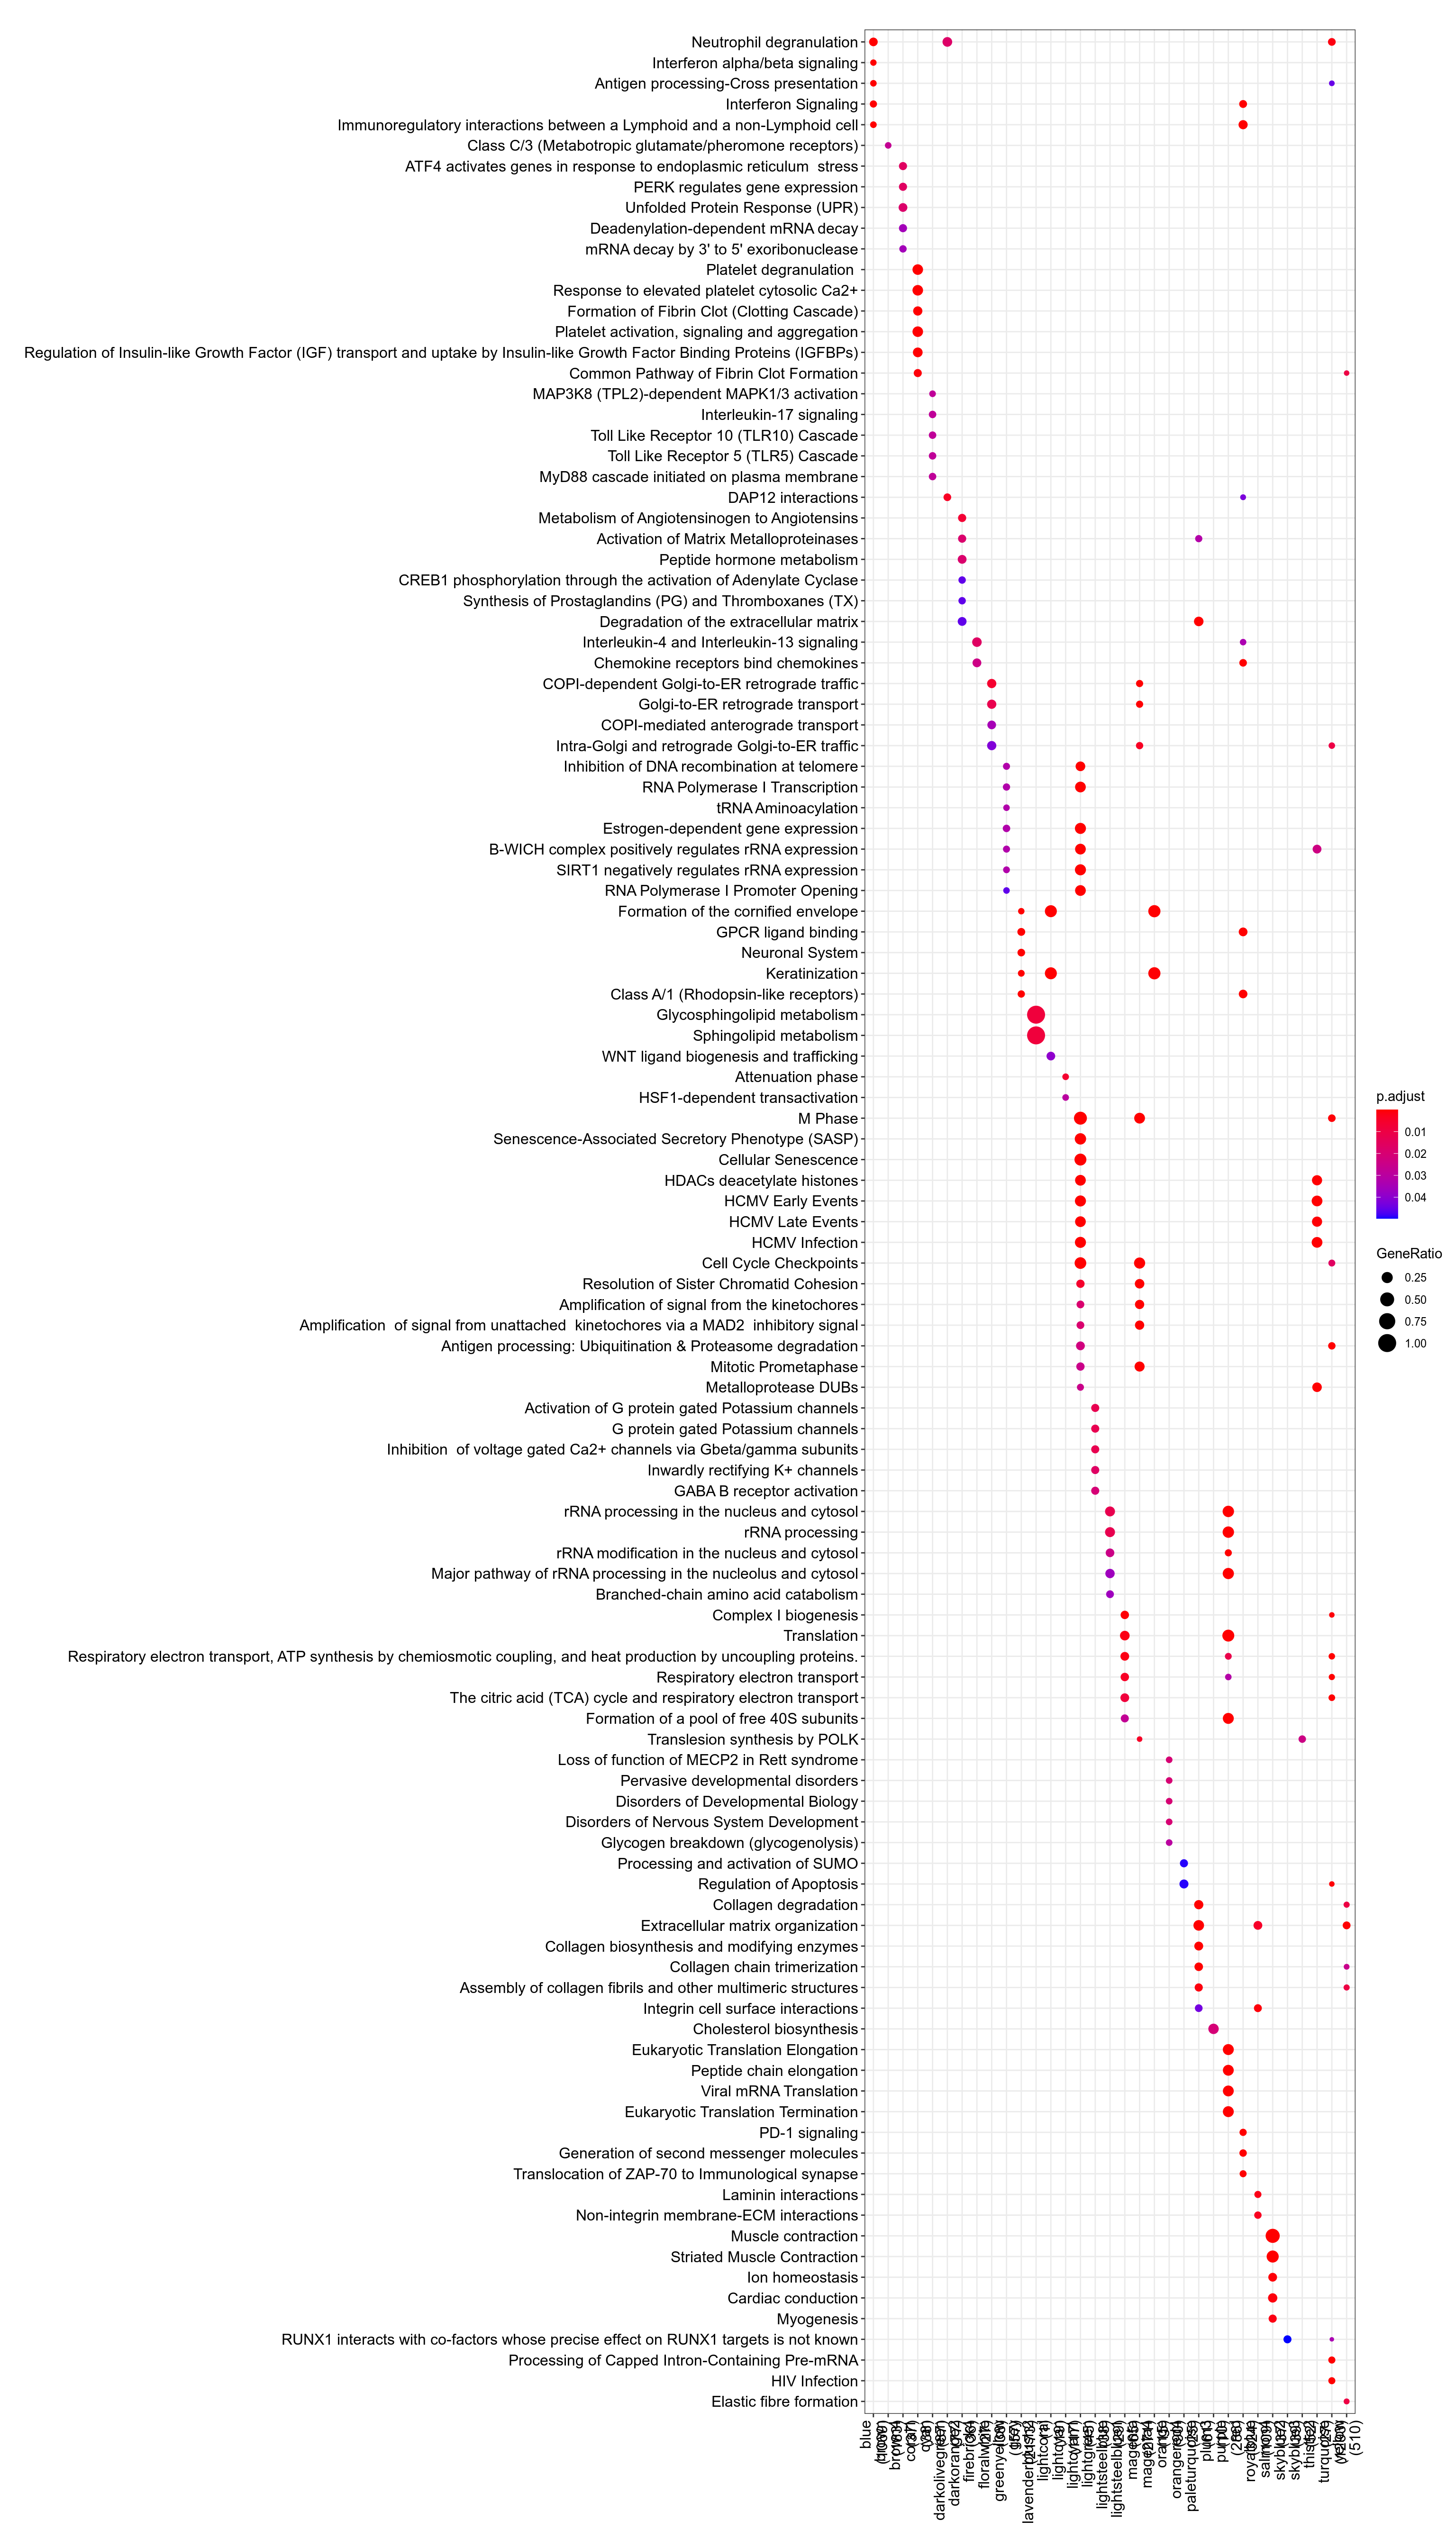
Figure 3.133: Pathway
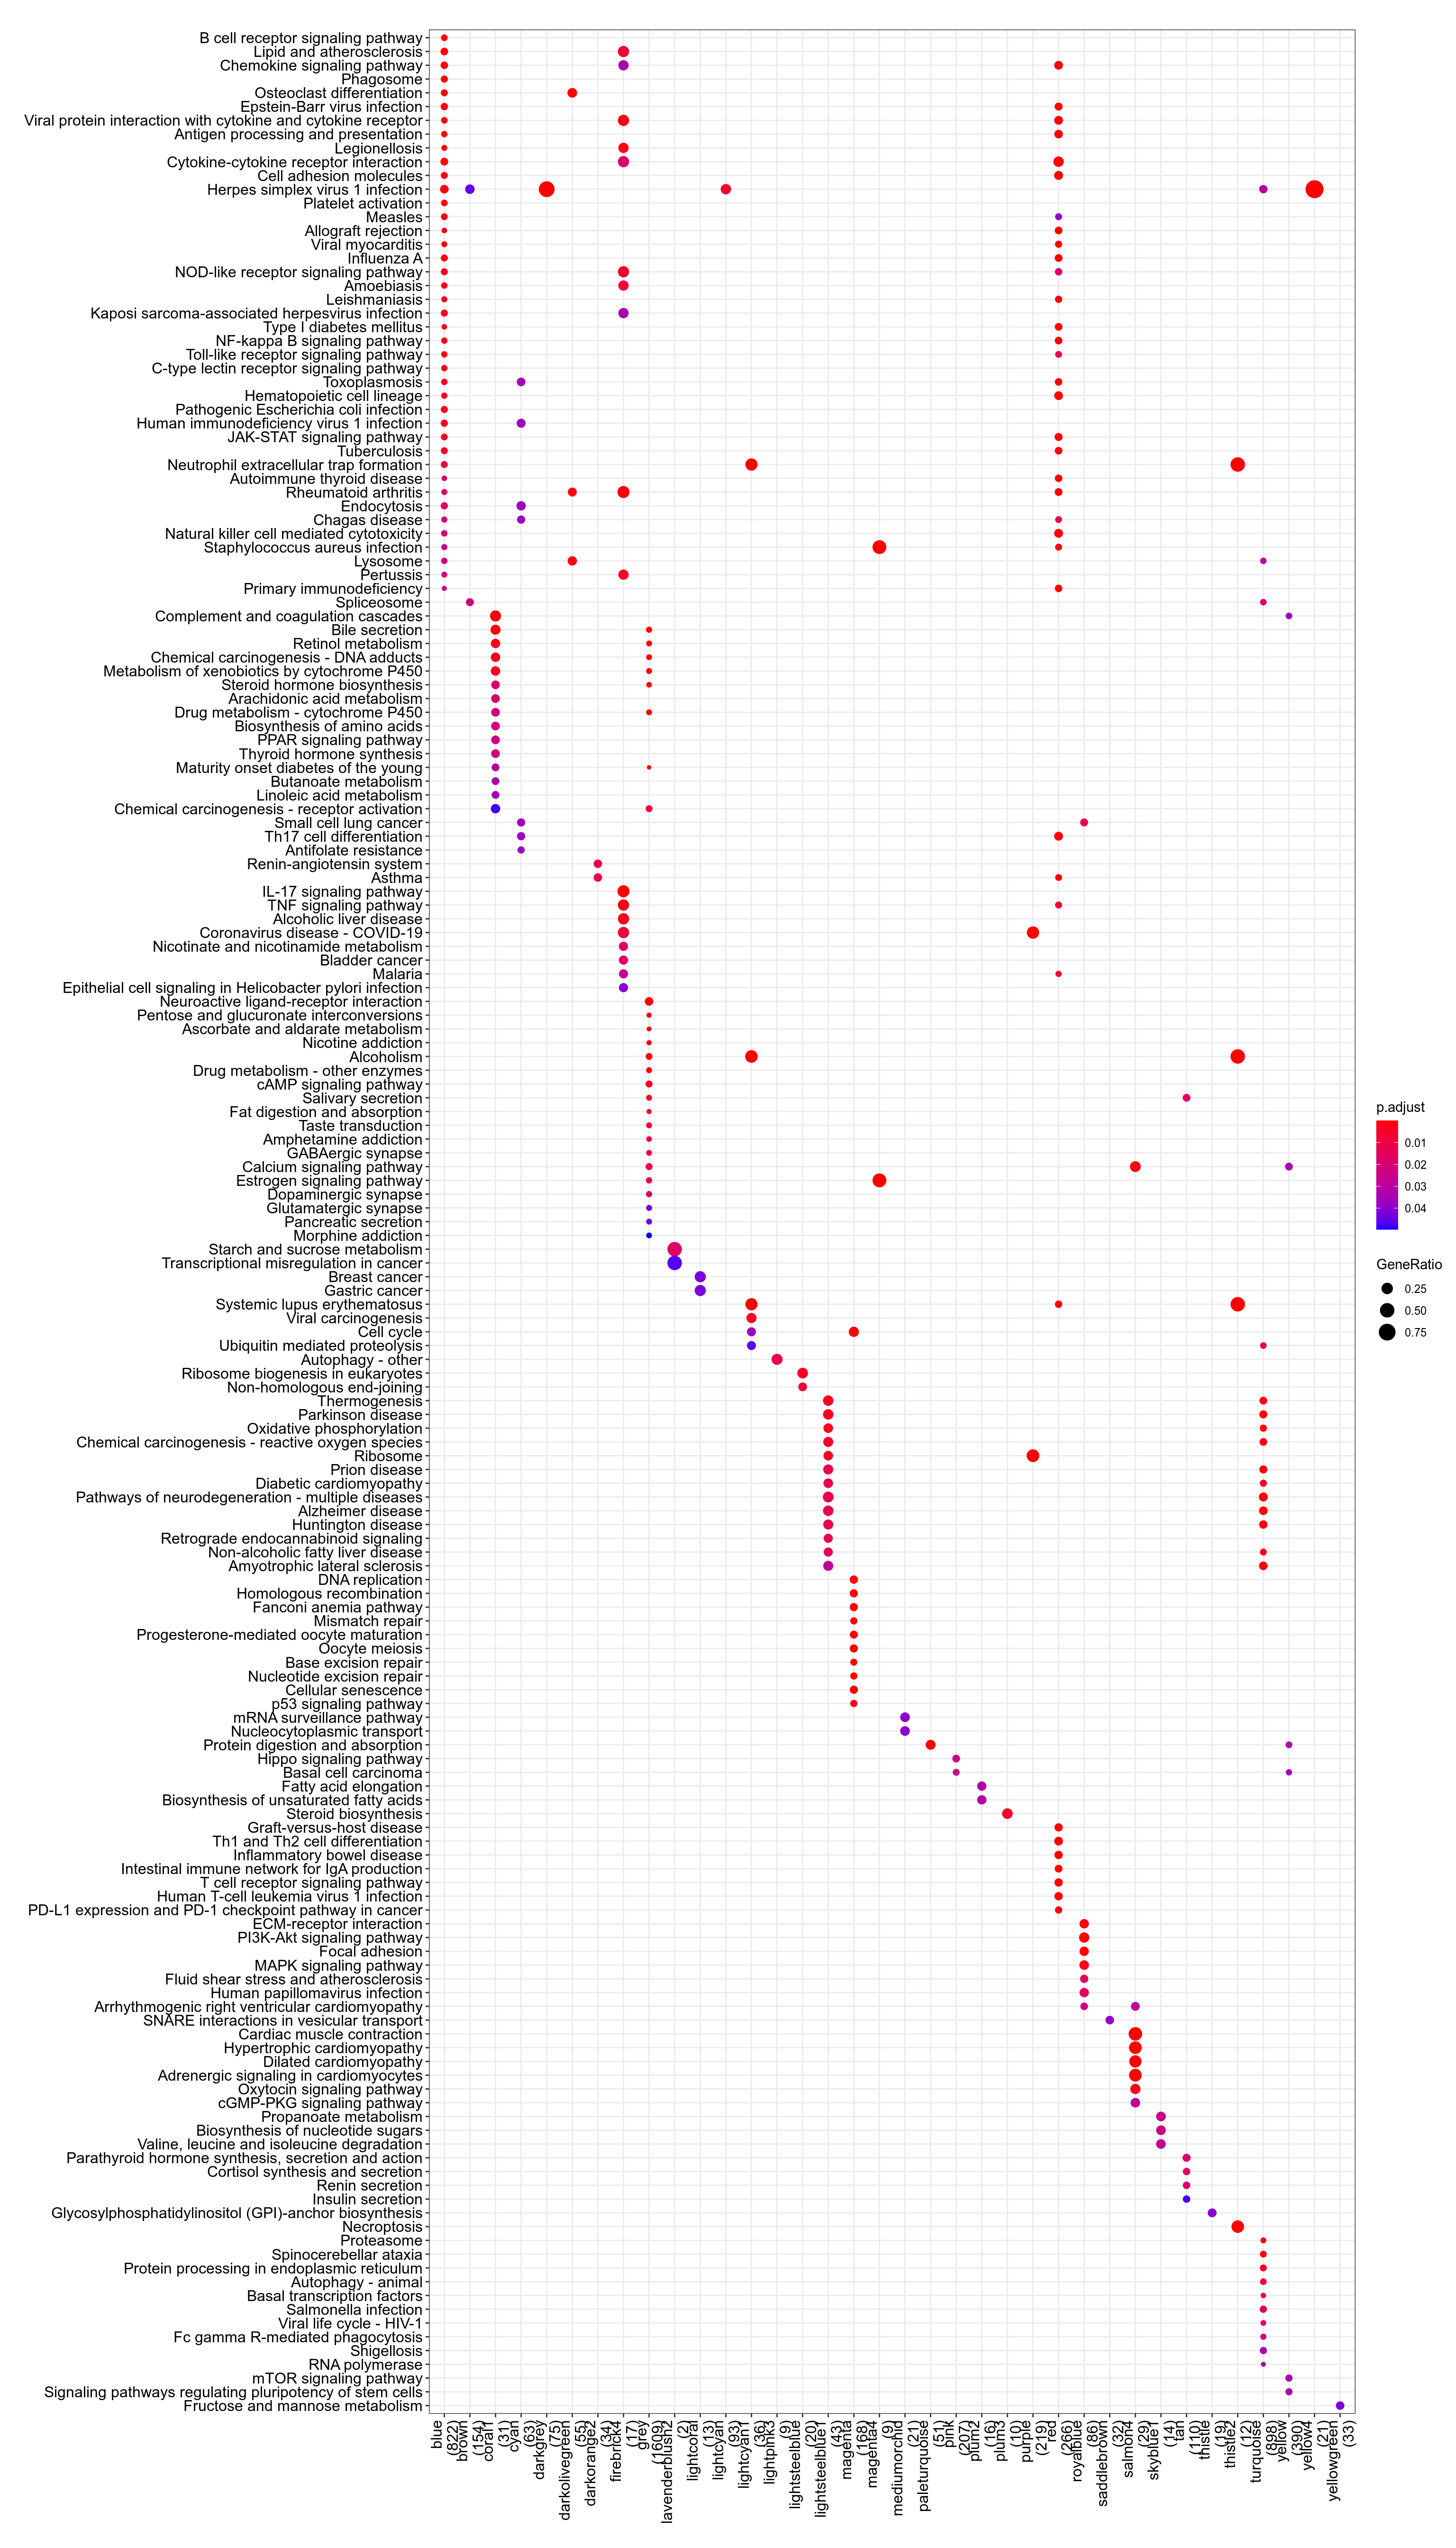
Figure 3.134: Kegg
.](_main_files/figure-html/resultsWgcnaTcgaSarcUPSKnitPlotEnrichHallmarks-1.png)
Figure 3.135: MSigDb Hallmarks. readable pdf version.
## No enriched DO term in these classesTo check that module-to-genes reattribution is working as expected, heatmap of signal for VNN1 module is produced, both as absolute values and as Z-score ones.
## VNN1 module contains more than 2000 genes. Heatmap generation is skippedVNN1 module contains more than 2000 genes. Heatmap generation is skipped
.](_main_files/figure-html/resultsWgcnaTcgaSarcUPSKnitPlotGenesInVNN1ModuleCorPearson-1.png)
Figure 3.136: Genes in VNN1 module plotted by Pearson correlation against it. Details are available in this table.
- Enrichr results for all genes in VNN1 module are available here
- Enrichr results for genes in VNN1 module and positively correlated with it are available here
- Enrichr results for genes in VNN1 module and negatively correlated with it are available here
- g:Profiler results for all genes in VNN1 module are available here
- g:Profiler results for genes in VNN1 module and positively correlated with it are available here
- g:Profiler results for genes in VNN1 module and negatively correlated with it are available here
- g:Profiler results for comparison of the three queries above are available here