3.1.1.2 Primary diagnosis subtypes
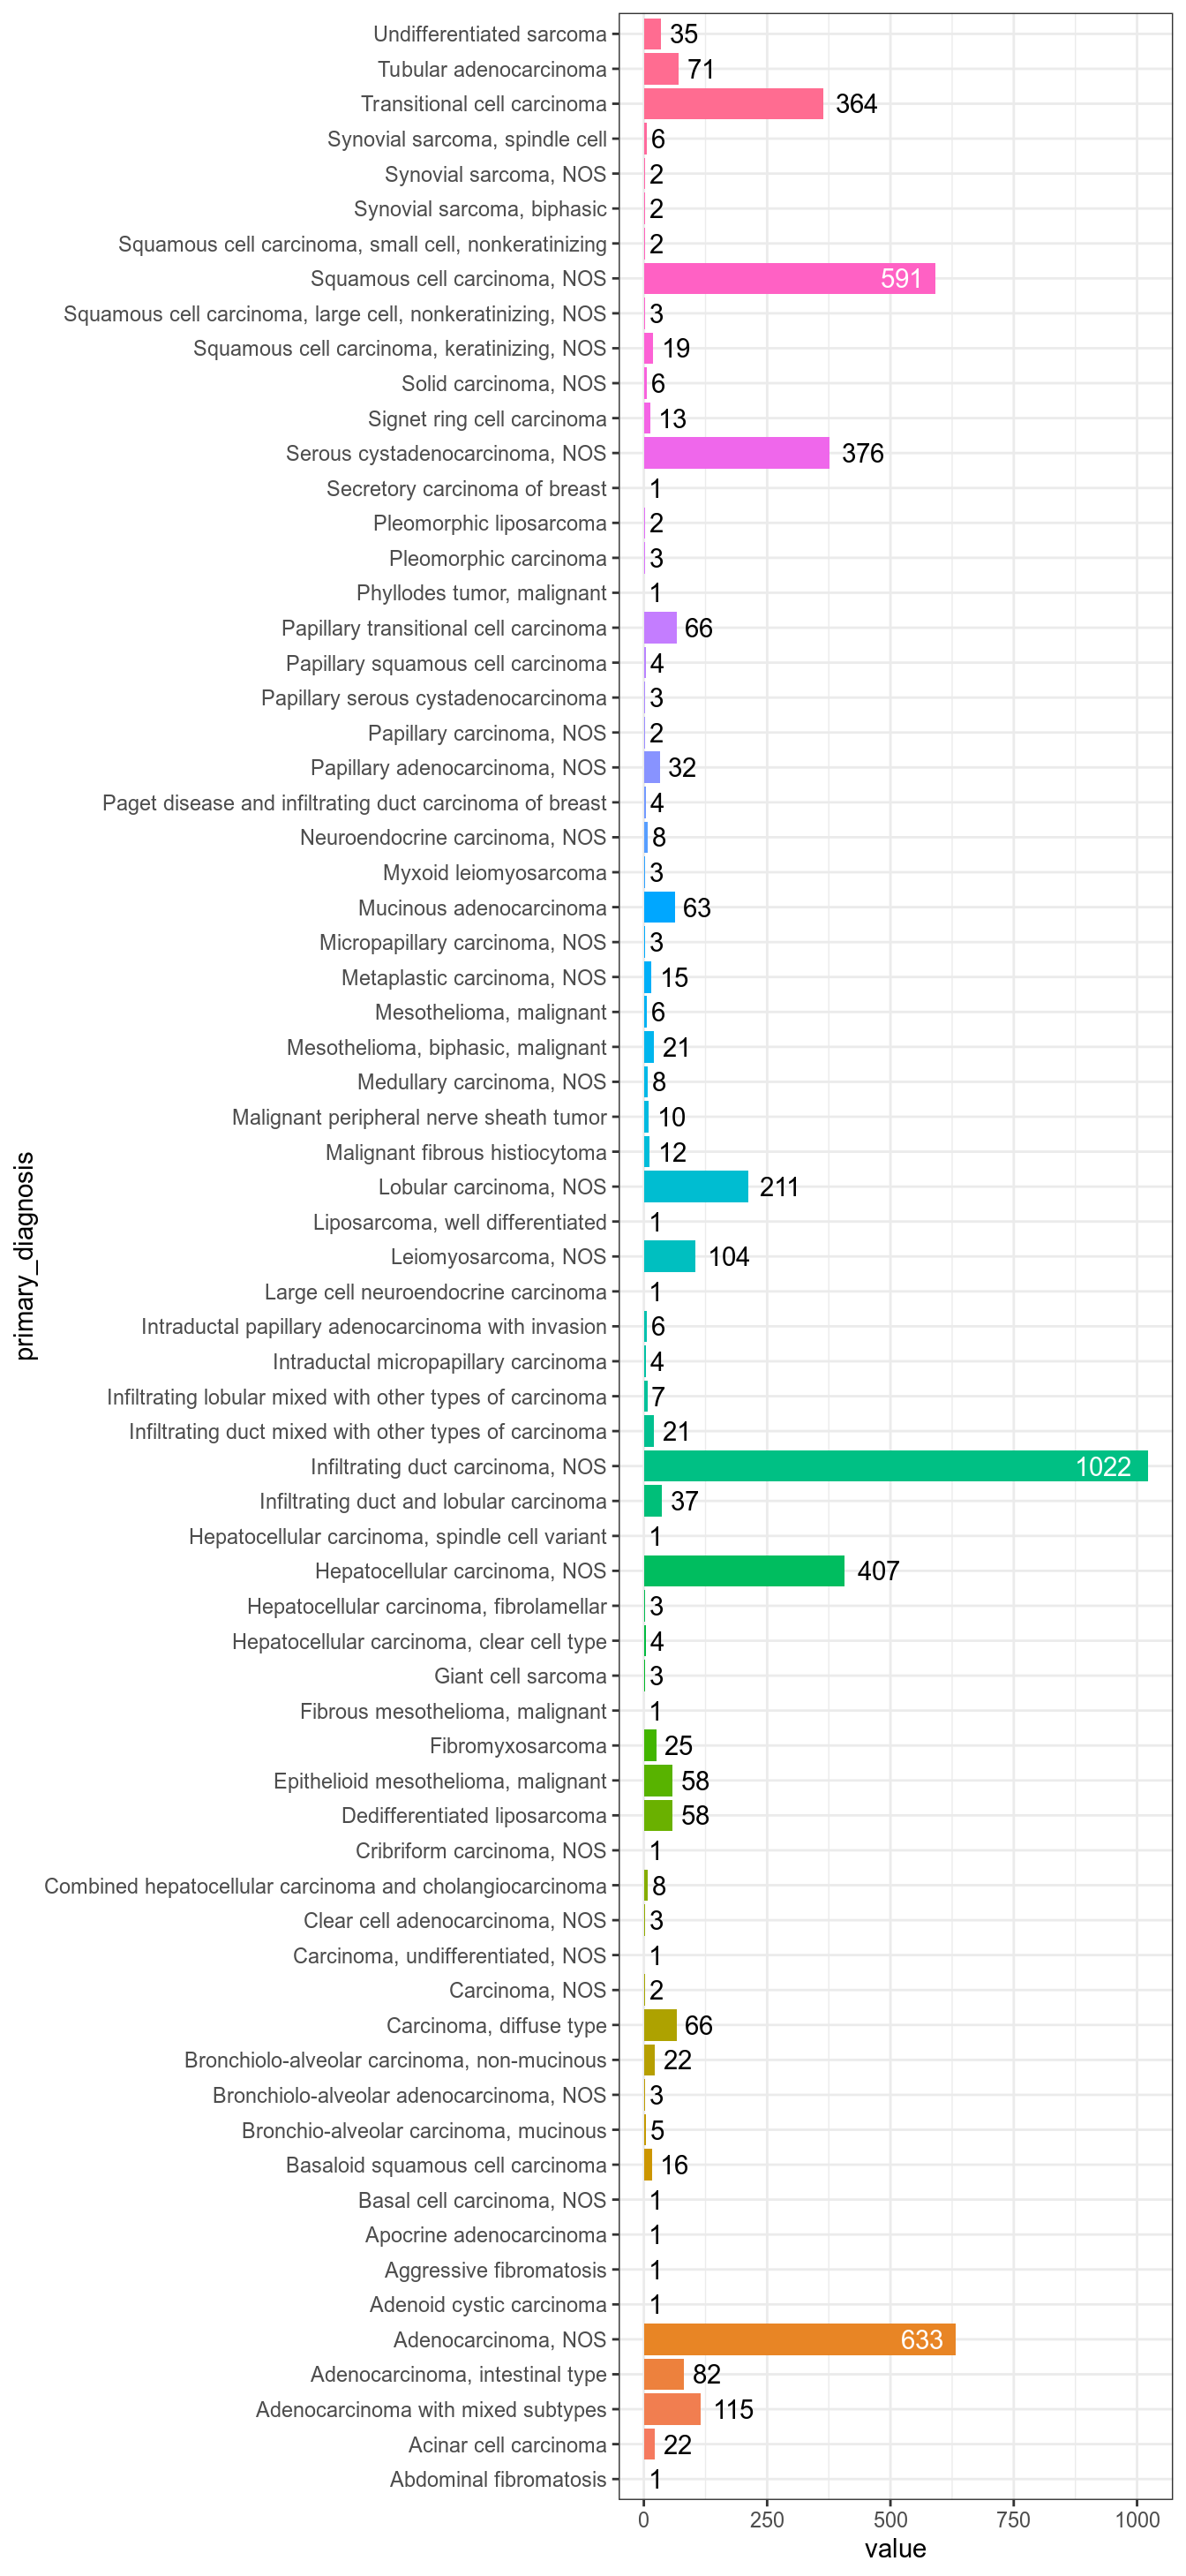
Figure 3.10: Number of samples by sarcoma subtypes.
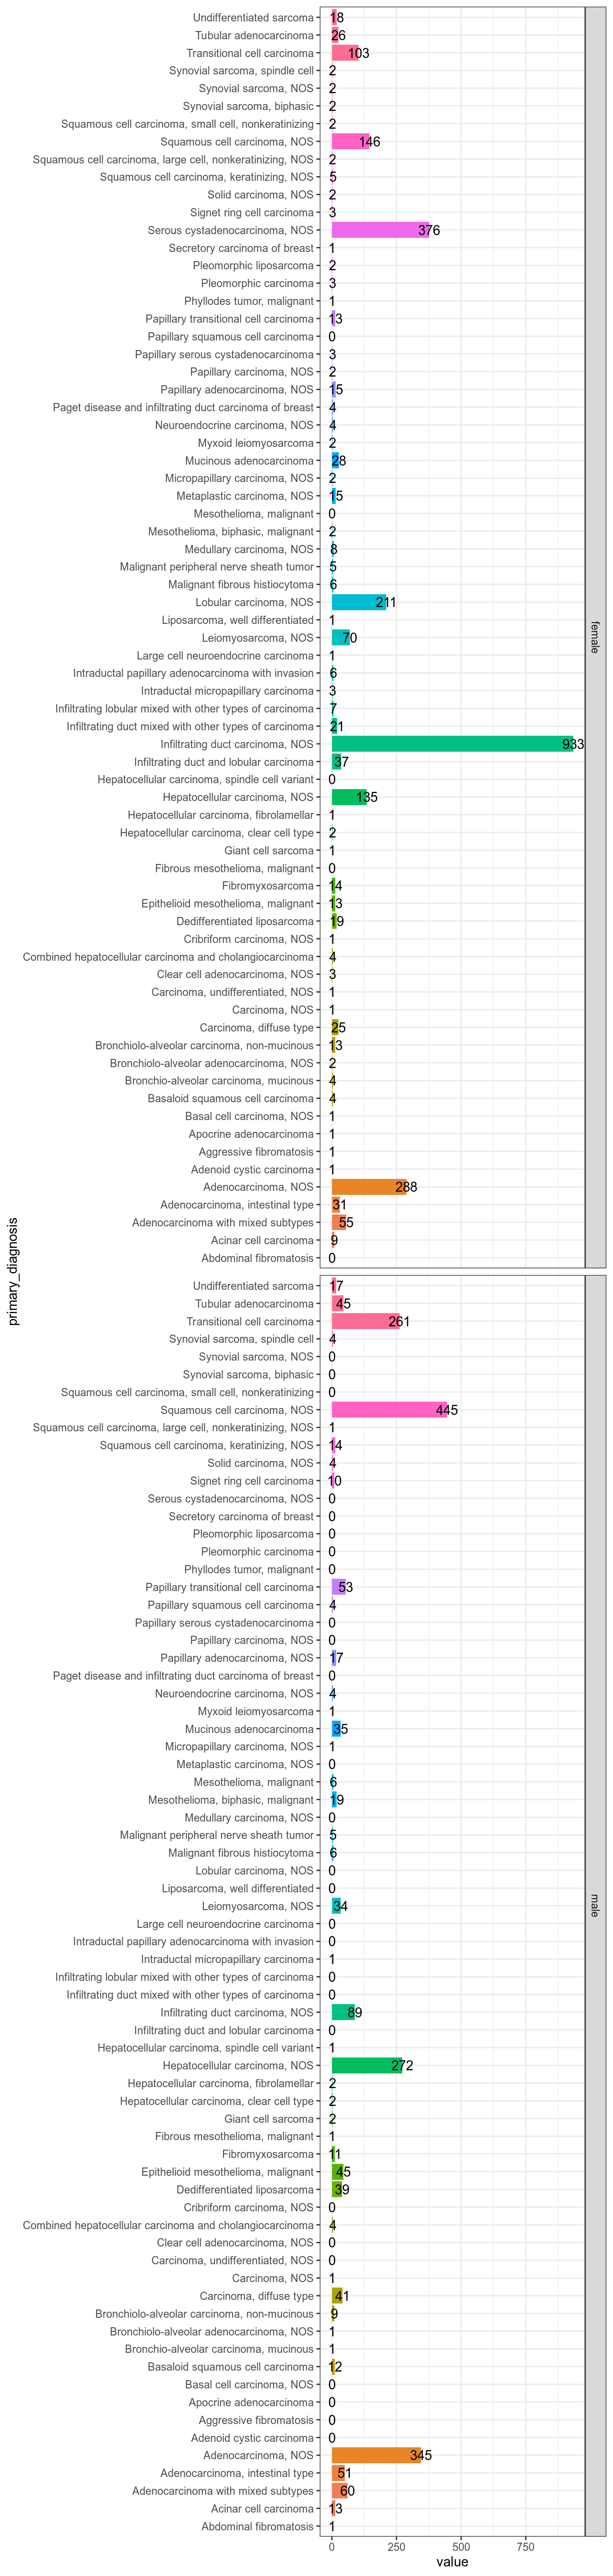
Figure 3.11: Number of samples by sarcoma subtypes and sex.

Figure 3.12: Distribution of VNN1 signal in all sarcoma subtypes from TCGA-SARC dataset as histogram
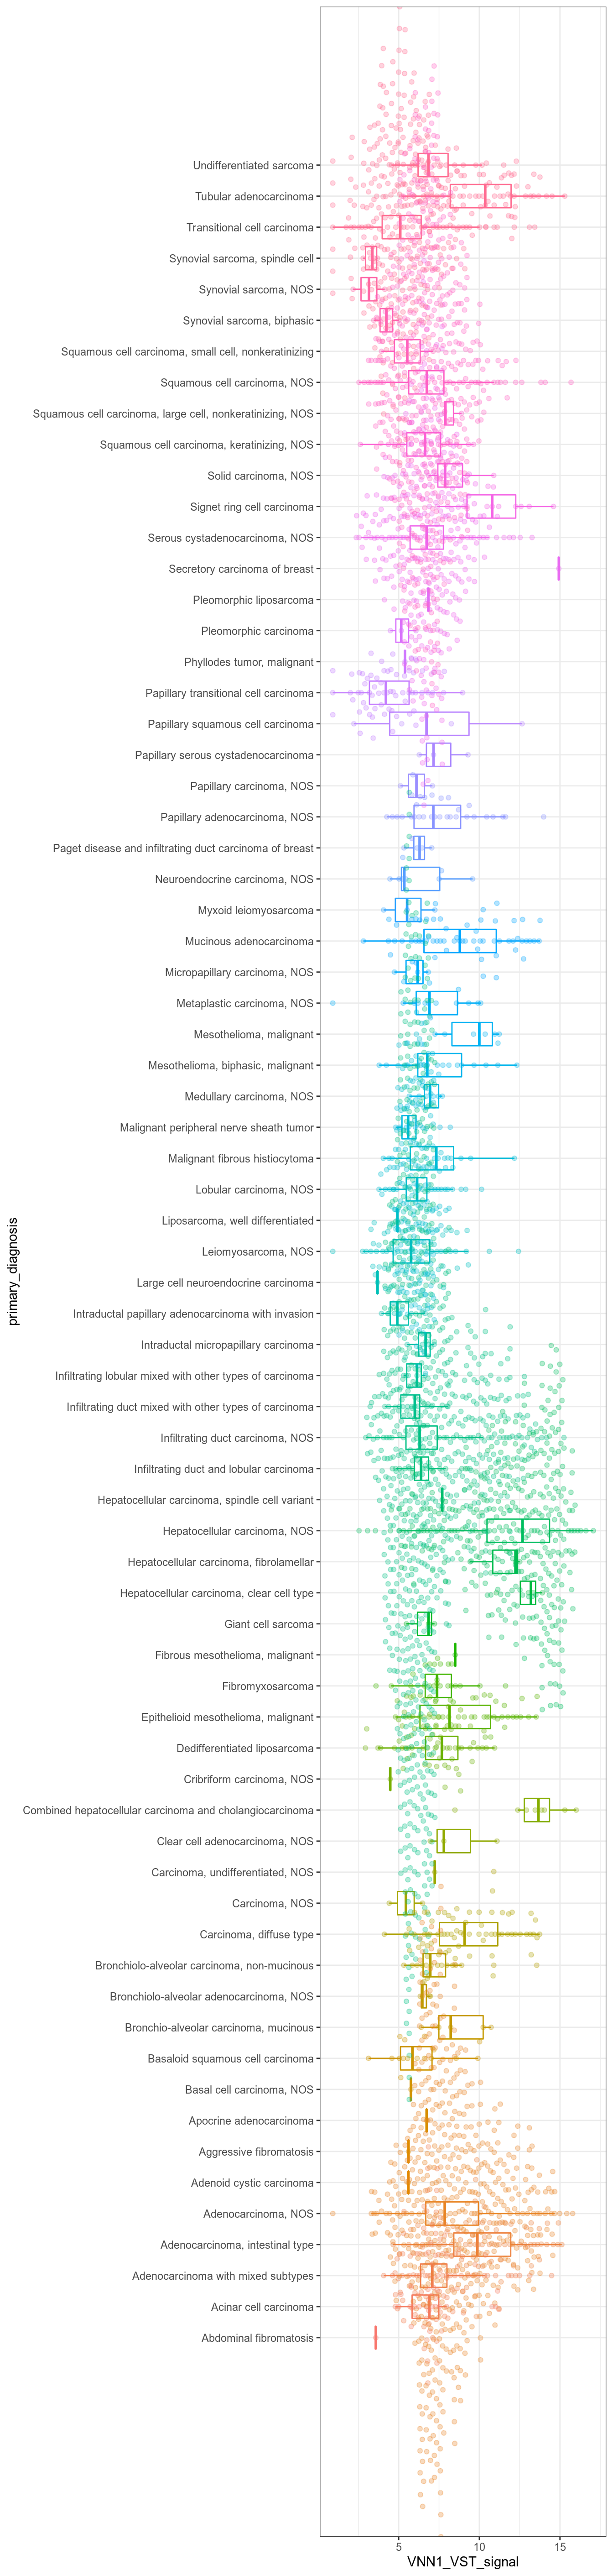
Figure 3.13: Distribution of VNN1 signal in all sarcoma subtypes from TCGA-SARC dataset as box-beeswarm-plots

Figure 3.14: Distribution of VNN1 signal in all sarcoma subtypes from TCGA-SARC dataset as box-beeswarm-plots, splitted by gender
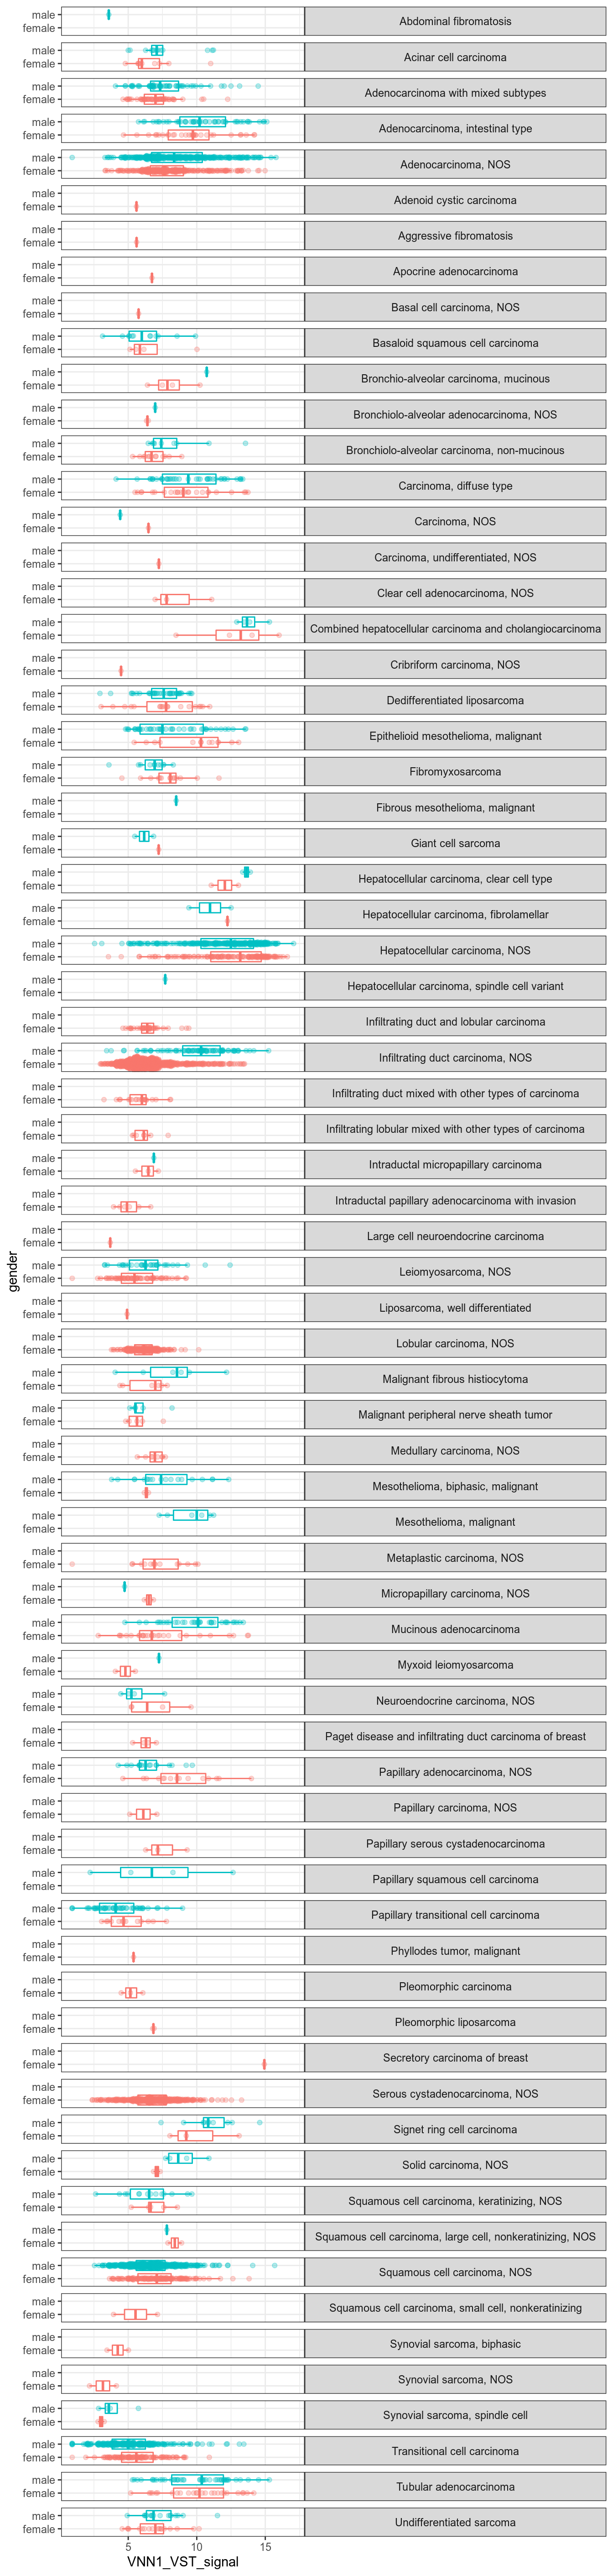
Figure 3.15: Distribution of VNN1 signal in all sarcoma subtypes from TCGA-SARC dataset as box-beeswarm-plots, splitted by gender and primary_diagnosis

Figure 3.16: Distribution of VNN1 signal in all sarcoma subtypes from TCGA-SARC dataset. VNN1+ and VNN1- classes are called using the median VNN1 VST signal as threshold.