3.2.2.2 Dedifferentiated liposarcoma
There are 36886 genes and 58 samples in the dataset.
At least some samples or genes look not suitable for the co-expression analysis. After removing them, there remain 36784 genes and 58 samples.
##    Power SFT.R.sq slope truncated.R.sq  mean.k. median.k.  max.k.
## 1      1    0.570 -3.39          0.950 5410.000  5.14e+03 10100.0
## 2      3    0.868 -2.52          0.980  387.000  2.95e+02  1940.0
## 3      5    0.901 -2.27          0.980   59.300  3.16e+01   651.0
## 4      7    0.922 -2.03          0.990   14.500  4.86e+00   304.0
## 5      9    0.951 -1.82          0.995    4.910  9.55e-01   173.0
## 6     11    0.961 -1.67          0.992    2.130  2.29e-01   115.0
## 7     13    0.964 -1.58          0.997    1.110  6.29e-02    85.2
## 8     15    0.962 -1.50          0.989    0.660  1.90e-02    66.3
## 9     17    0.966 -1.43          0.995    0.435  6.20e-03    53.2
## 10    19    0.962 -1.38          0.984    0.308  2.13e-03    43.6
## 11    21    0.940 -1.35          0.954    0.231  7.66e-04    36.4
## 12    23    0.974 -1.28          0.981    0.181  2.84e-04    30.8
## 13    25    0.948 -1.26          0.942    0.147  1.09e-04    26.3
## 14    27    0.949 -1.25          0.941    0.122  4.32e-05    24.3
## 15    29    0.954 -1.23          0.943    0.104  1.73e-05    23.3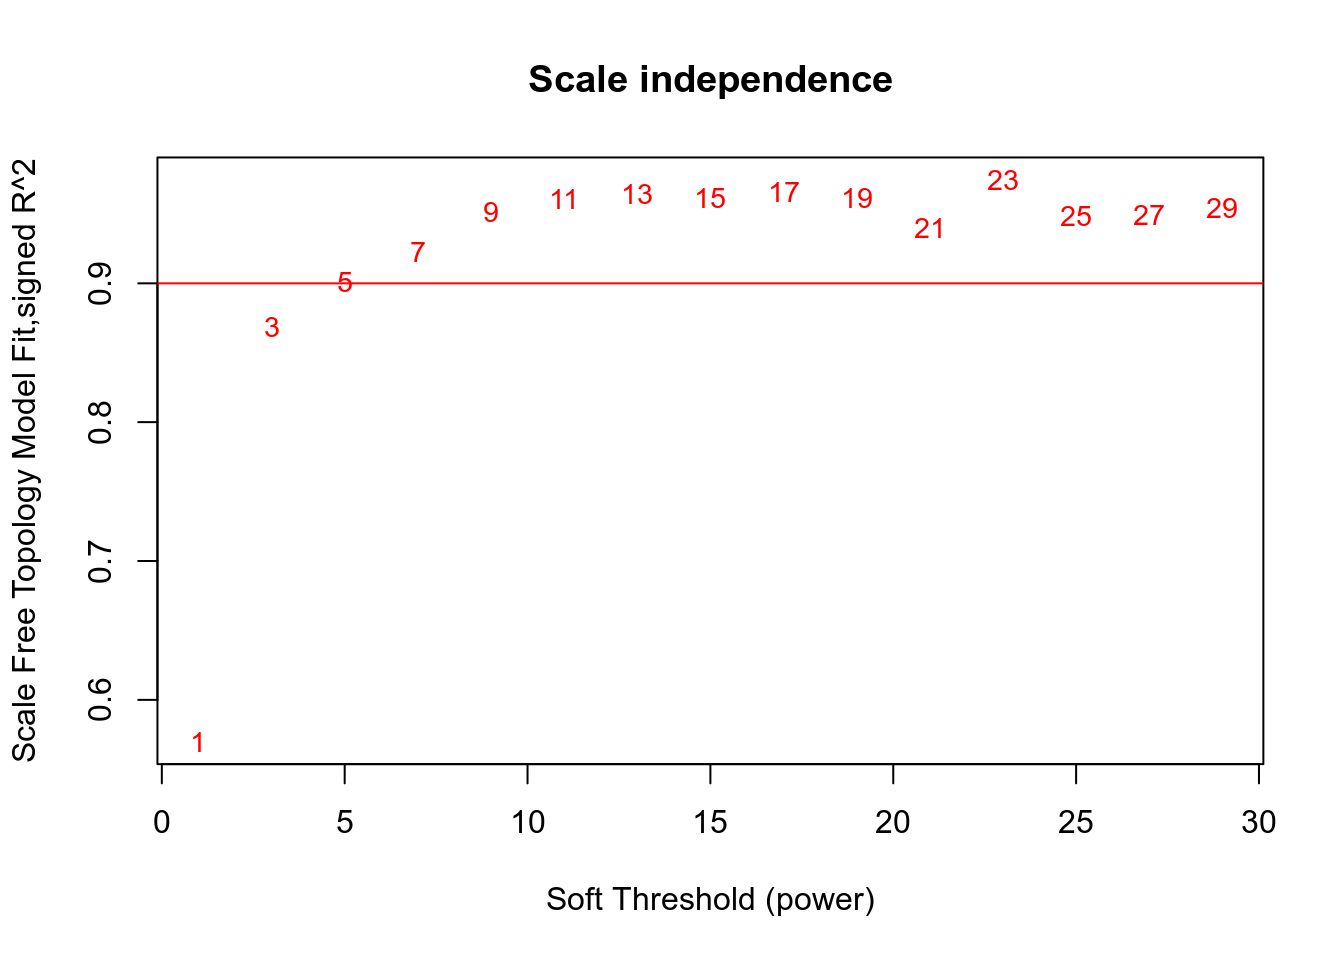
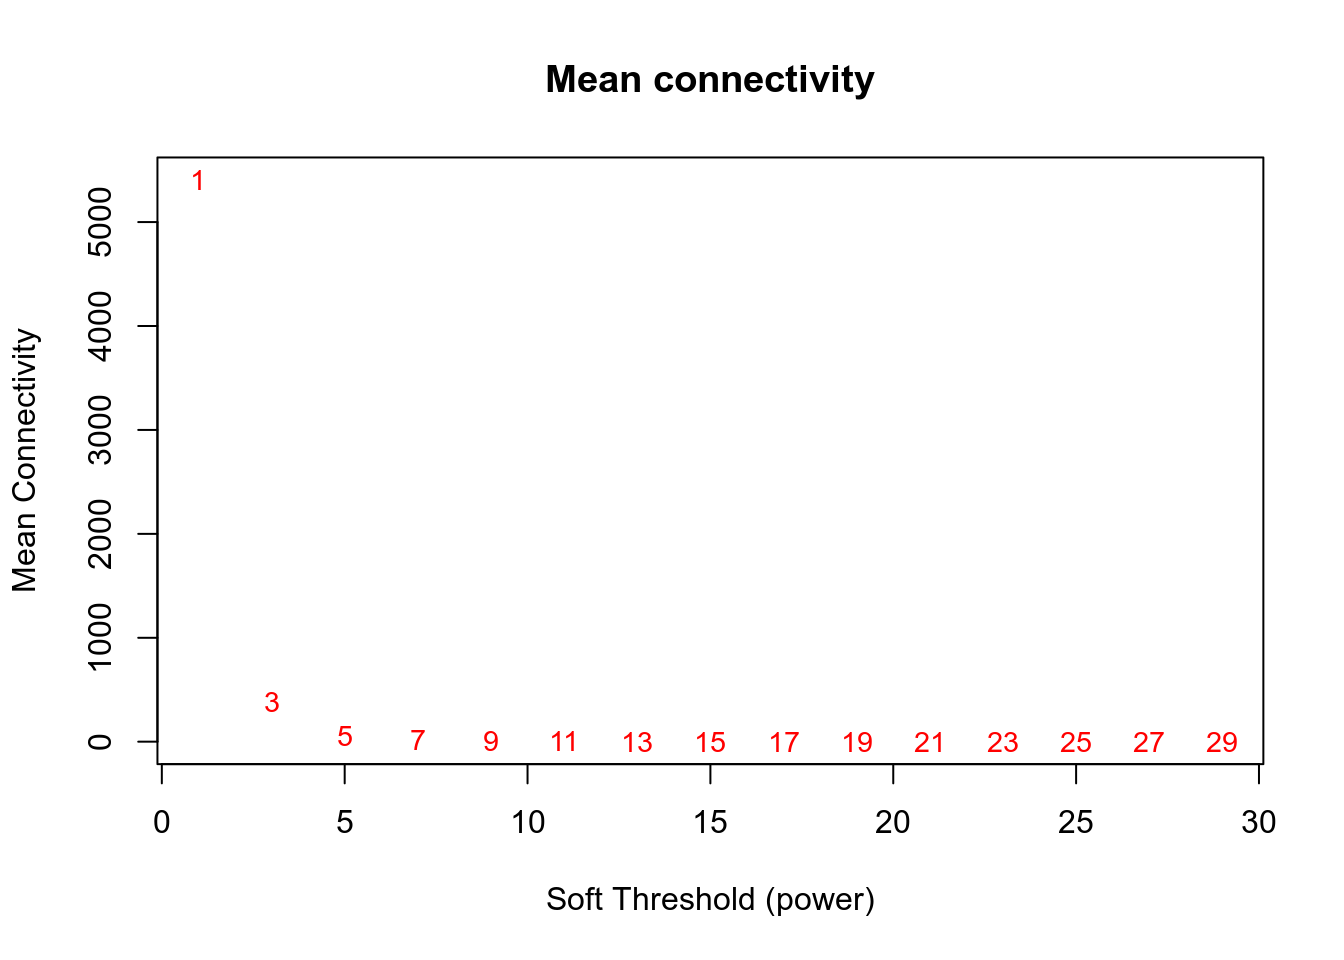
Network is computed using power=3.
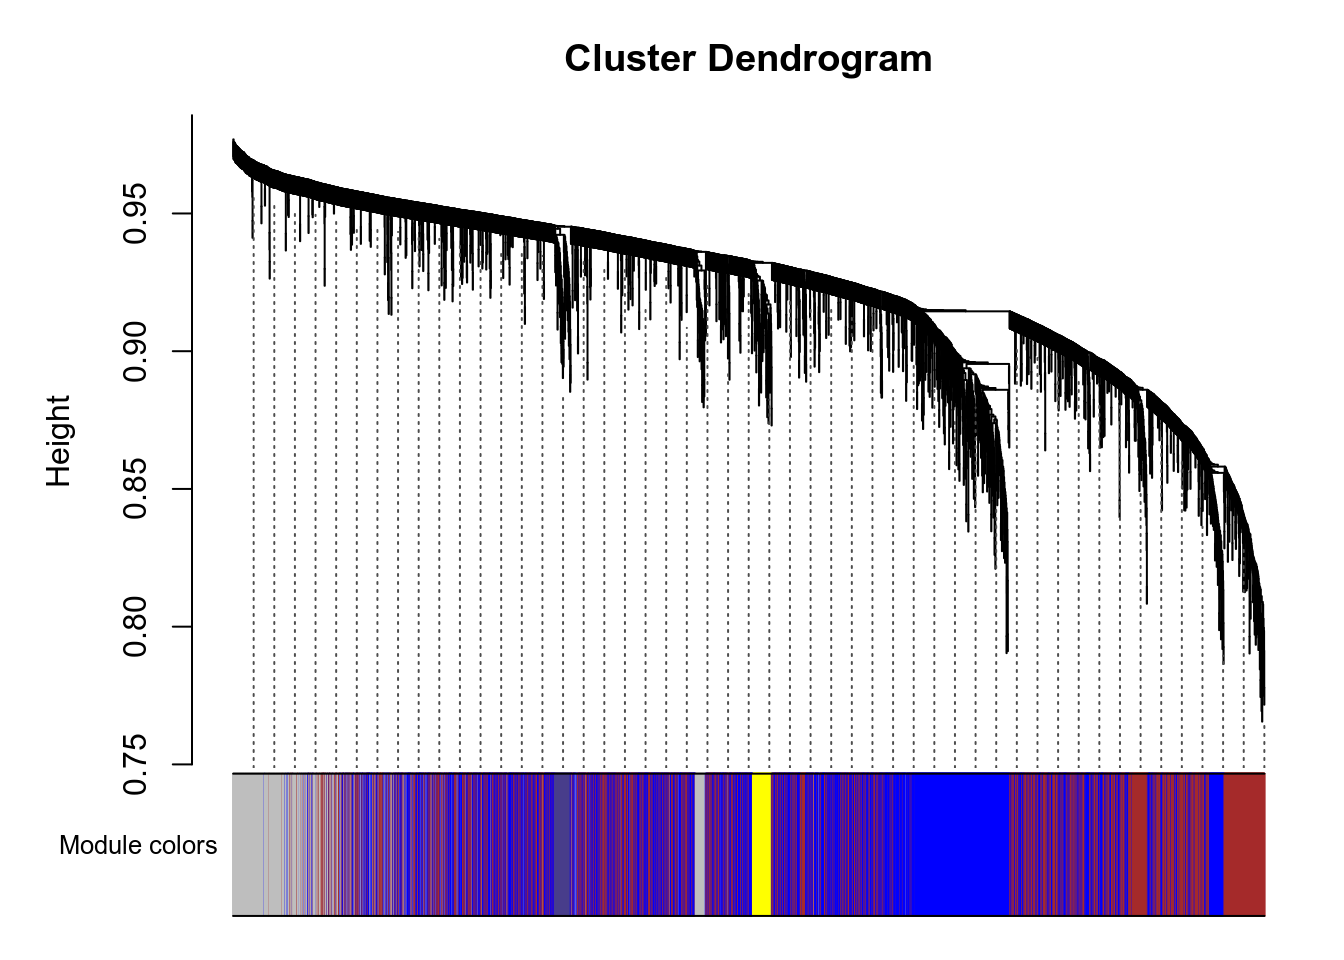
Here are the modules for a few genes of interest:
- VNN1 is in the green module.
- PPARA is in the lightcyan1 module.
- PPARD is in the royalblue module.
- PPARG is in the steelblue module.
- PPARGC1A is in the grey module.
- PPARGC1B is in the yellow module.
g:Profiler results for all modules are available here. Since there are many modules, you should expect at least 1 minute computation on the g:Profiler website for this query. Check below for faster queries focused on VNN1 module.

Figure 3.93: Pathway

Figure 3.94: Kegg
.](_main_files/figure-html/resultsWgcnaTcgaSarcDedifferentiatedLiposarcomaKnitPlotEnrichHallmarks-1.png)
Figure 3.95: MSigDb Hallmarks. readable pdf version.
## No enriched DO term in these classesTo check that module-to-genes reattribution is working as expected, heatmap of signal for VNN1 module is produced, both as absolute values and as Z-score ones.
.](../../../out/bookdown/VNN1_sarcoma/plots/resultsWgcnaTcgaSarcDedifferentiatedLiposarcomaKnitPlotHeatmapVNN1ModuleAbsoluteValues.png)
Figure 3.96: log2(vst) signal in VNN1 module. Rows were gene name is prefixed with "-" display negative Z-score for these genes, meaning their signal is anticorrelated with other genes in the cluster. pdf version with readable genes and findable VNN1.
.](../../../out/bookdown/VNN1_sarcoma/plots/resultsWgcnaTcgaSarcDedifferentiatedLiposarcomaKnitPlotHeatmapVNN1ModuleZscoreValues.png)
Figure 3.97: Zscore of log2(vst) signal in VNN1 module. Rows were gene name is prefixed with "-" display negative Z-score for these genes, meaning their signal is anticorrelated with other genes in the cluster. pdf version with readable genes and findable VNN1.
.](_main_files/figure-html/resultsWgcnaTcgaSarcDedifferentiatedLiposarcomaKnitPlotGenesInVNN1ModuleCorPearson-1.png)
Figure 3.98: Genes in VNN1 module plotted by Pearson correlation against it. Details are available in this table.
- Enrichr results for all genes in VNN1 module are available here
- Enrichr results for genes in VNN1 module and positively correlated with it are available here
- Enrichr results for genes in VNN1 module and negatively correlated with it are available here
- g:Profiler results for all genes in VNN1 module are available here
- g:Profiler results for genes in VNN1 module and positively correlated with it are available here
- g:Profiler results for genes in VNN1 module and negatively correlated with it are available here
- g:Profiler results for comparison of the three queries above are available here