3.1.1 All selected projects
3.1.1.1 Project id subtypes
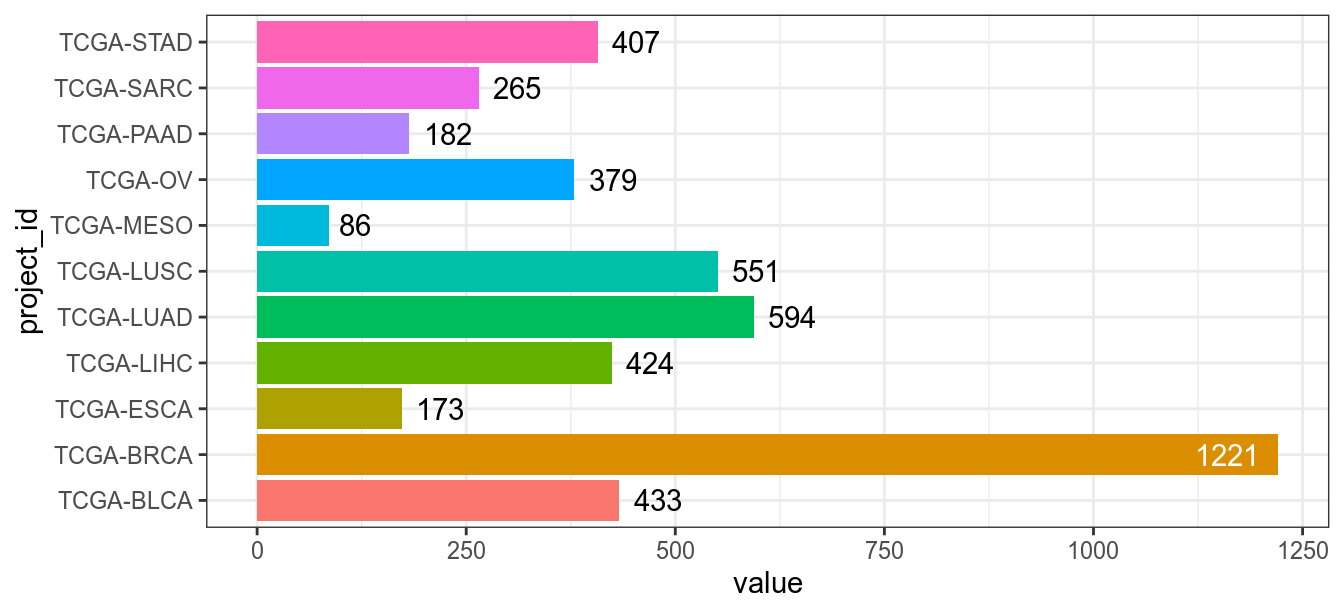
Figure 3.3: Number of samples by sarcoma subtypes.
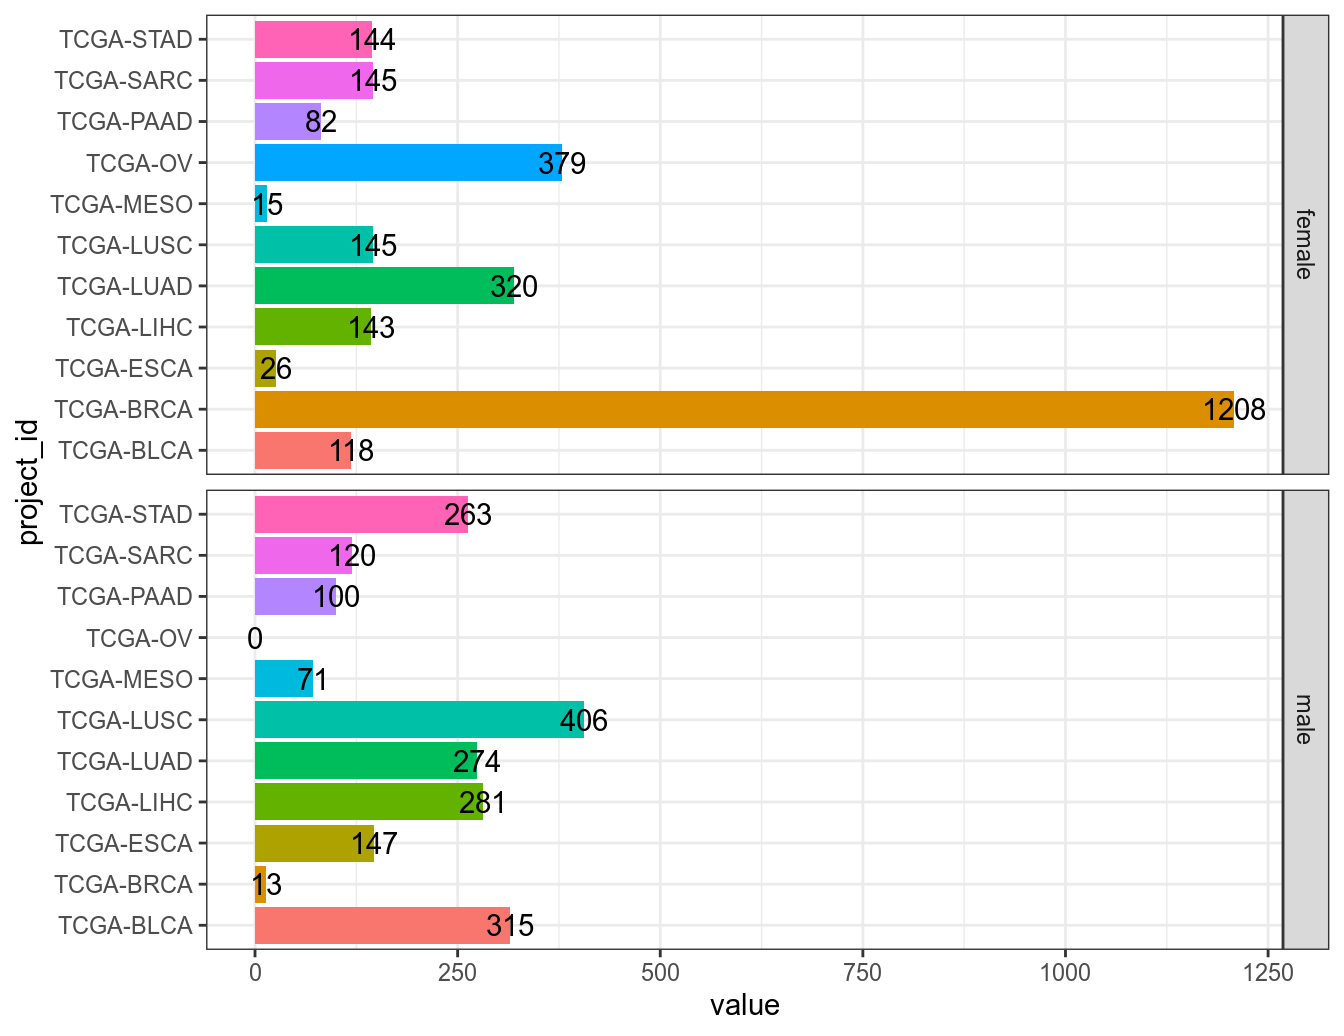
Figure 3.4: Number of samples by sarcoma subtypes and sex.
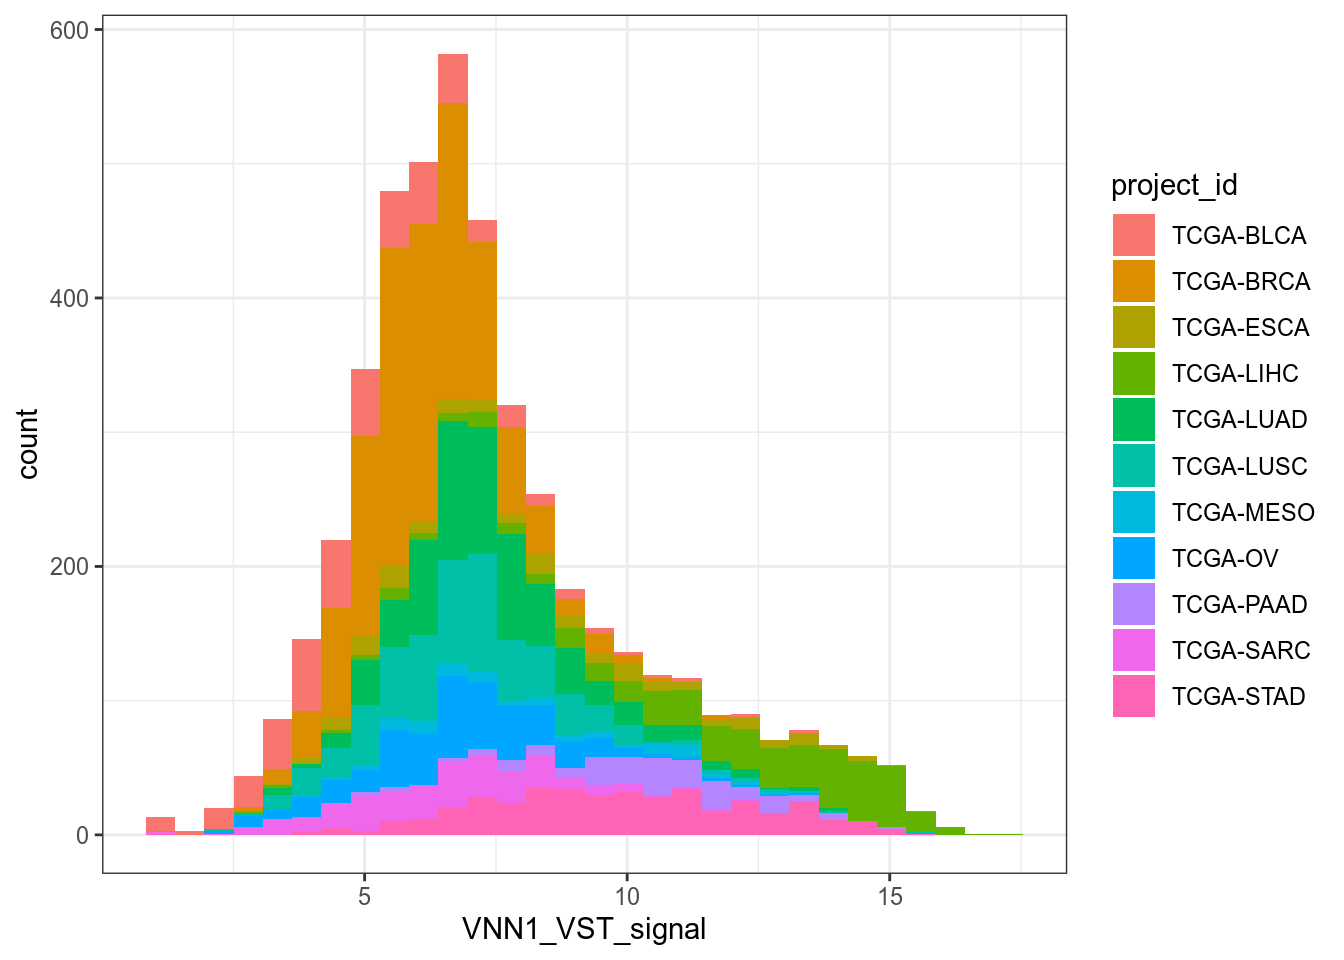
Figure 3.5: Distribution of VNN1 signal in all sarcoma subtypes from TCGA-SARC dataset as histogram
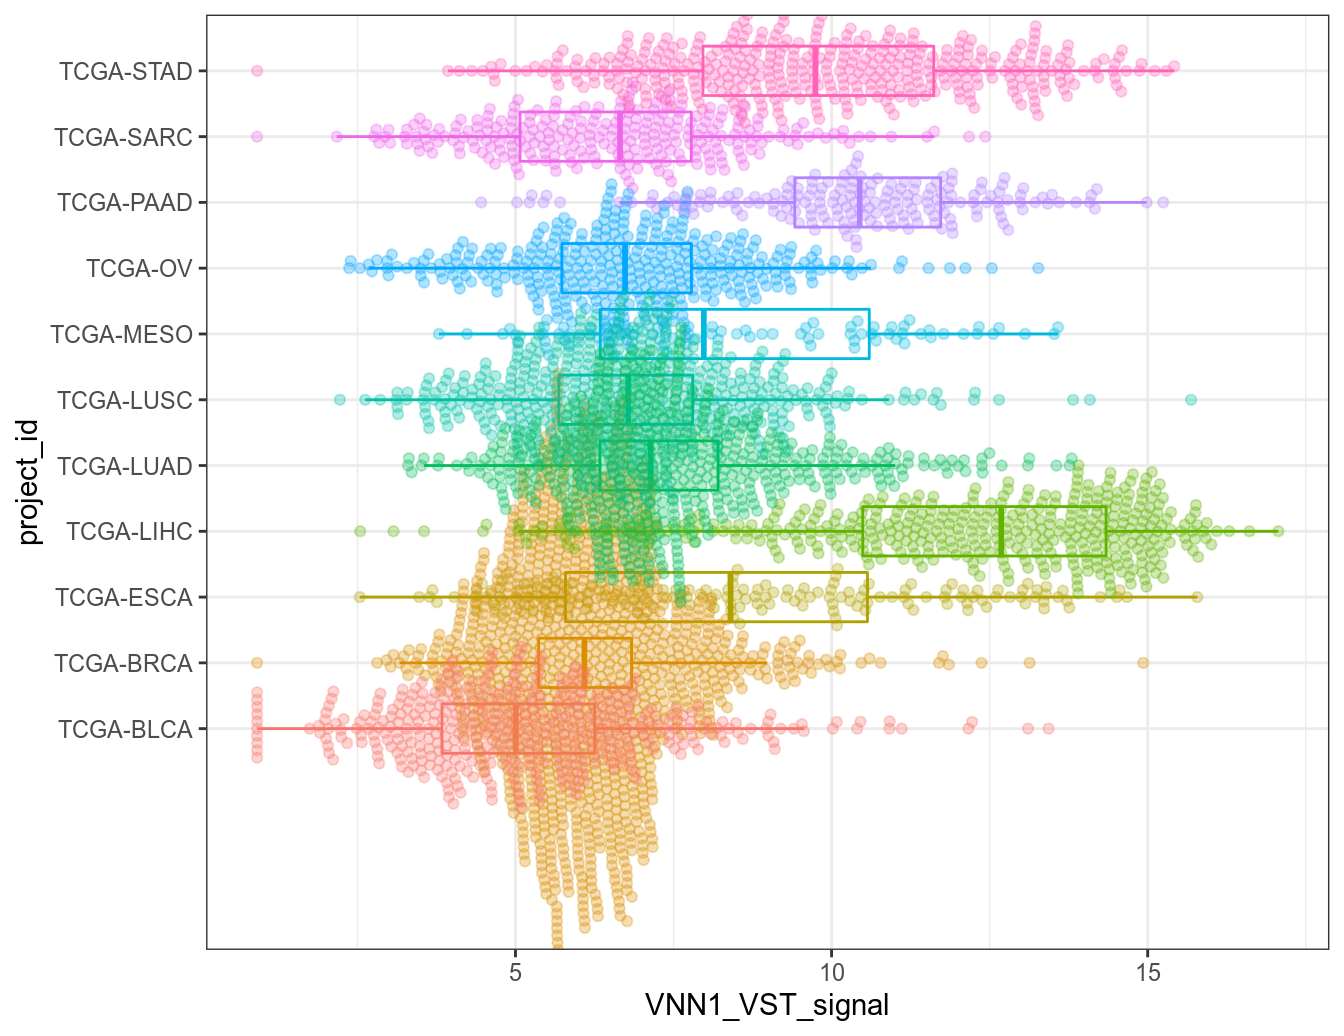
Figure 3.6: Distribution of VNN1 signal in all sarcoma subtypes from TCGA-SARC dataset as box-beeswarm-plots
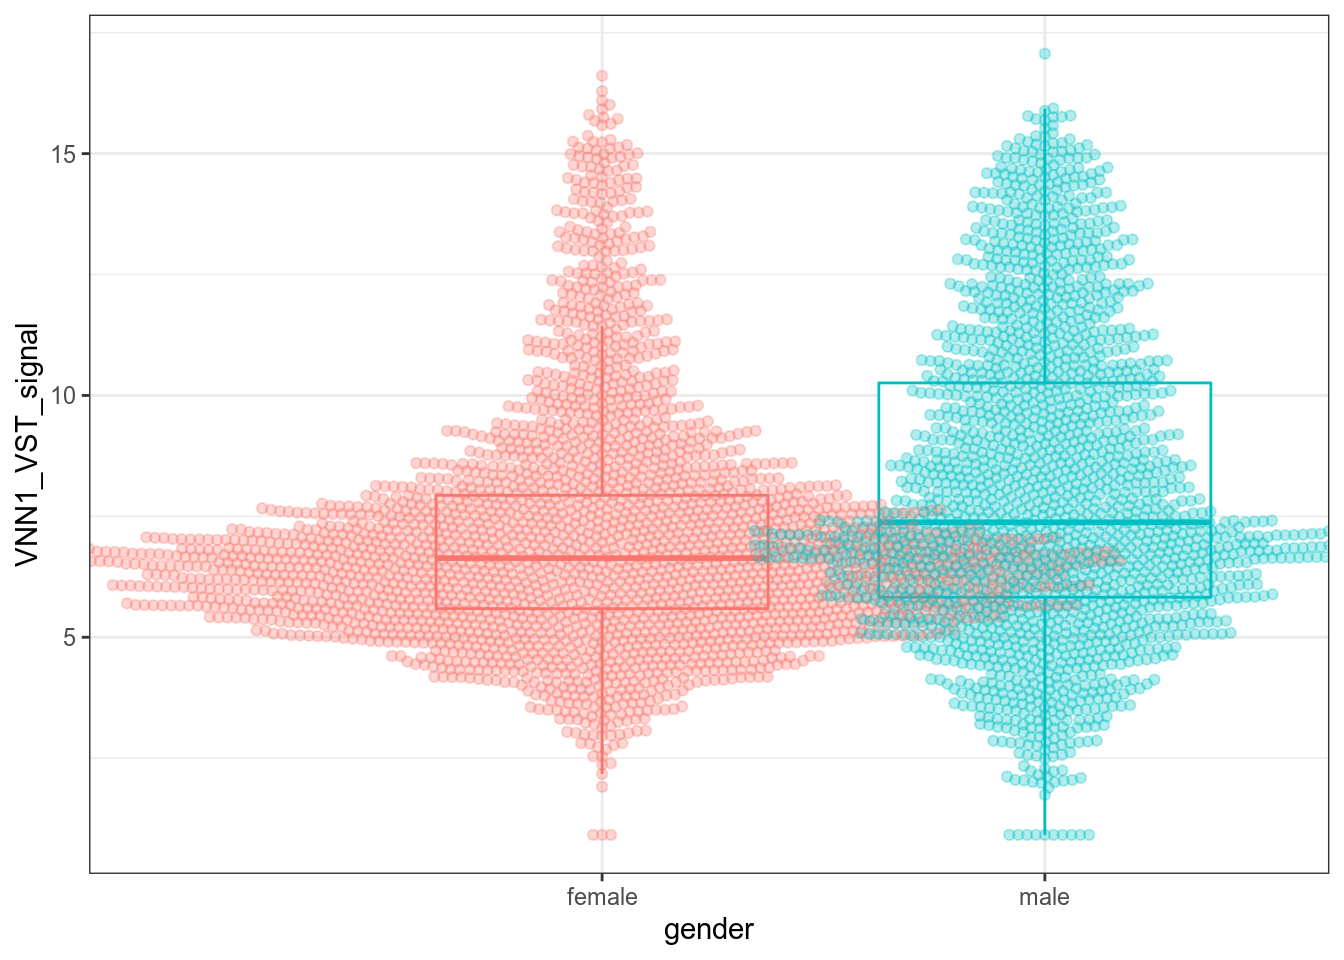
Figure 3.7: Distribution of VNN1 signal in all sarcoma subtypes from TCGA-SARC dataset as box-beeswarm-plots, splitted by gender
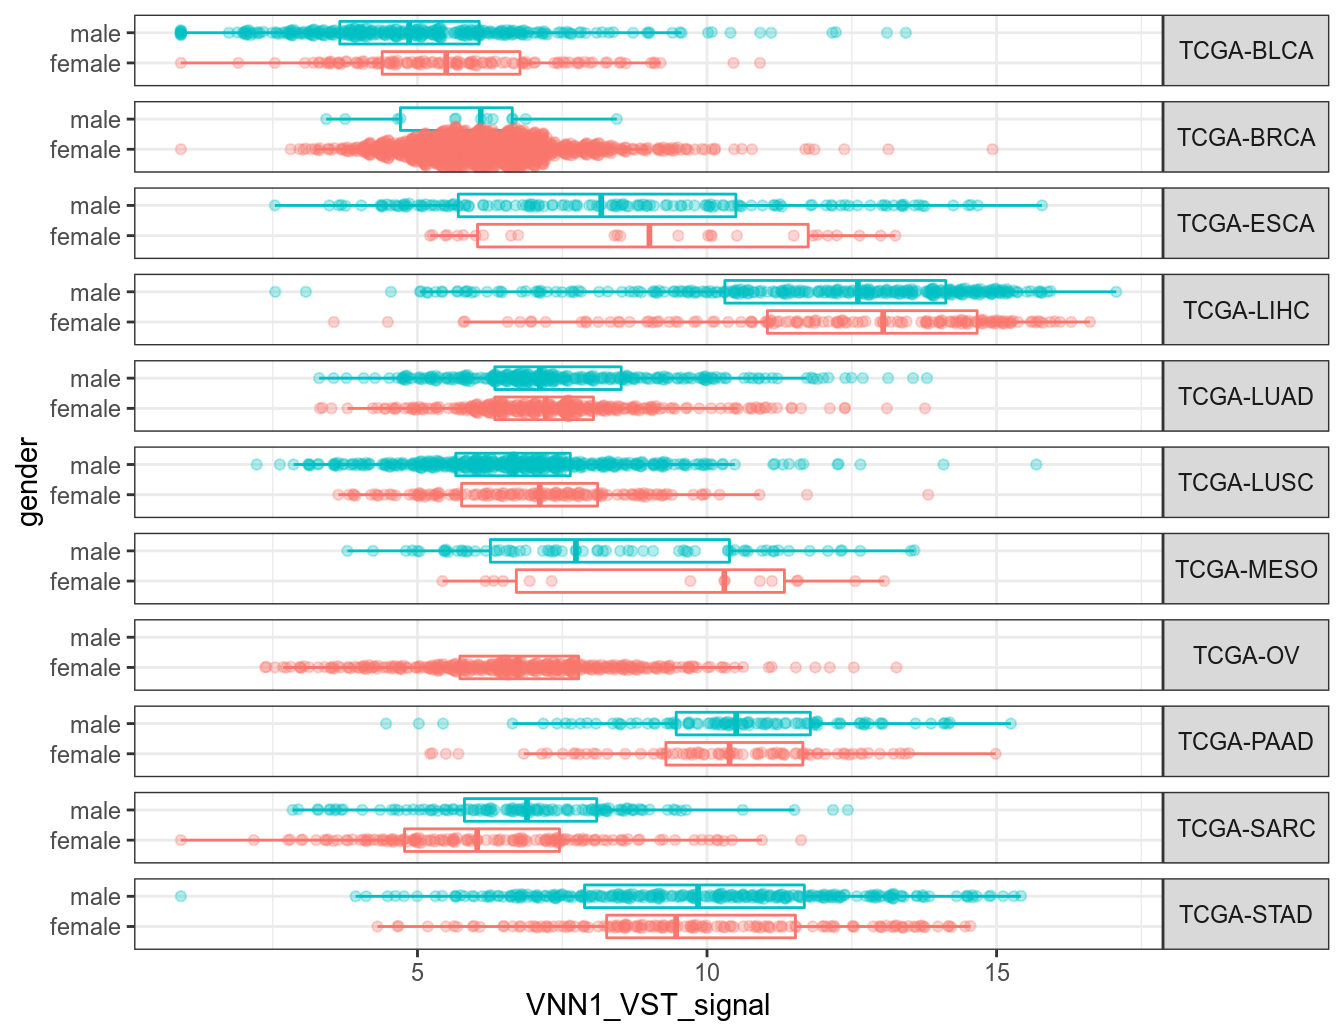
Figure 3.8: Distribution of VNN1 signal in all sarcoma subtypes from TCGA-SARC dataset as box-beeswarm-plots, splitted by gender and project_id
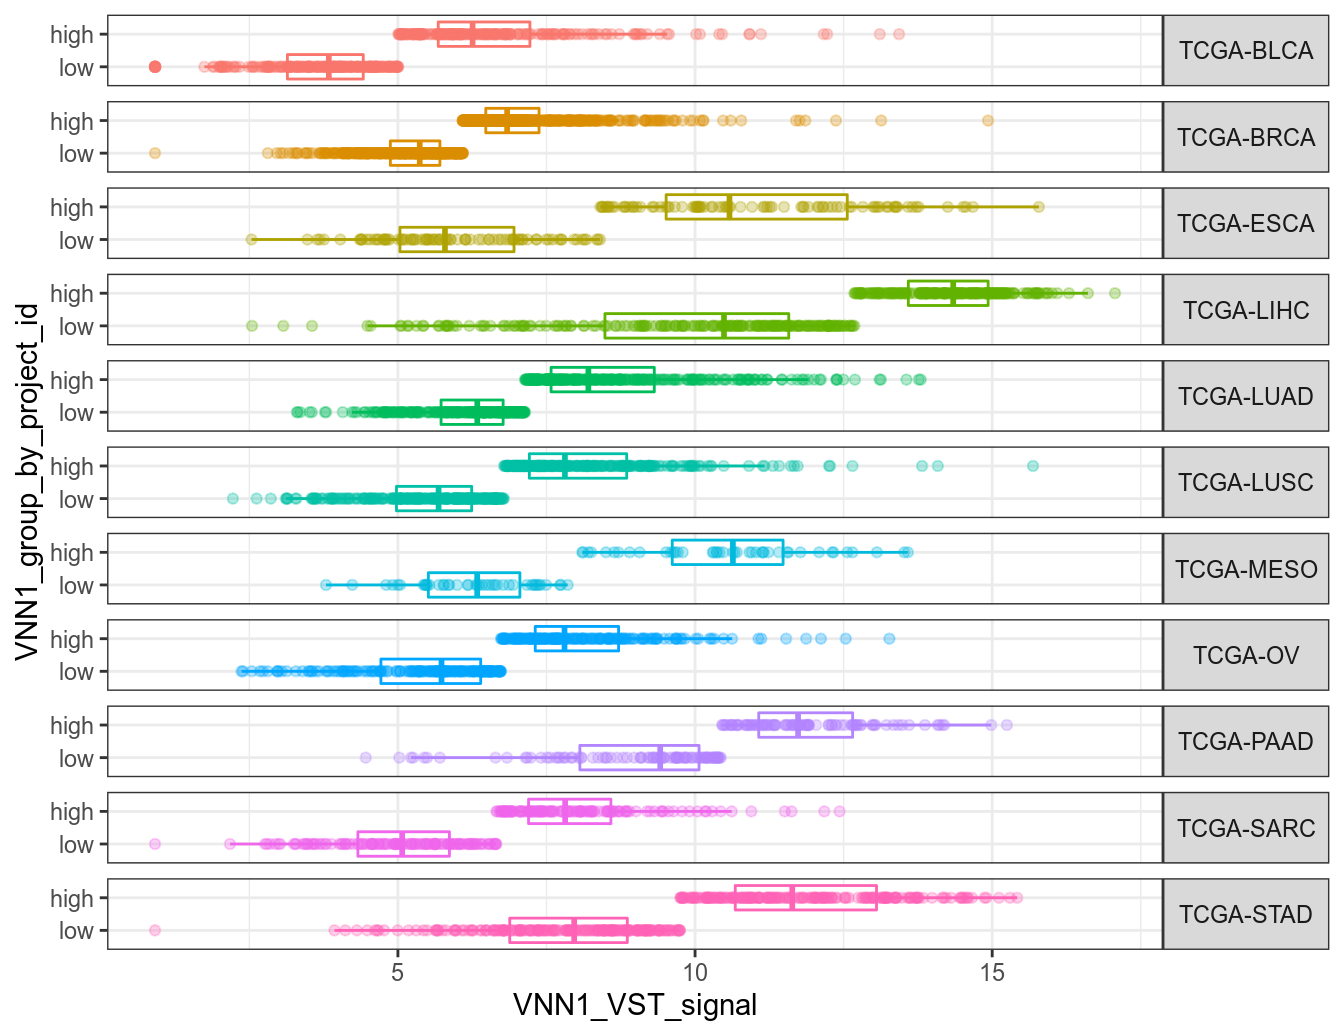
Figure 3.9: Distribution of VNN1 signal in all sarcoma subtypes from TCGA-SARC dataset. VNN1+ and VNN1- classes are called using the median VNN1 VST signal as threshold.