3.2.2.4 Fibromyxosarcoma
There are 36886 genes and 25 samples in the dataset.
At least some samples or genes look not suitable for the co-expression analysis. After removing them, there remain 36733 genes and 25 samples.
##    Power SFT.R.sq slope truncated.R.sq  mean.k. median.k. max.k.
## 1      1   0.0751 -3.28          0.955 6590.000  6.55e+03 8630.0
## 2      3   0.3950 -2.65          0.971  629.000  6.02e+02 1350.0
## 3      5   0.8560 -3.37          0.985  114.000  1.01e+02  466.0
## 4      7   0.9580 -3.10          0.992   29.900  2.36e+01  248.0
## 5      9   0.9620 -2.62          0.979   10.300  6.84e+00  159.0
## 6     11   0.9330 -2.22          0.938    4.470  2.32e+00  113.0
## 7     13   0.9280 -1.87          0.916    2.330  8.87e-01   85.3
## 8     15   0.9310 -1.62          0.912    1.410  3.71e-01   68.9
## 9     17   0.8330 -1.61          0.788    0.972  1.67e-01   66.4
## 10    19   0.3830 -2.05          0.283    0.733  8.00e-02   64.8
## 11    21   0.3980 -2.00          0.309    0.592  4.01e-02   63.7
## 12    23   0.3640 -2.31          0.287    0.504  2.08e-02   62.9
## 13    25   0.3400 -2.46          0.217    0.444  1.11e-02   62.4
## 14    27   0.3410 -2.39          0.222    0.403  6.12e-03   62.0
## 15    29   0.3640 -2.10          0.300    0.372  3.42e-03   61.7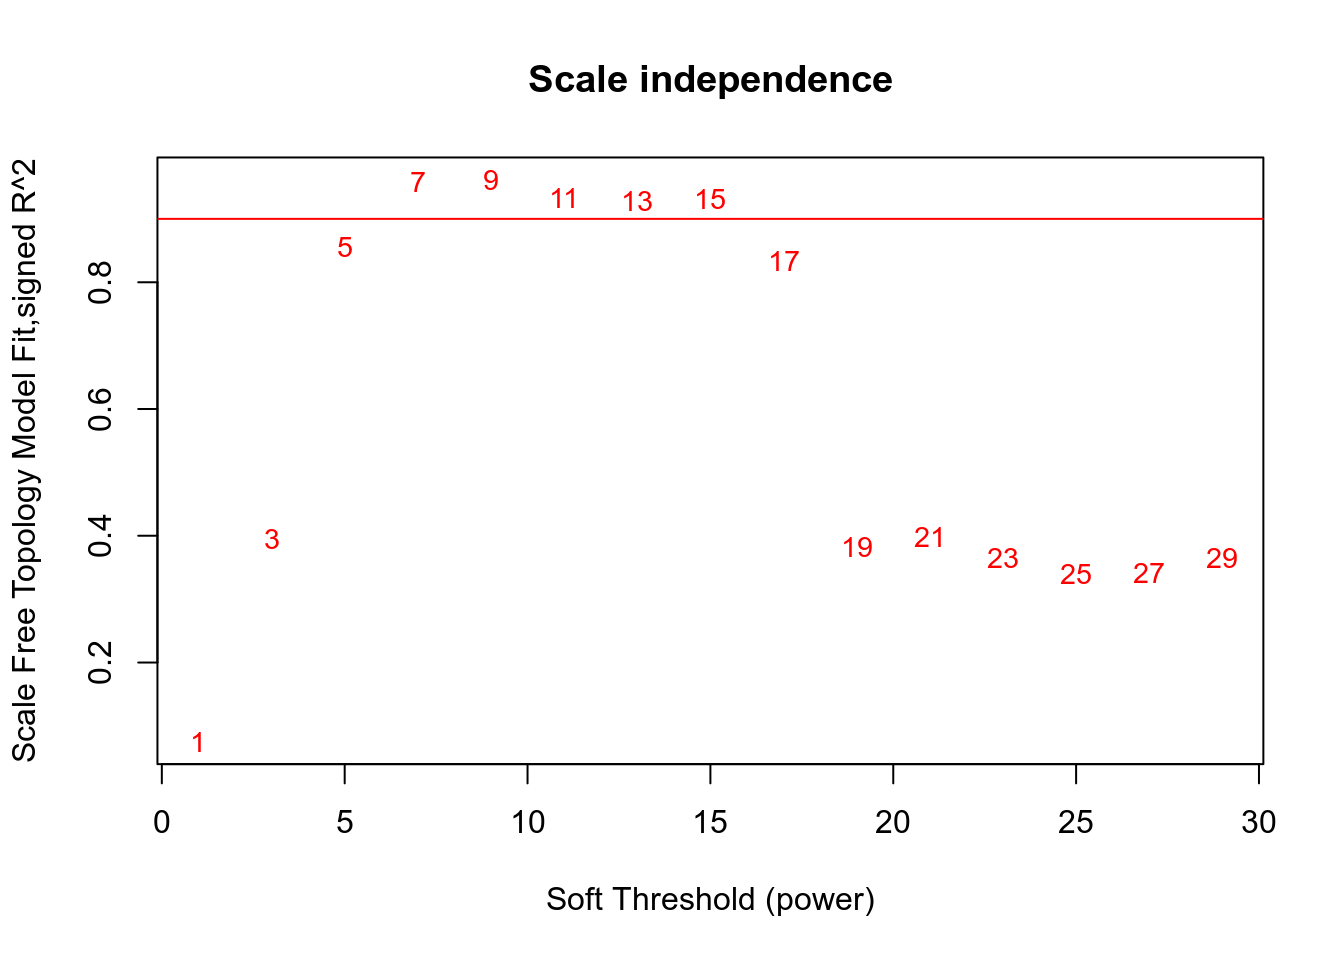
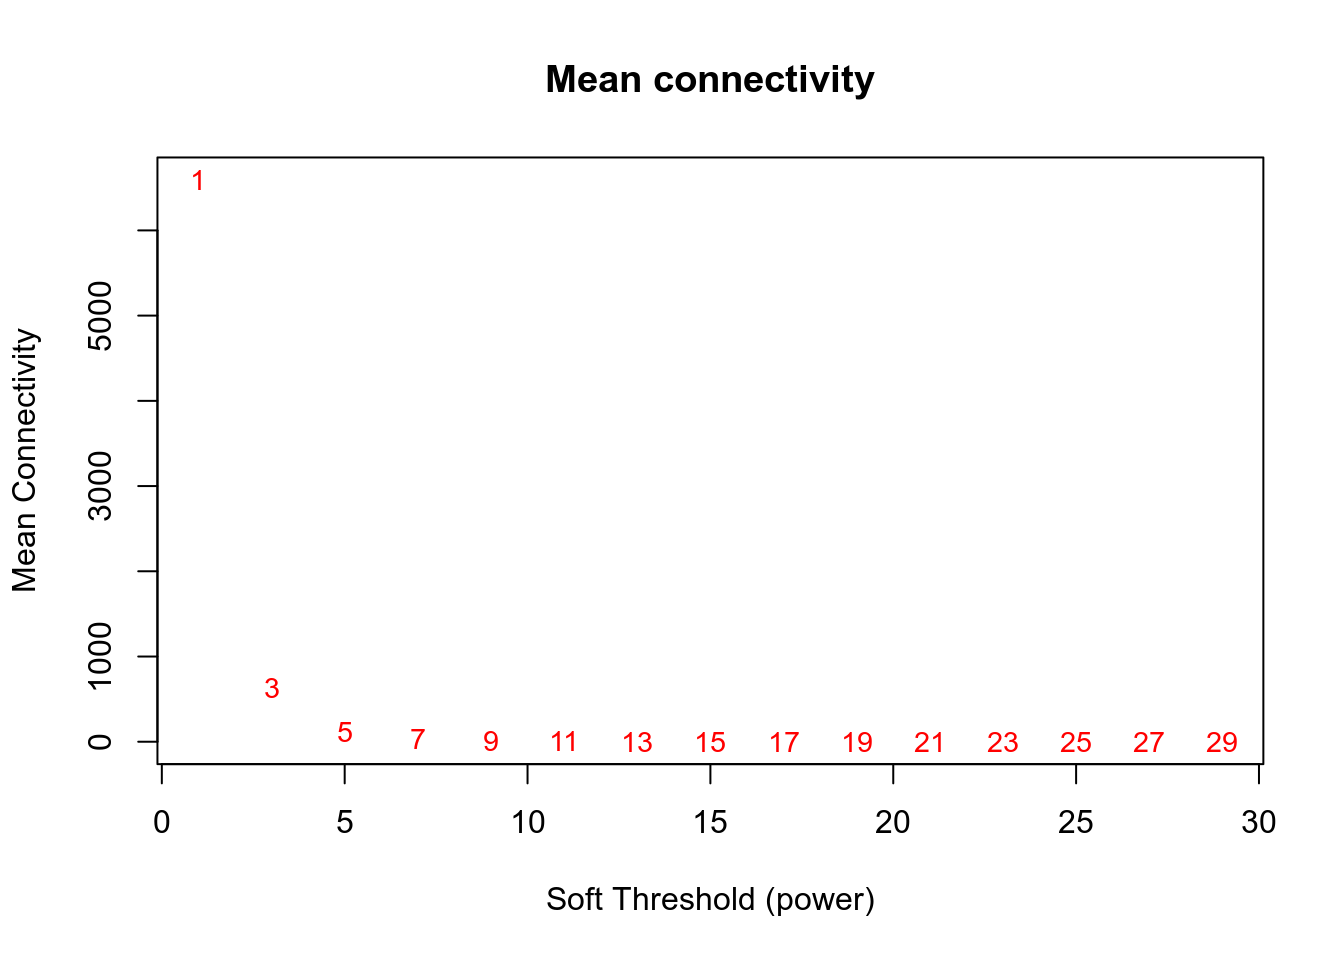
Network is computed using power=5.
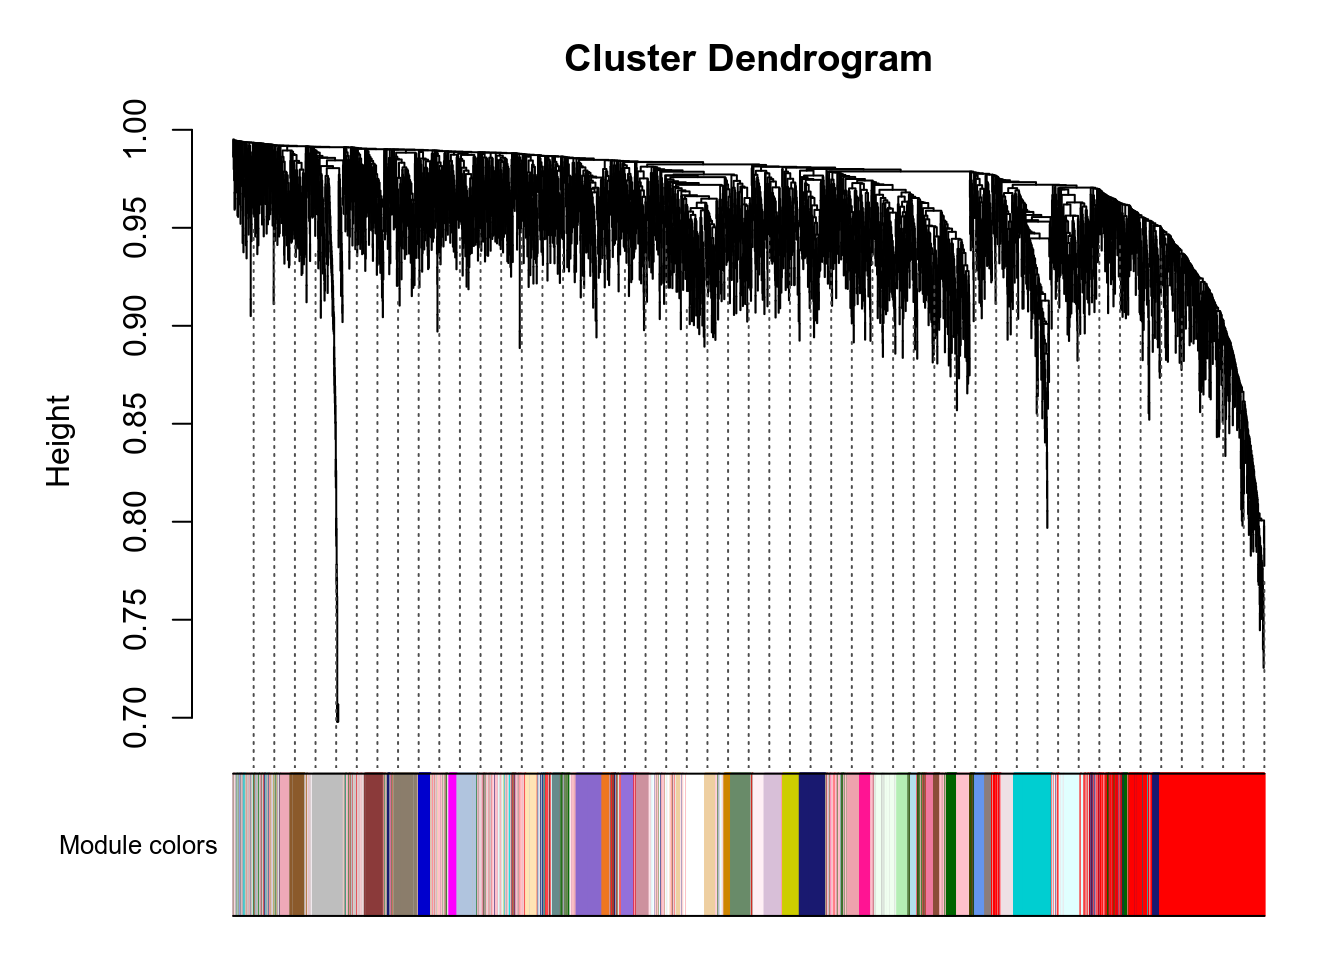
Here are the modules for a few genes of interest:
- VNN1 is in the greenyellow module.
- PPARA is in the royalblue module.
- PPARD is in the mediumorchid module.
- PPARG is in the mediumpurple3 module.
- PPARGC1A is in the grey module.
- PPARGC1B is in the grey module.
g:Profiler results for all modules are available here. Since there are many modules, you should expect at least 1 minute computation on the g:Profiler website for this query. Check below for faster queries focused on VNN1 module.
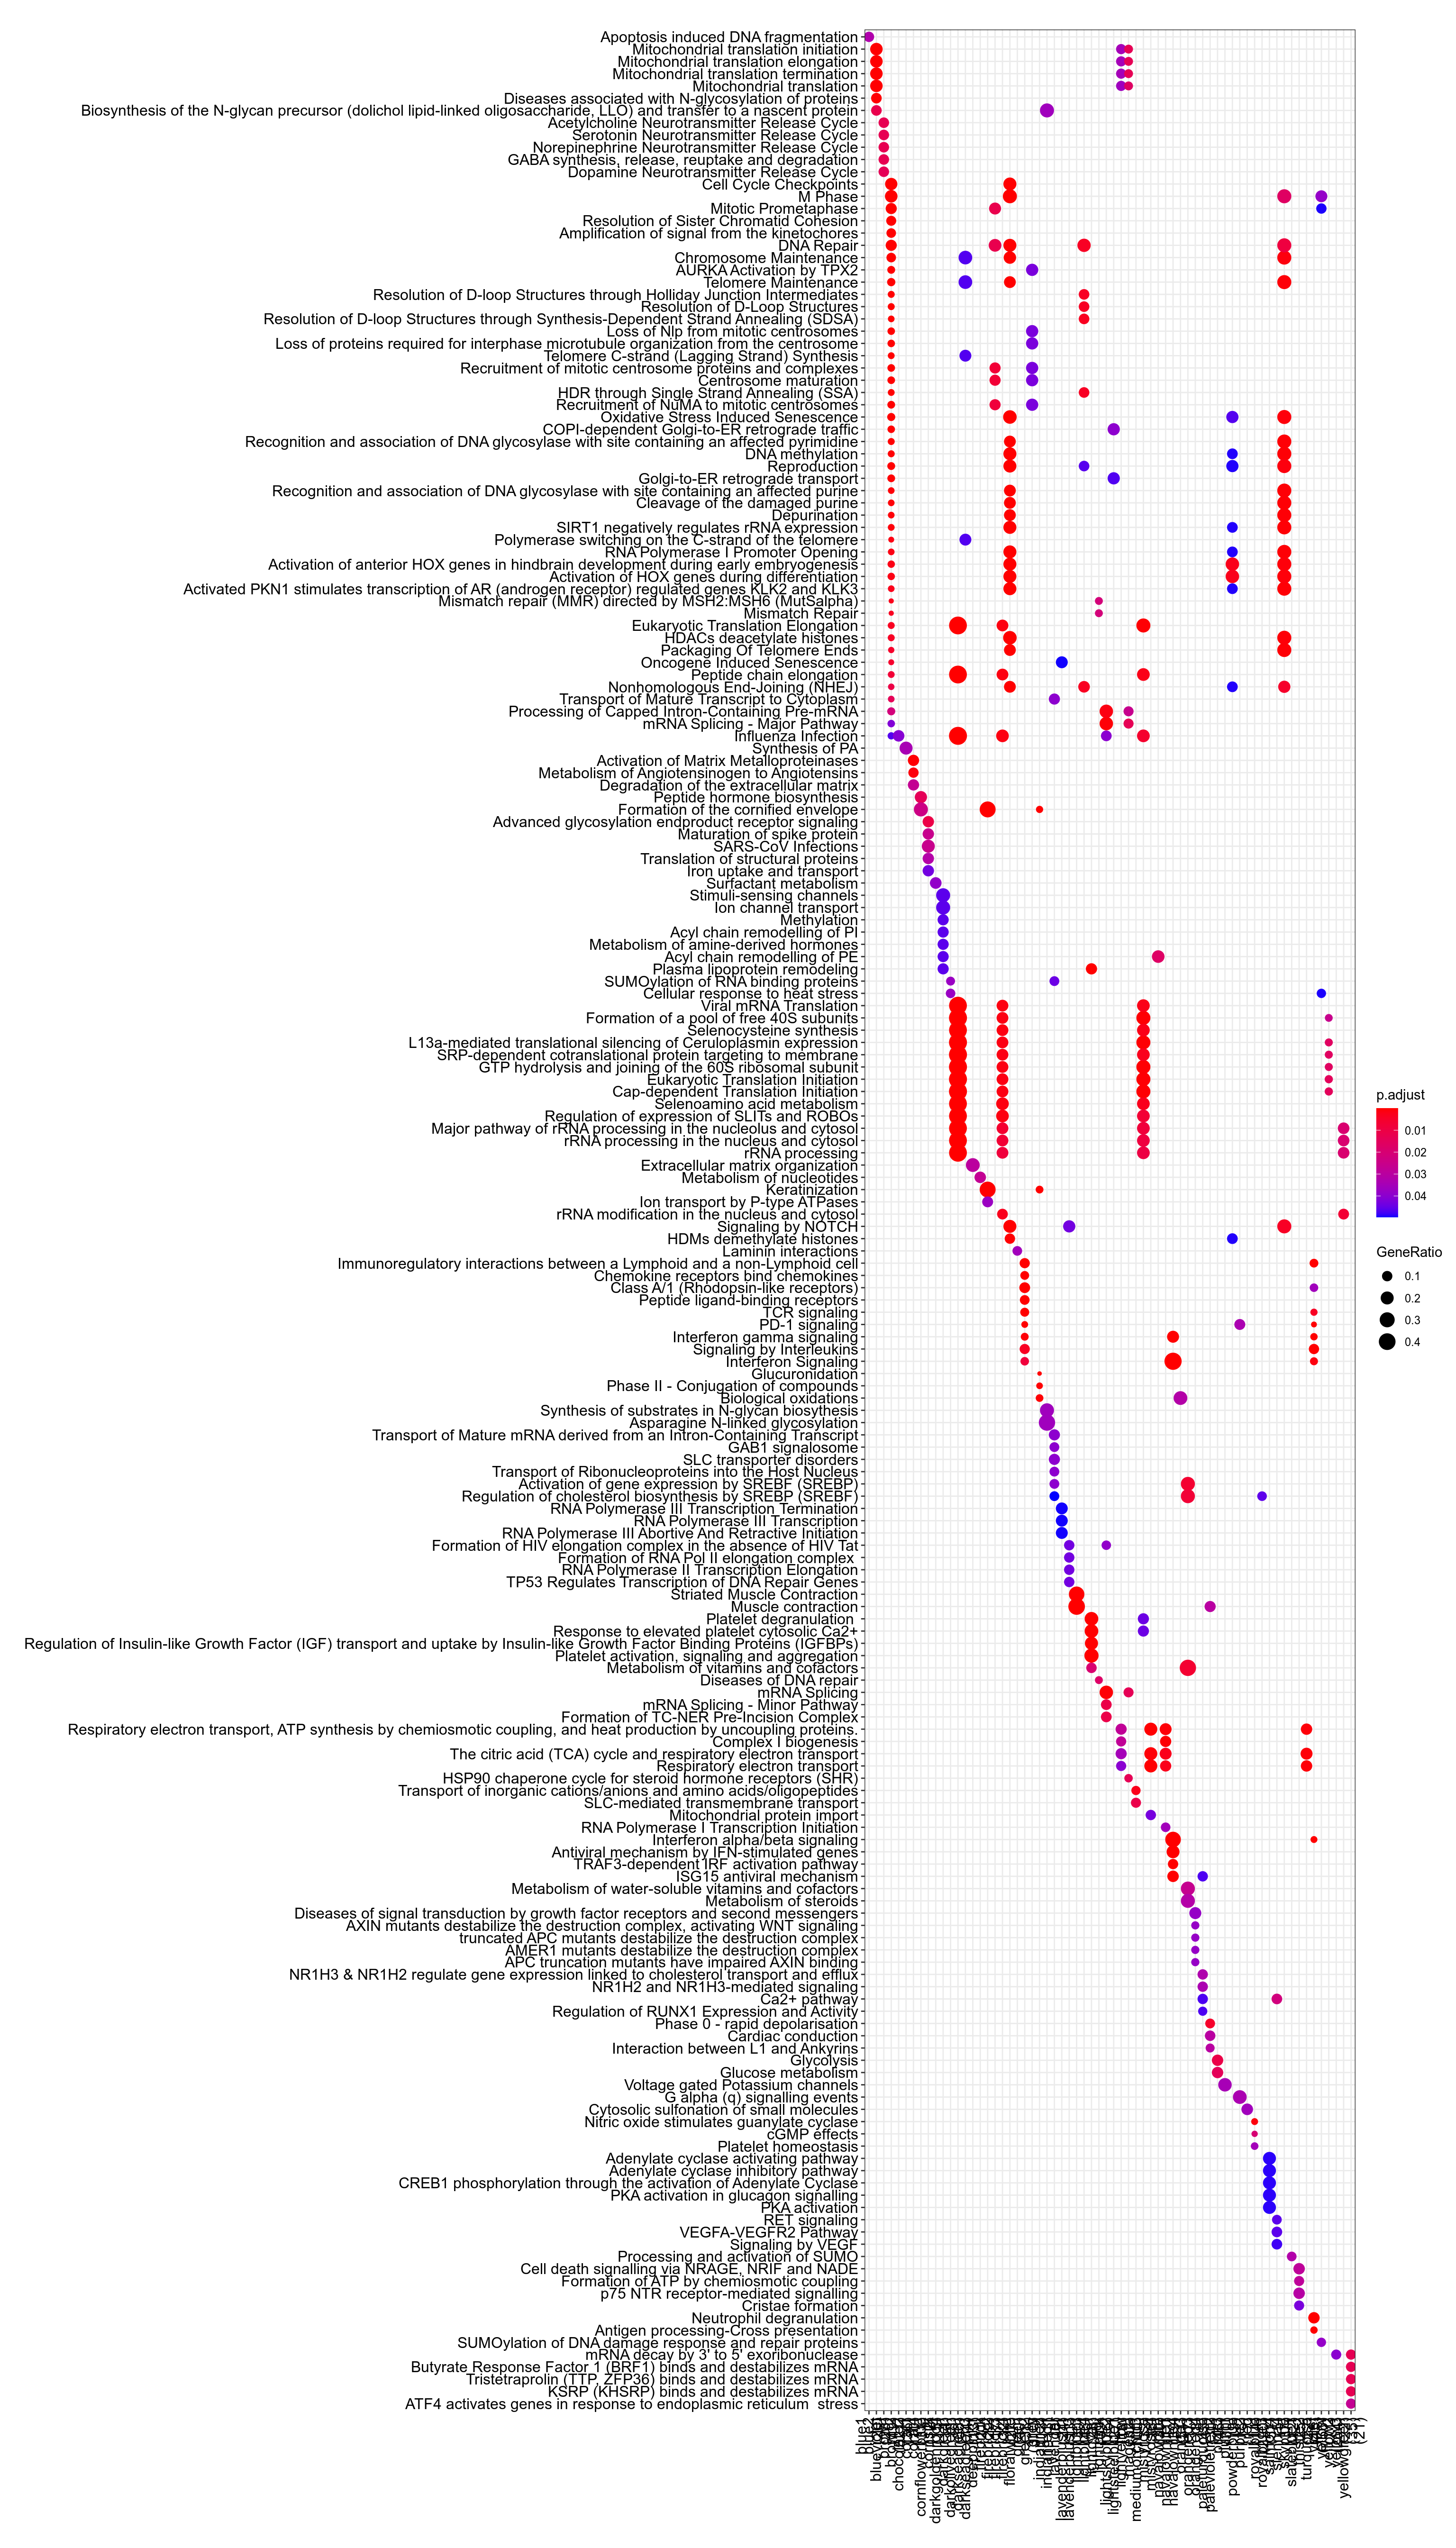
Figure 3.105: Pathway
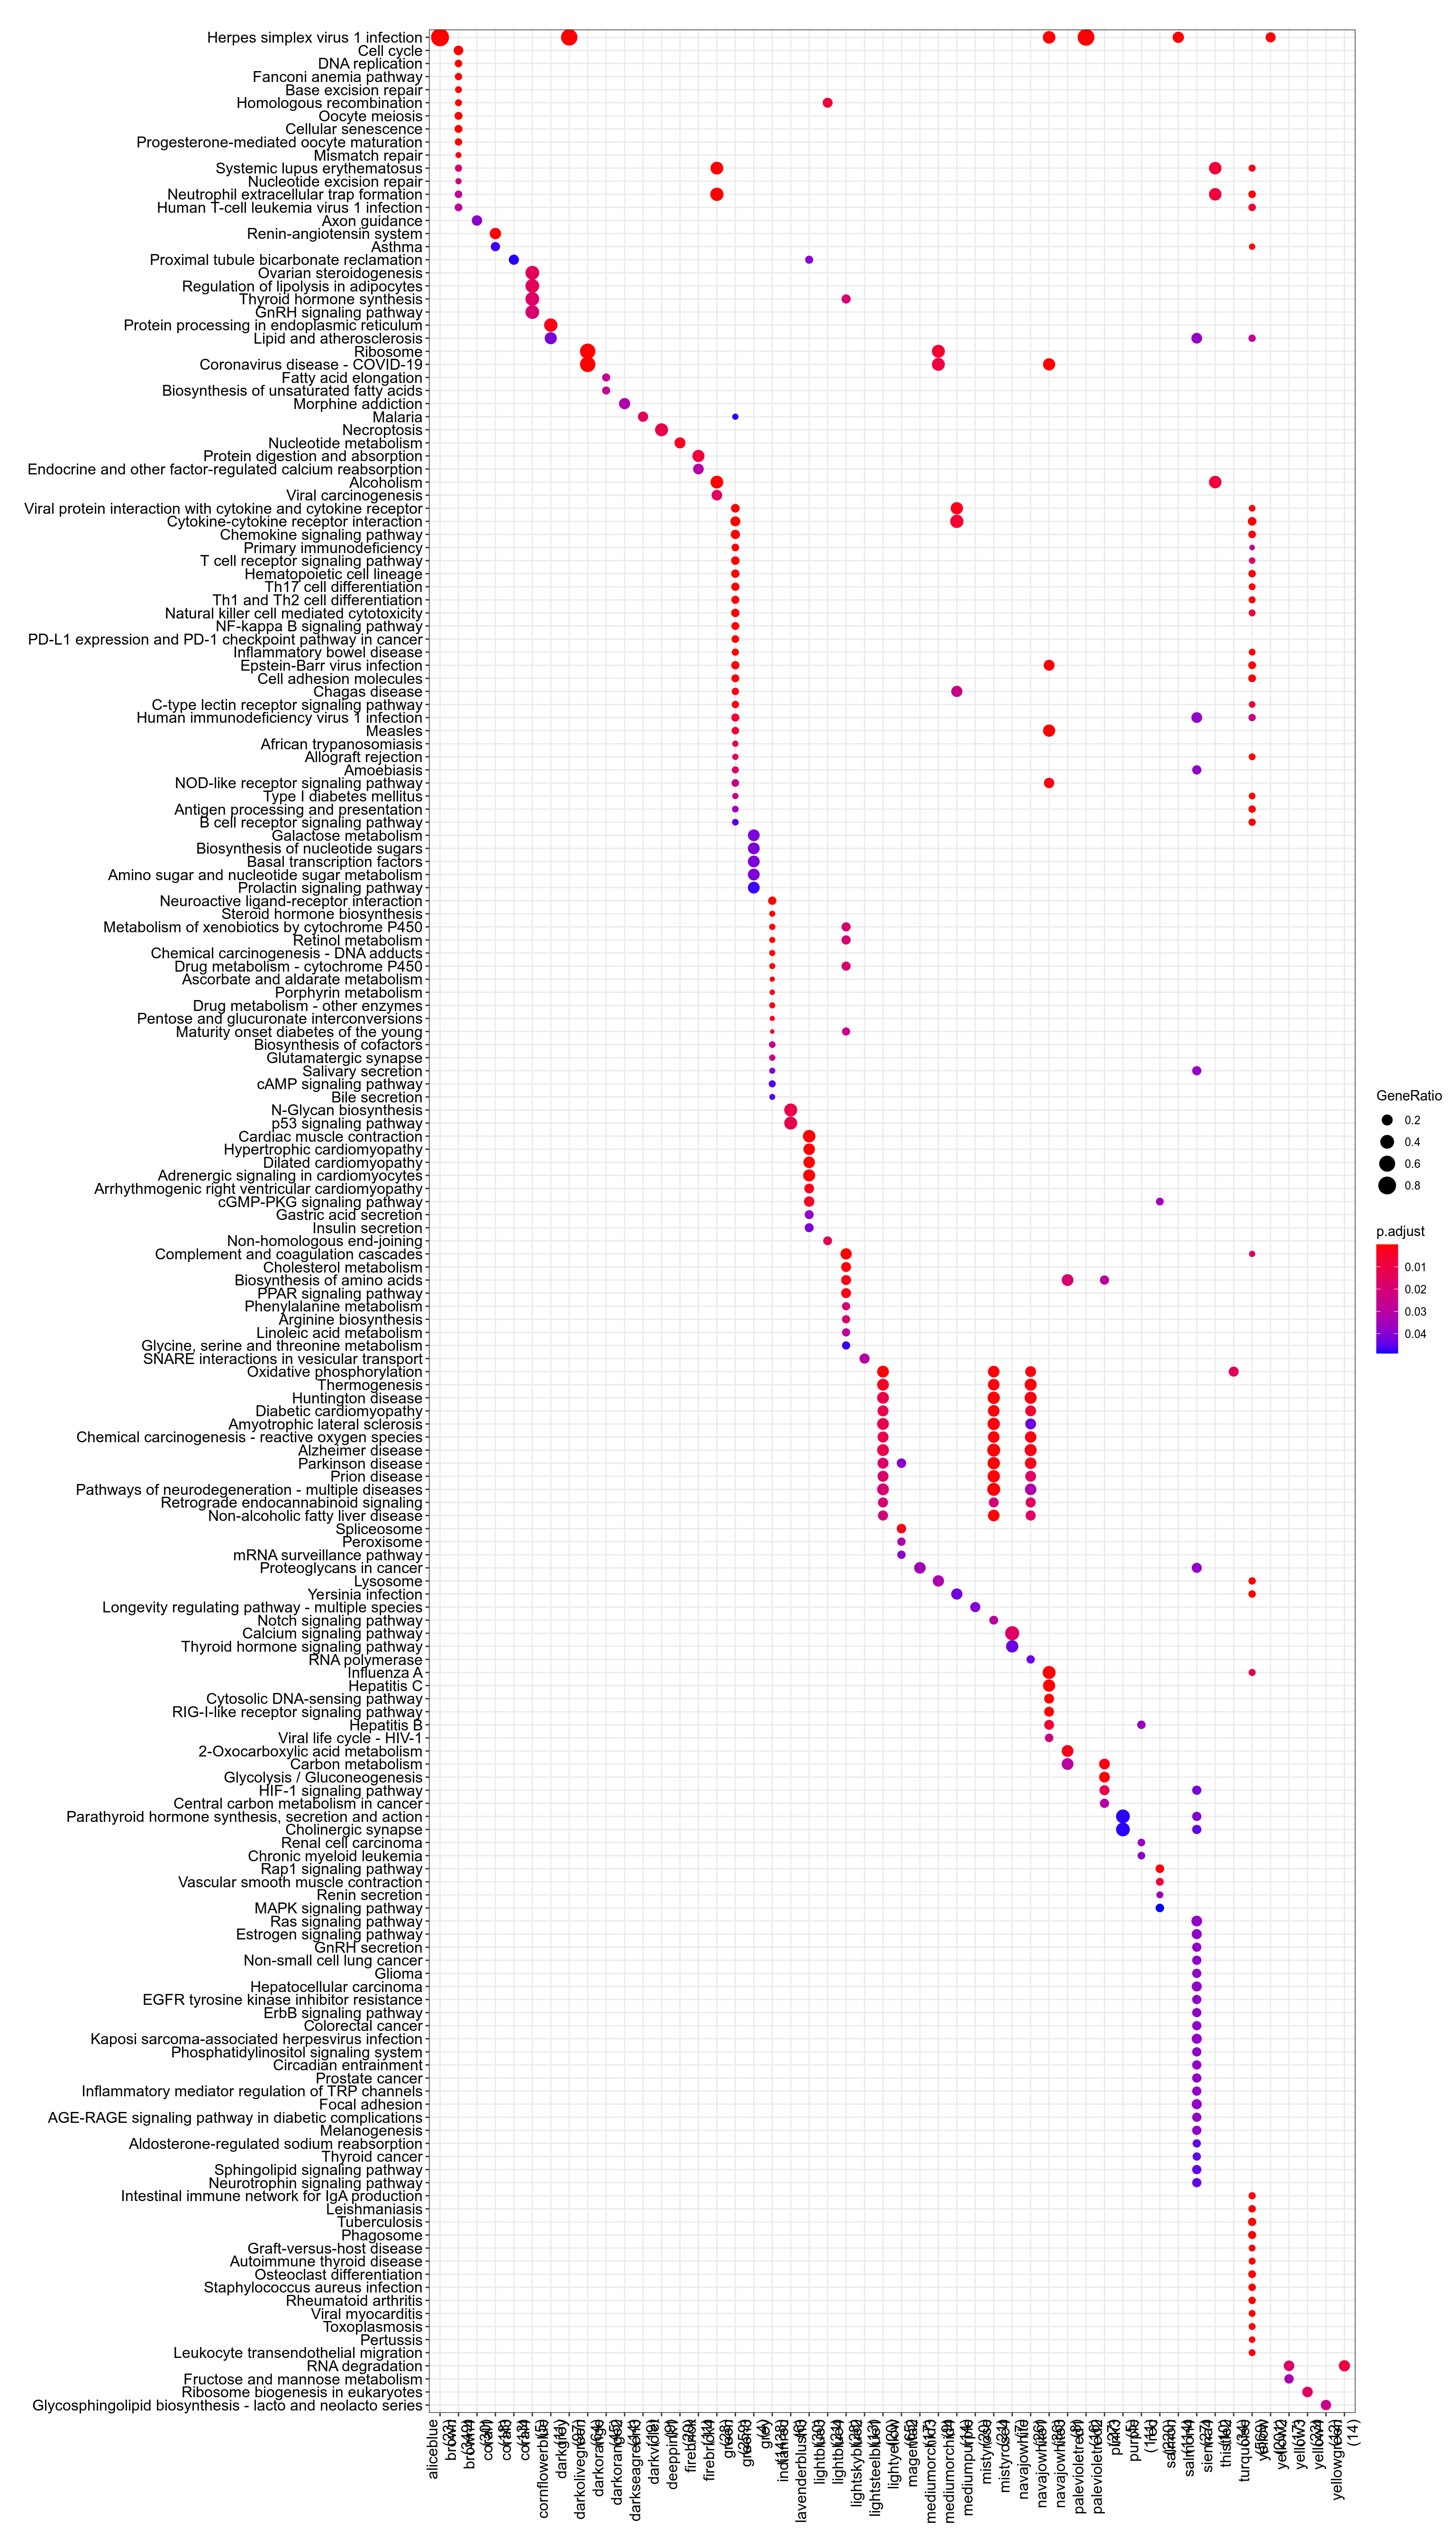
Figure 3.106: Kegg
.](_main_files/figure-html/resultsWgcnaTcgaSarcFibromyxosarcomaKnitPlotEnrichHallmarks-1.png)
Figure 3.107: MSigDb Hallmarks. readable pdf version.
## No enriched DO term in these classesTo check that module-to-genes reattribution is working as expected, heatmap of signal for VNN1 module is produced, both as absolute values and as Z-score ones.
.](../../../out/bookdown/VNN1_sarcoma/plots/resultsWgcnaTcgaSarcFibromyxosarcomaKnitPlotHeatmapVNN1ModuleAbsoluteValues.png)
Figure 3.108: log2(vst) signal in VNN1 module. Rows were gene name is prefixed with "-" display negative Z-score for these genes, meaning their signal is anticorrelated with other genes in the cluster. pdf version with readable genes and findable VNN1.
.](../../../out/bookdown/VNN1_sarcoma/plots/resultsWgcnaTcgaSarcFibromyxosarcomaKnitPlotHeatmapVNN1ModuleZscoreValues.png)
Figure 3.109: Zscore of log2(vst) signal in VNN1 module. Rows were gene name is prefixed with "-" display negative Z-score for these genes, meaning their signal is anticorrelated with other genes in the cluster. pdf version with readable genes and findable VNN1.
.](_main_files/figure-html/resultsWgcnaTcgaSarcFibromyxosarcomaKnitPlotGenesInVNN1ModuleCorPearson-1.png)
Figure 3.110: Genes in VNN1 module plotted by Pearson correlation against it. Details are available in this table.
- Enrichr results for all genes in VNN1 module are available here
- Enrichr results for genes in VNN1 module and positively correlated with it are available here
- Enrichr results for genes in VNN1 module and negatively correlated with it are available here
- g:Profiler results for all genes in VNN1 module are available here
- g:Profiler results for genes in VNN1 module and positively correlated with it are available here
- g:Profiler results for genes in VNN1 module and negatively correlated with it are available here
- g:Profiler results for comparison of the three queries above are available here