3.2.4.3 Pathway
The xlsx table for the qvalues of all significant Pathway gene sets is available here.
3.2.4.3.1 Alphabetically-ordered Pathway and all datasets

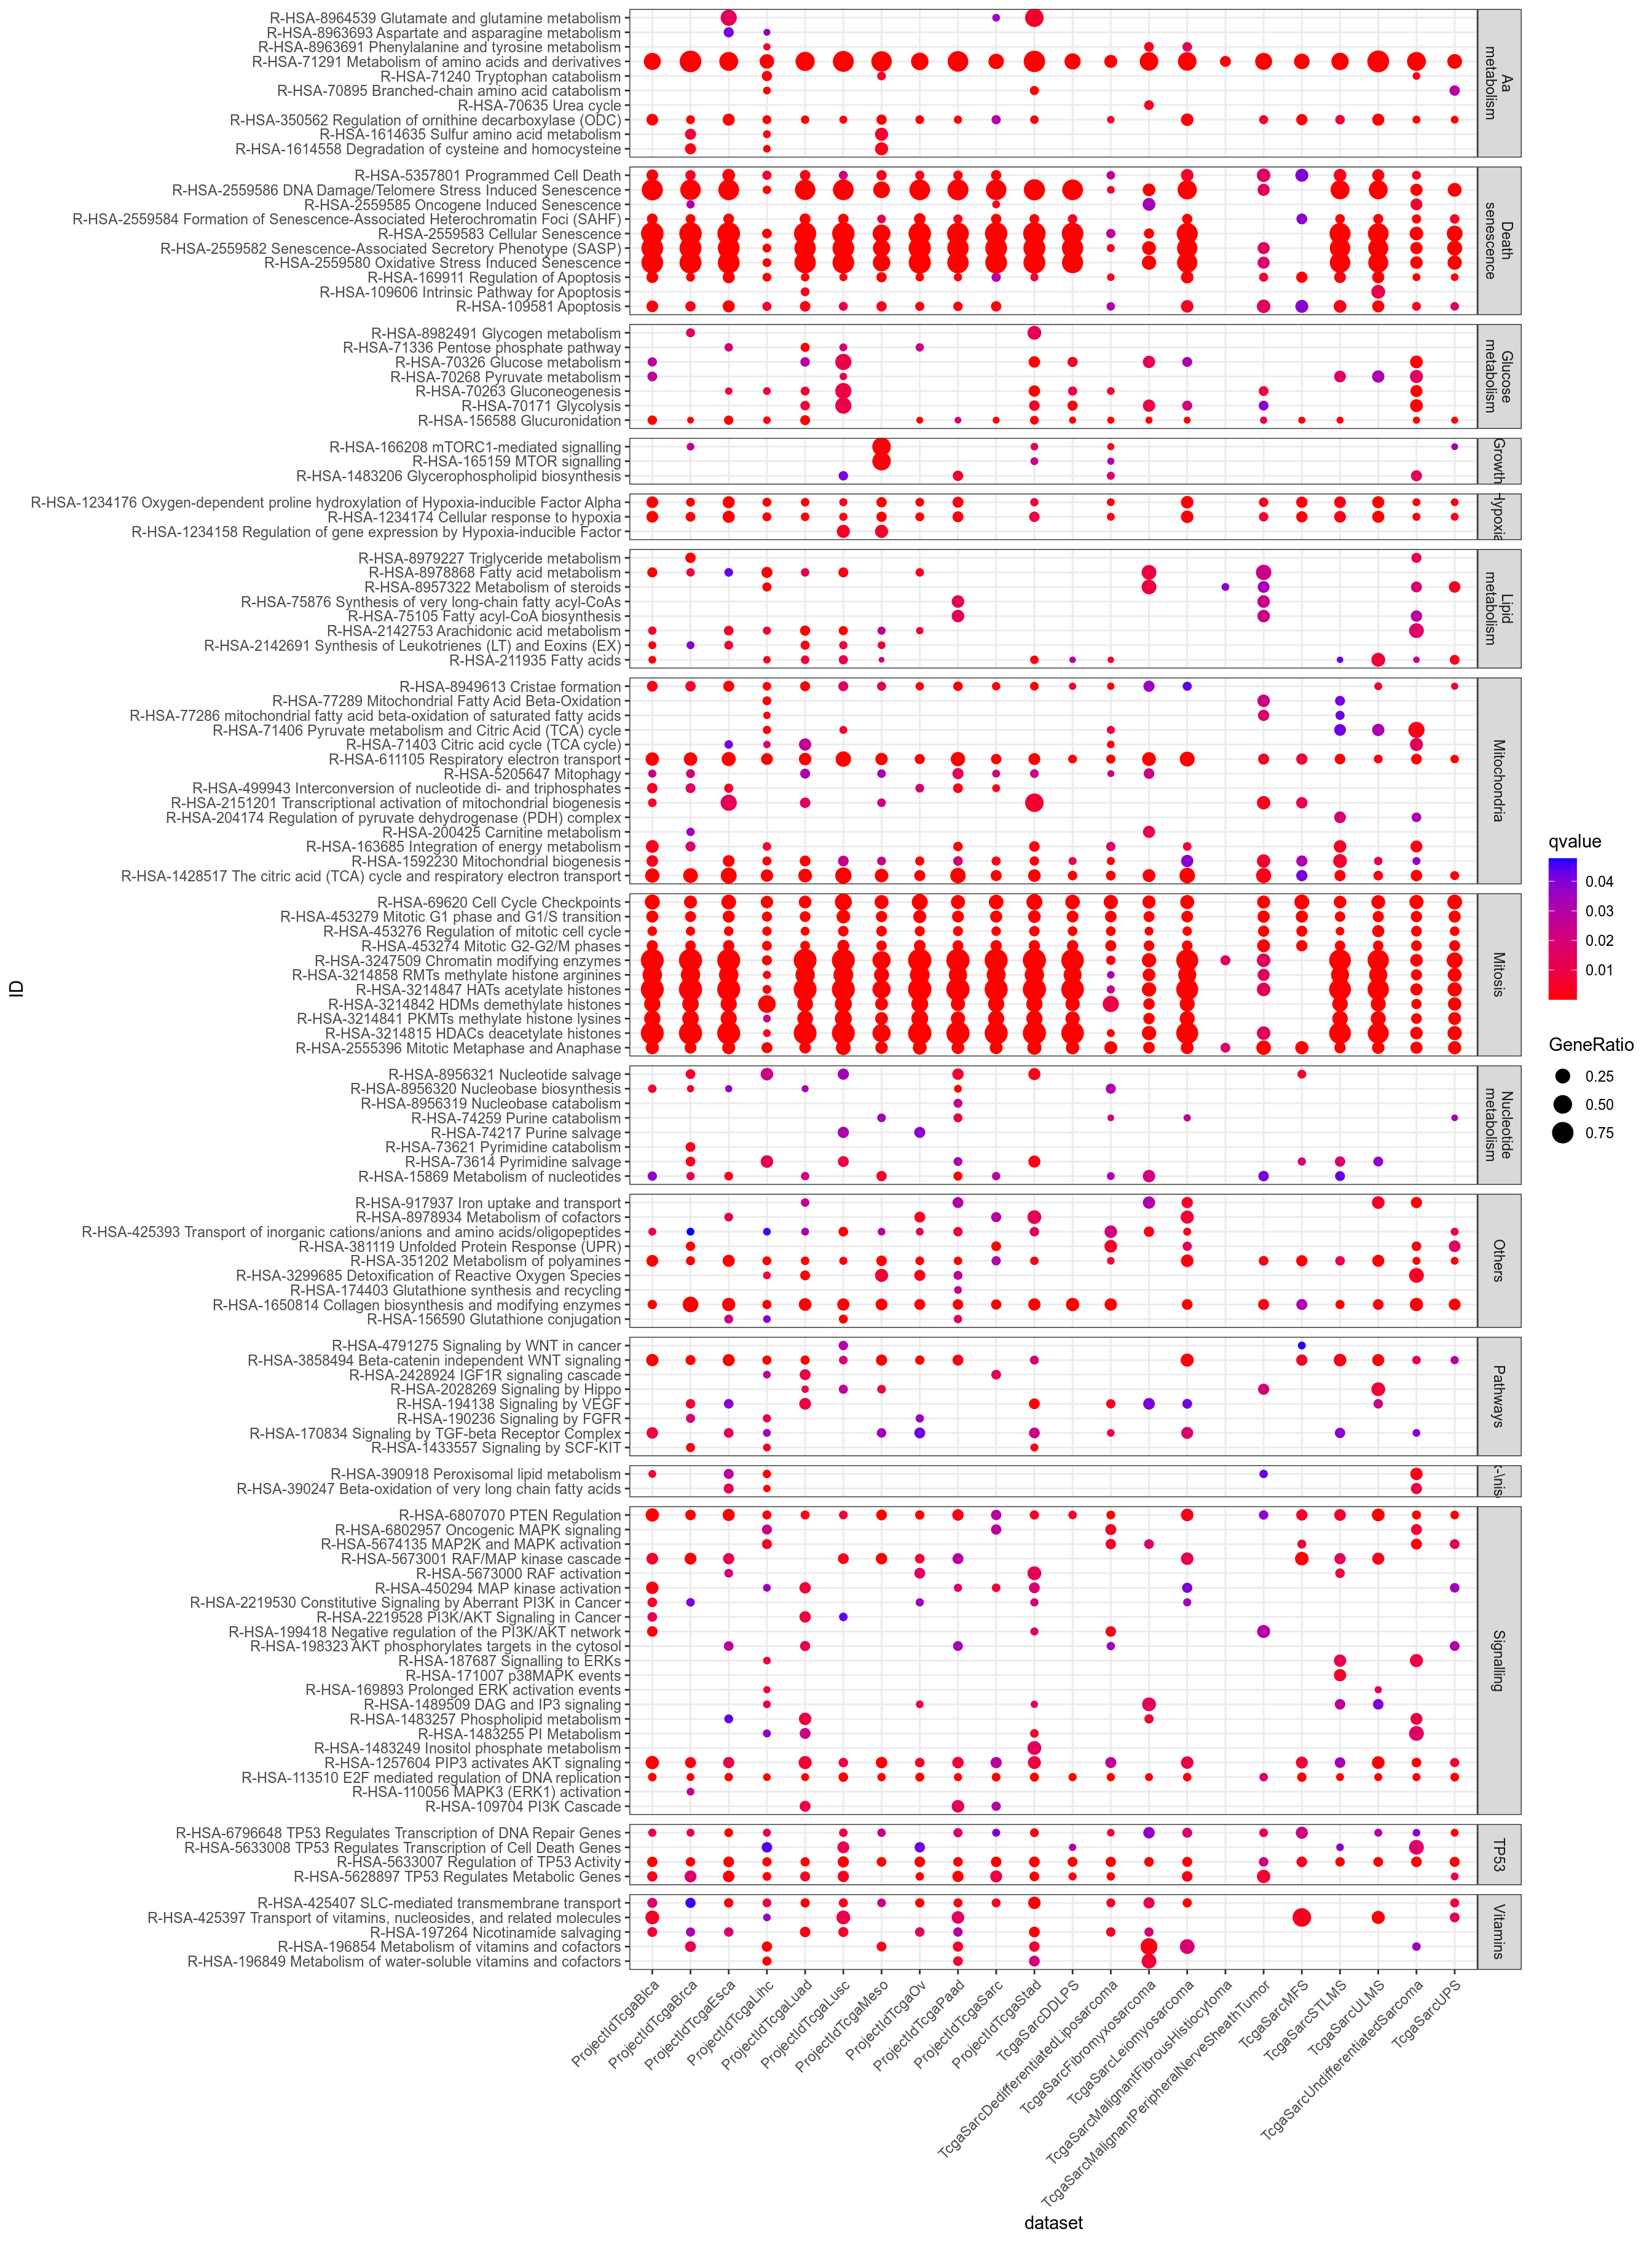
Figure 3.167: Dotplot for Pathway significant (q-value < 0.05) in at least one dataset.

Figure 3.168: Dotplot for Pathway which are significant (q-value < 0.05) in at least one dataset and non ubiquitous, i.e. not significant for all datasets.

Figure 3.169: Dotplot for Pathway which are significant (q-value < 0.05) in at least one dataset, and uncommon, i.e. significant in less than half the datasets.

Figure 3.170: Dotplot for Pathway of interest (provided by Philipe Naquet).
3.2.4.3.2 Occurency-ordered Pathway and all datasets

Figure 3.171: Dotplot for Pathway significant (q-value < 0.05) in at least one dataset.

Figure 3.172: Dotplot for Pathway which are significant (q-value < 0.05) in at least one dataset and non ubiquitous, i.e. not significant for all datasets.

Figure 3.173: Dotplot for Pathway which are significant (q-value < 0.05) in at least one dataset, and uncommon, i.e. significant in less than half the datasets.

Figure 3.174: Dotplot for Pathway of interest (provided by Philipe Naquet).
3.2.4.3.3 Log10 transformed color scale

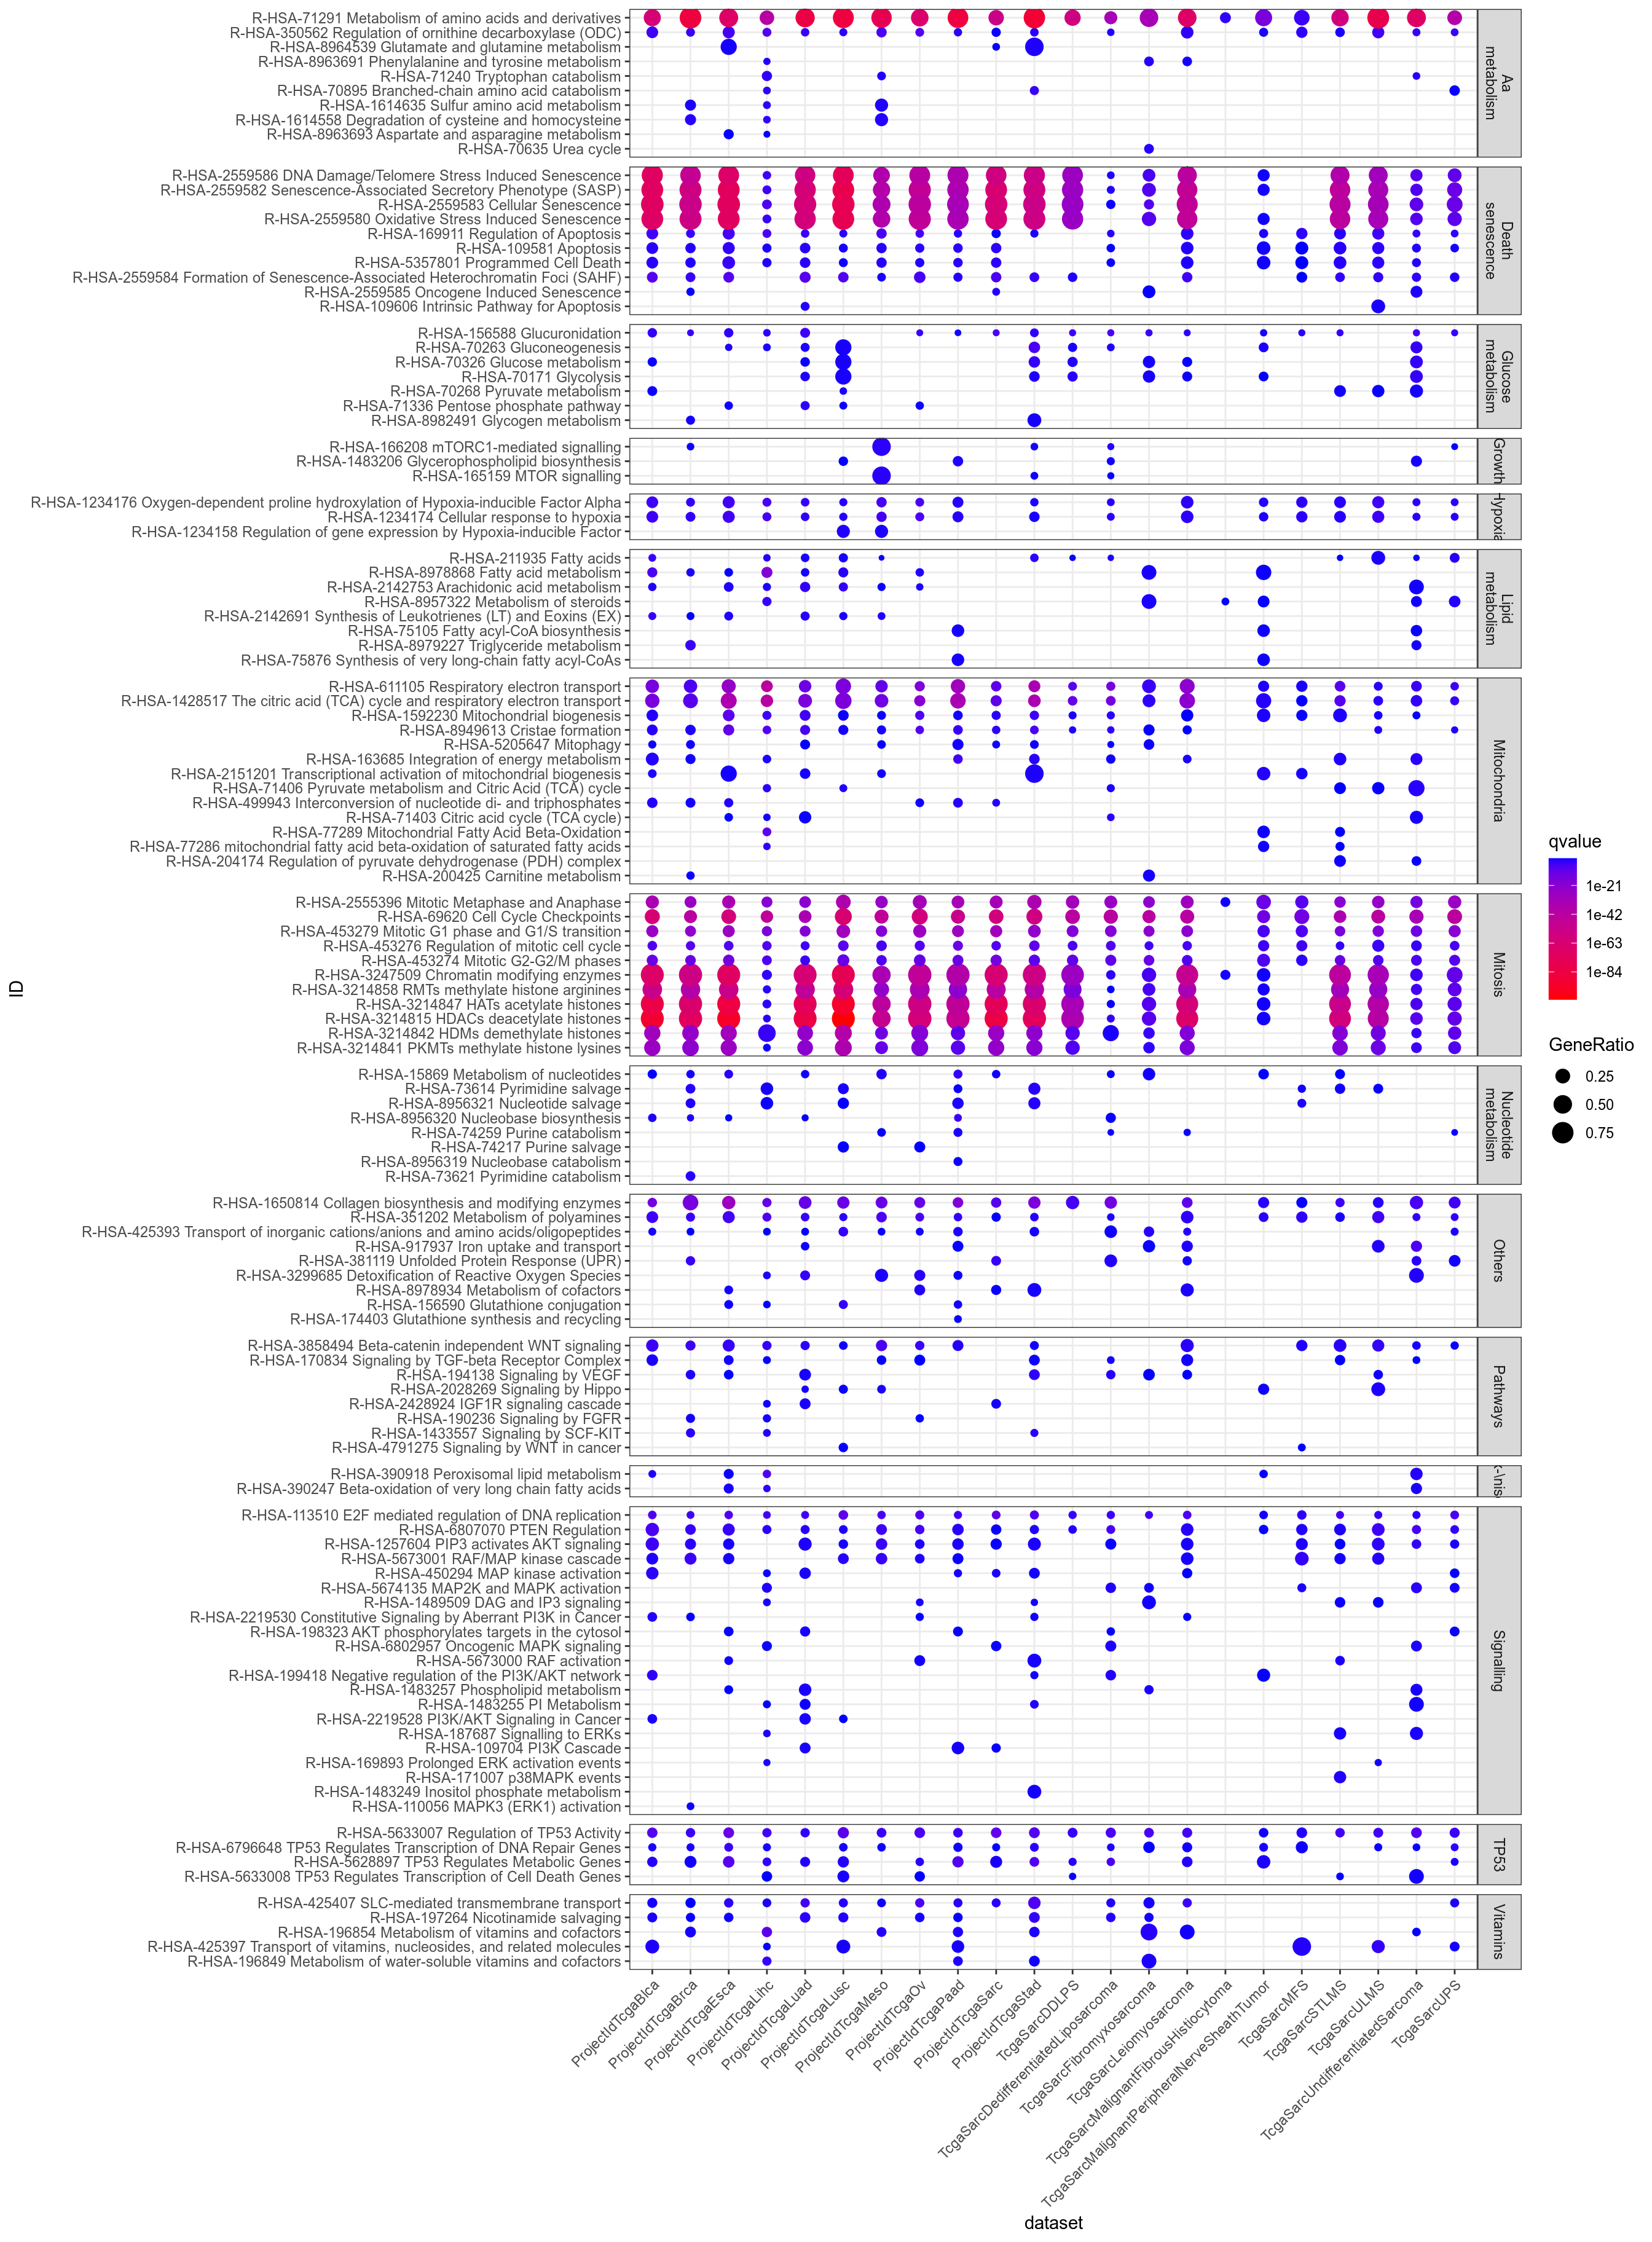
Figure 3.175: Dotplot for Pathway significant (q-value < 0.05) in at least one dataset.

Figure 3.176: Dotplot for Pathway which are significant (q-value < 0.05) in at least one dataset and non ubiquitous, i.e. not significant for all datasets.

Figure 3.177: Dotplot for Pathway which are significant (q-value < 0.05) in at least one dataset, and uncommon, i.e. significant in less than half the datasets.

Figure 3.178: Dotplot for Pathway of interest (provided by Philipe Naquet).