3.2.3.5 MFS
There are 36886 genes and 17 samples in the dataset.
At least some samples or genes look not suitable for the co-expression analysis. After removing them, there remain 36461 genes and 17 samples.
##    Power SFT.R.sq slope truncated.R.sq mean.k. median.k. max.k.
## 1      1    0.104 -2.85          0.930 7980.00  7.88e+03  10700
## 2      3    0.496 -2.84          0.968 1080.00  1.02e+03   2380
## 3      5    0.724 -3.13          0.970  262.00  2.30e+02    880
## 4      7    0.859 -2.46          0.878   88.00  7.05e+01    409
## 5      9    0.424 -4.37          0.314   37.00  2.63e+01    321
## 6     11    0.433 -4.78          0.313   18.70  1.12e+01    287
## 7     13    0.441 -4.21          0.321   10.90  5.30e+00    268
## 8     15    0.436 -3.75          0.318    7.30  2.71e+00    257
## 9     17    0.388 -3.18          0.215    5.41  1.47e+00    249
## 10    19    0.387 -2.94          0.215    4.36  8.38e-01    244
## 11    21    0.362 -3.02          0.181    3.74  4.99e-01    241
## 12    23    0.357 -2.86          0.177    3.34  3.07e-01    238
## 13    25    0.351 -2.73          0.171    3.08  1.95e-01    236
## 14    27    0.336 -2.80          0.146    2.90  1.27e-01    235
## 15    29    0.342 -2.75          0.155    2.78  8.41e-02    233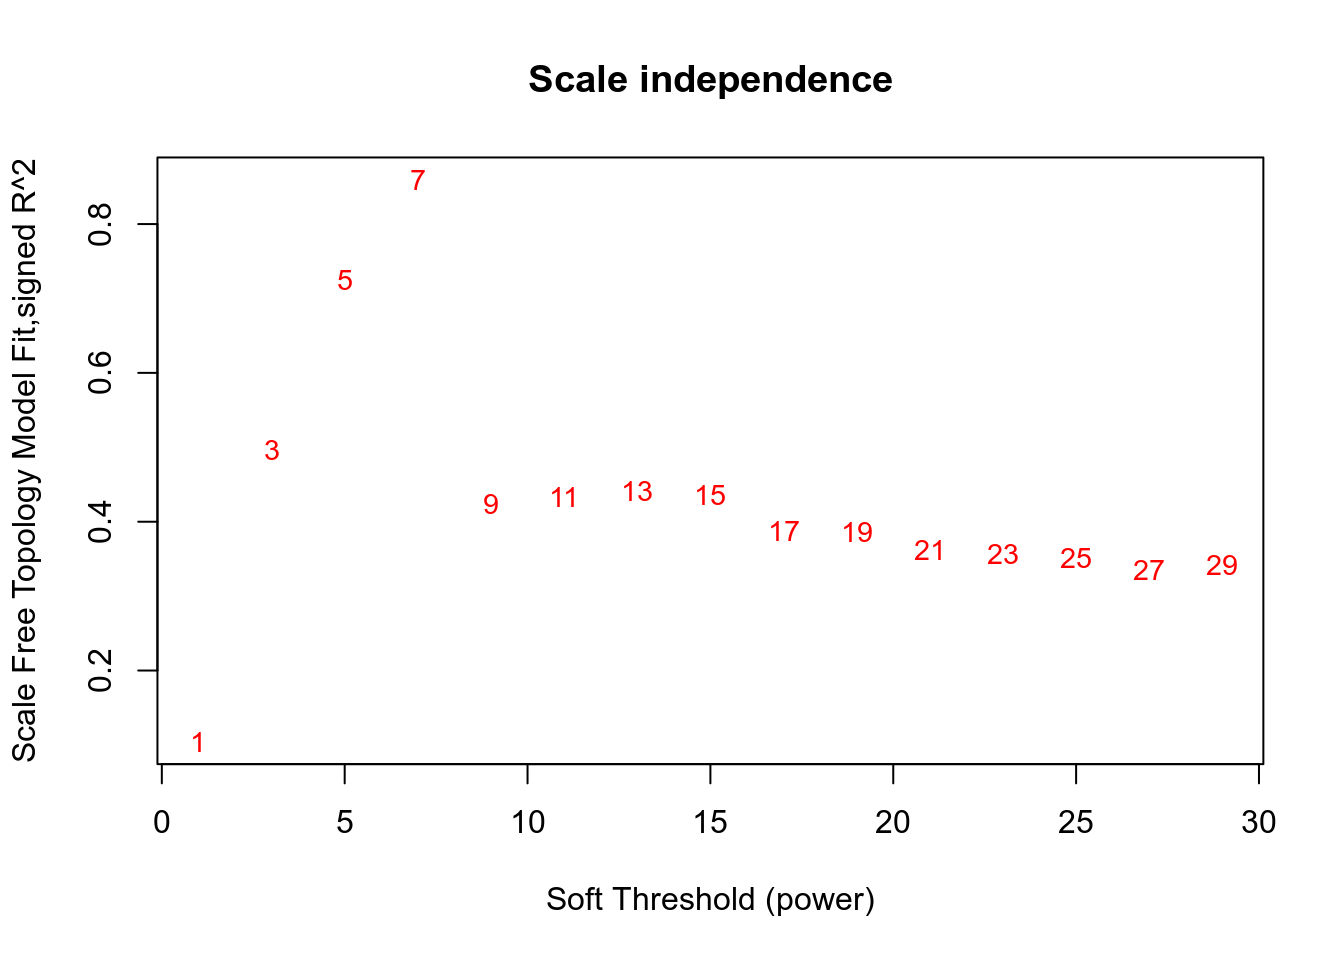
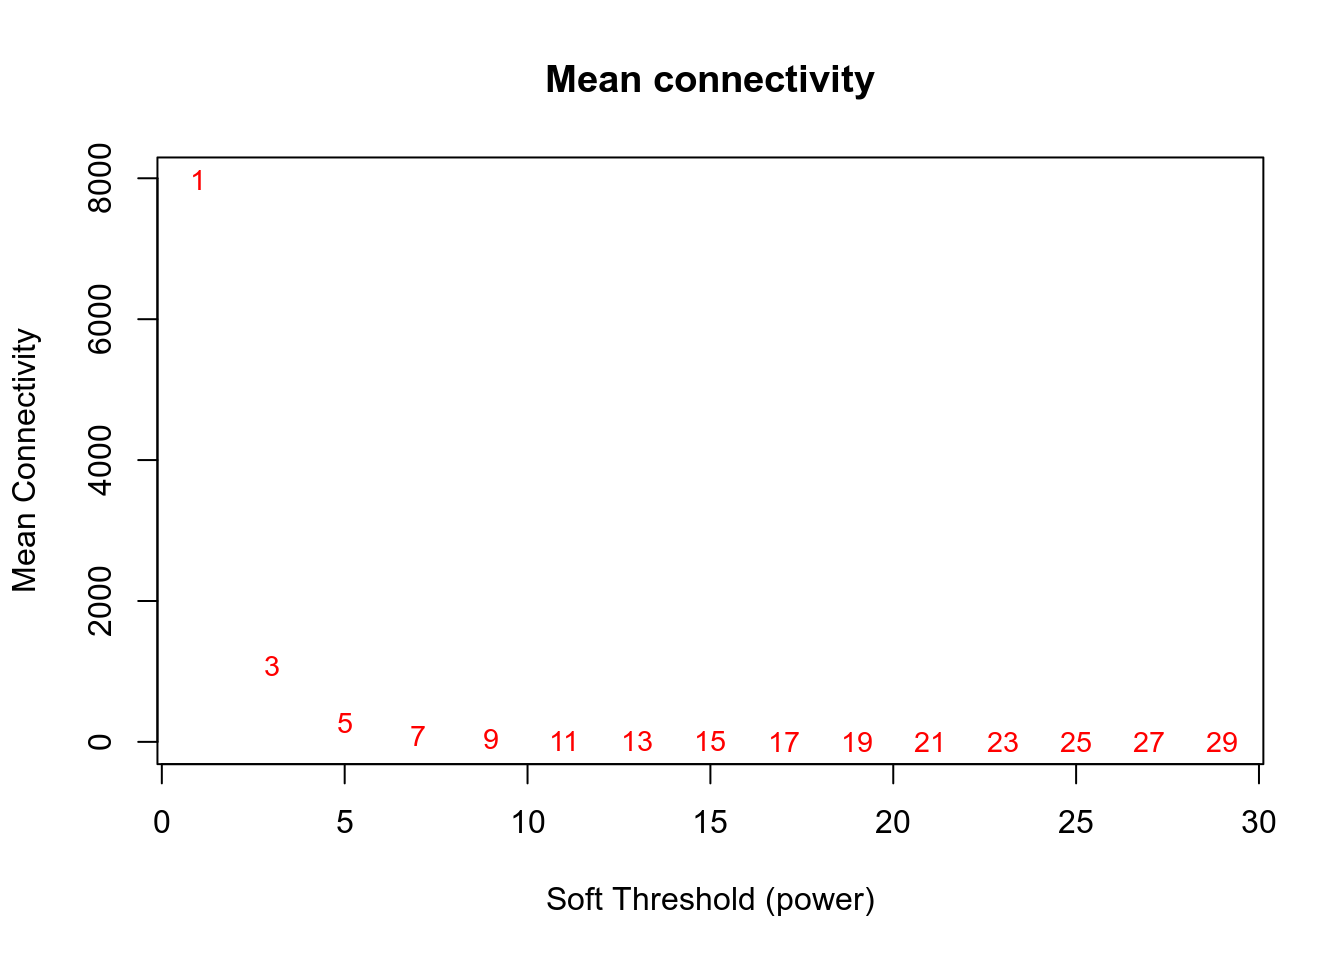
Network is computed using power=7.

Here are the modules for a few genes of interest:
- VNN1 is in the coral module.
- PPARA is in the grey module.
- PPARD is in the yellow module.
- PPARG is in the turquoise module.
- PPARGC1A is in the grey module.
- PPARGC1B is in the lavenderblush module.
g:Profiler results for all modules are available here. Since there are many modules, you should expect at least 1 minute computation on the g:Profiler website for this query. Check below for faster queries focused on VNN1 module.
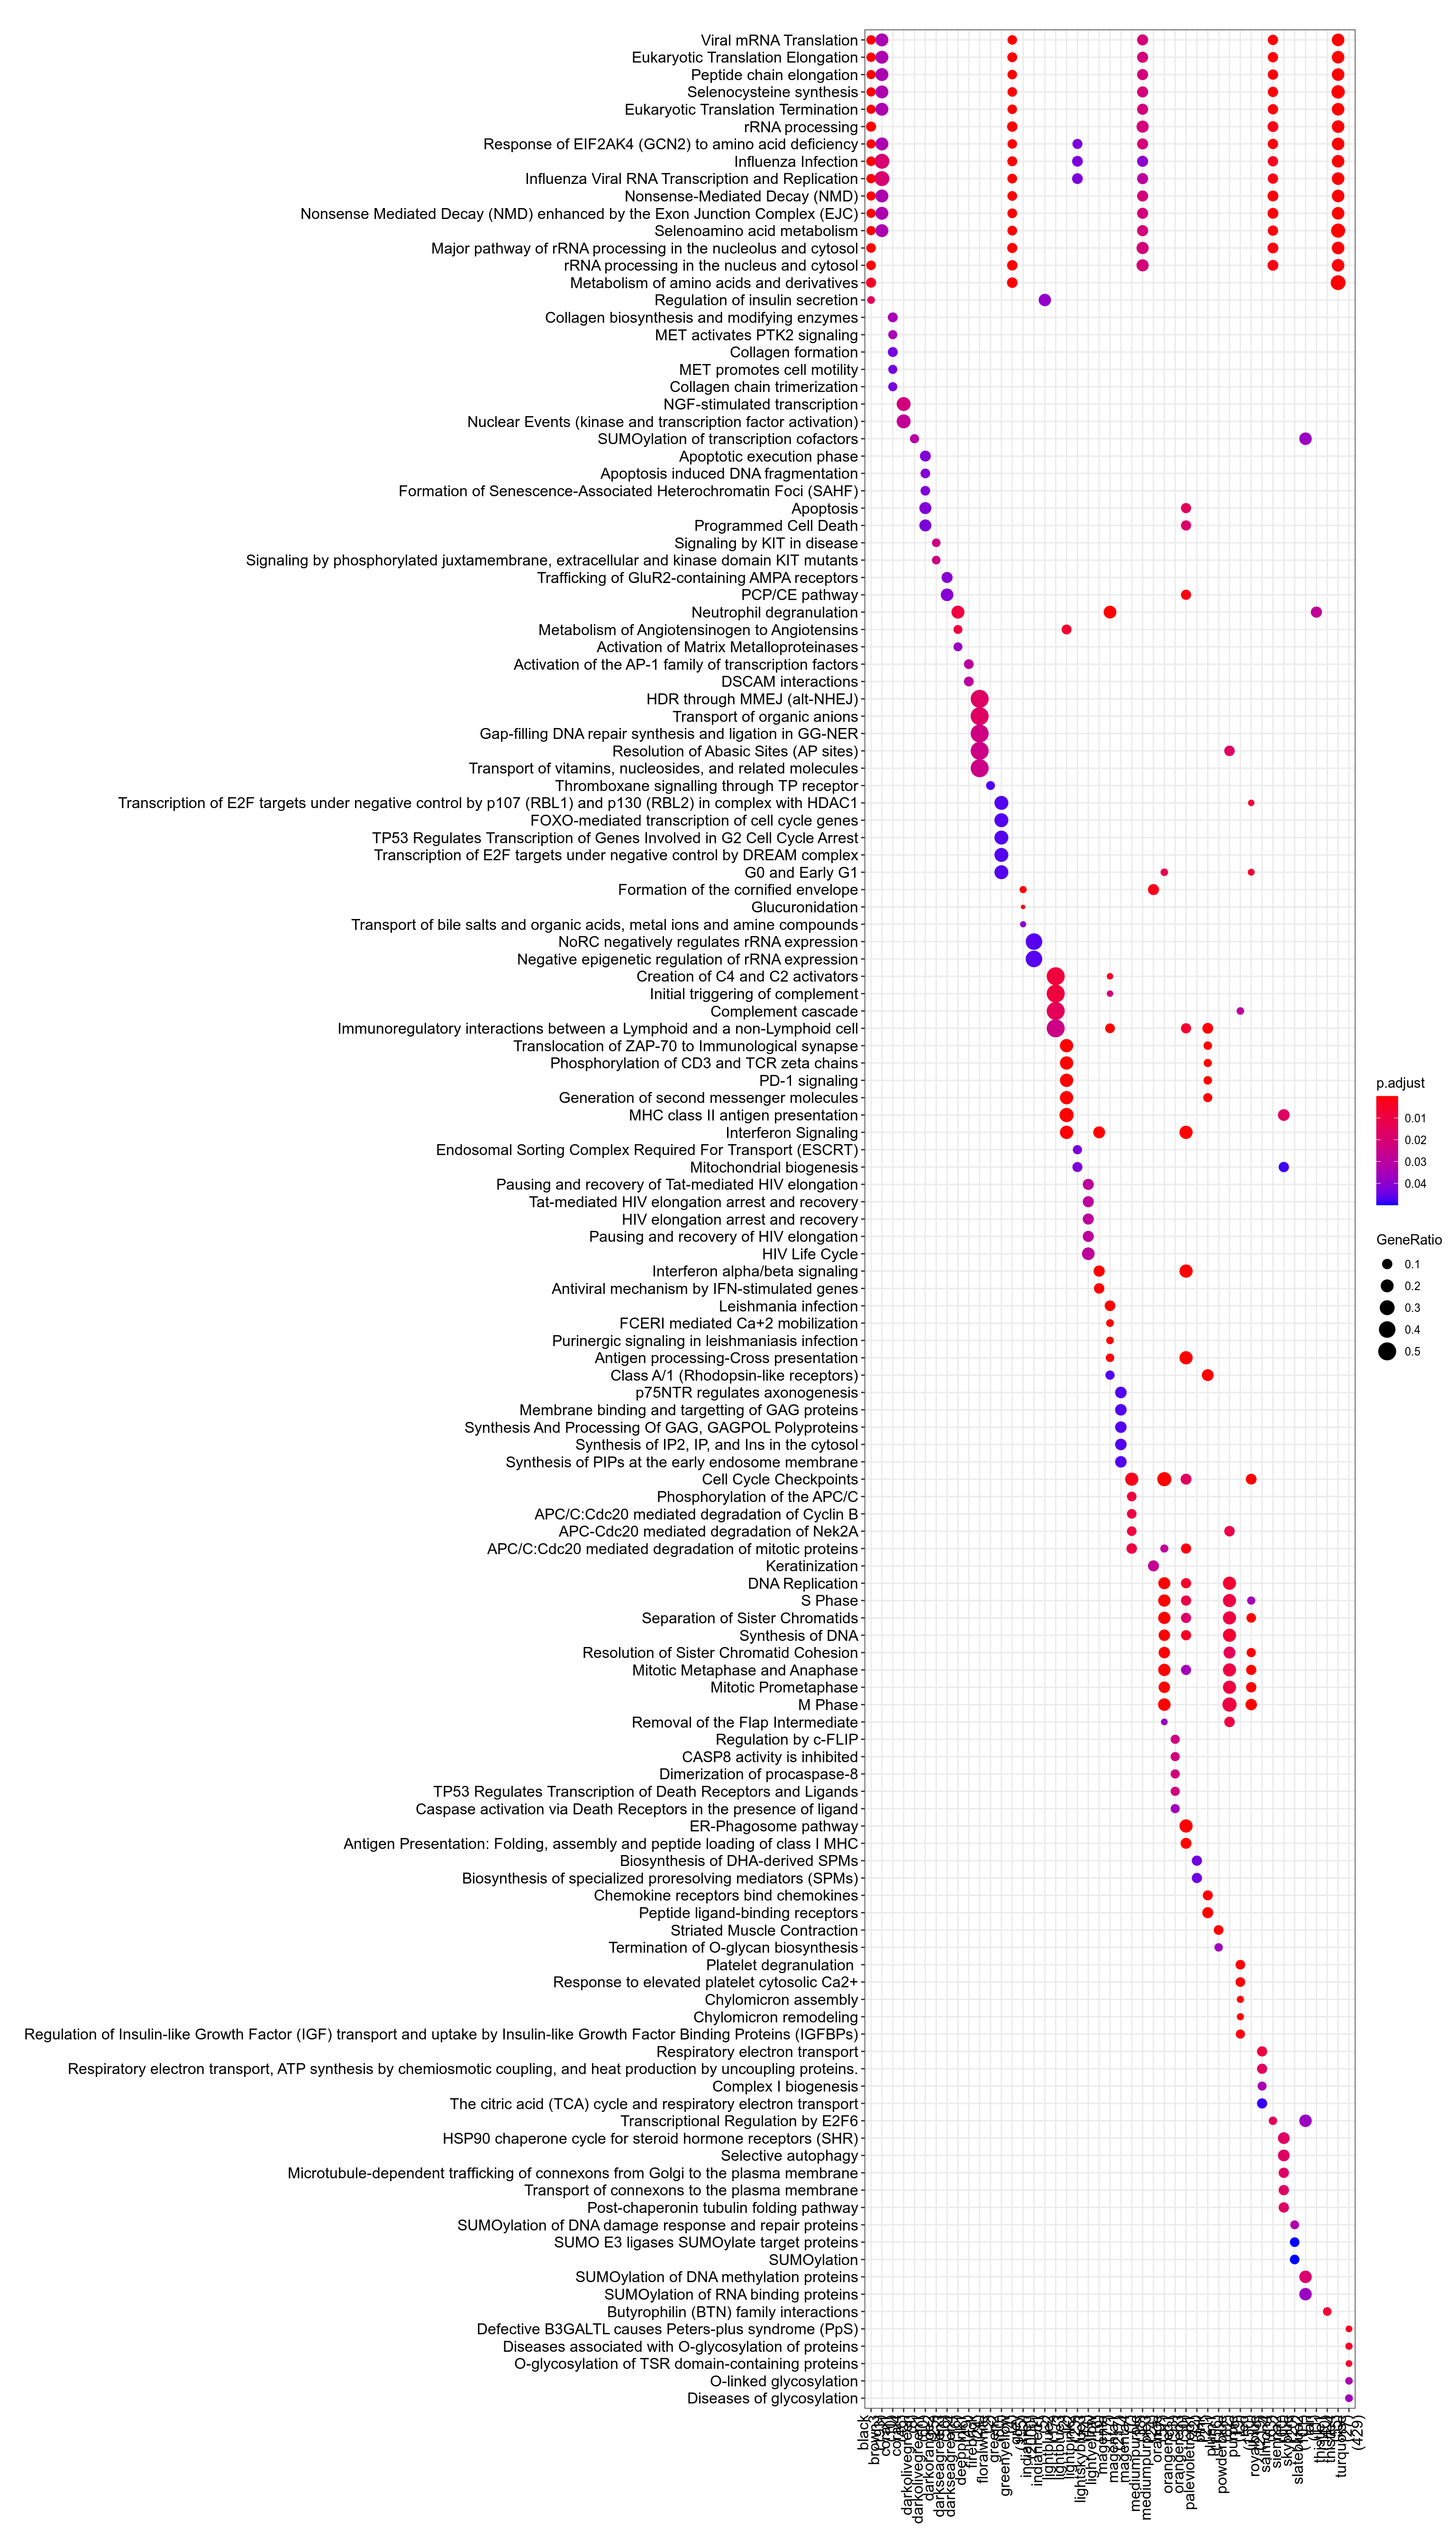
Figure 3.137: Pathway
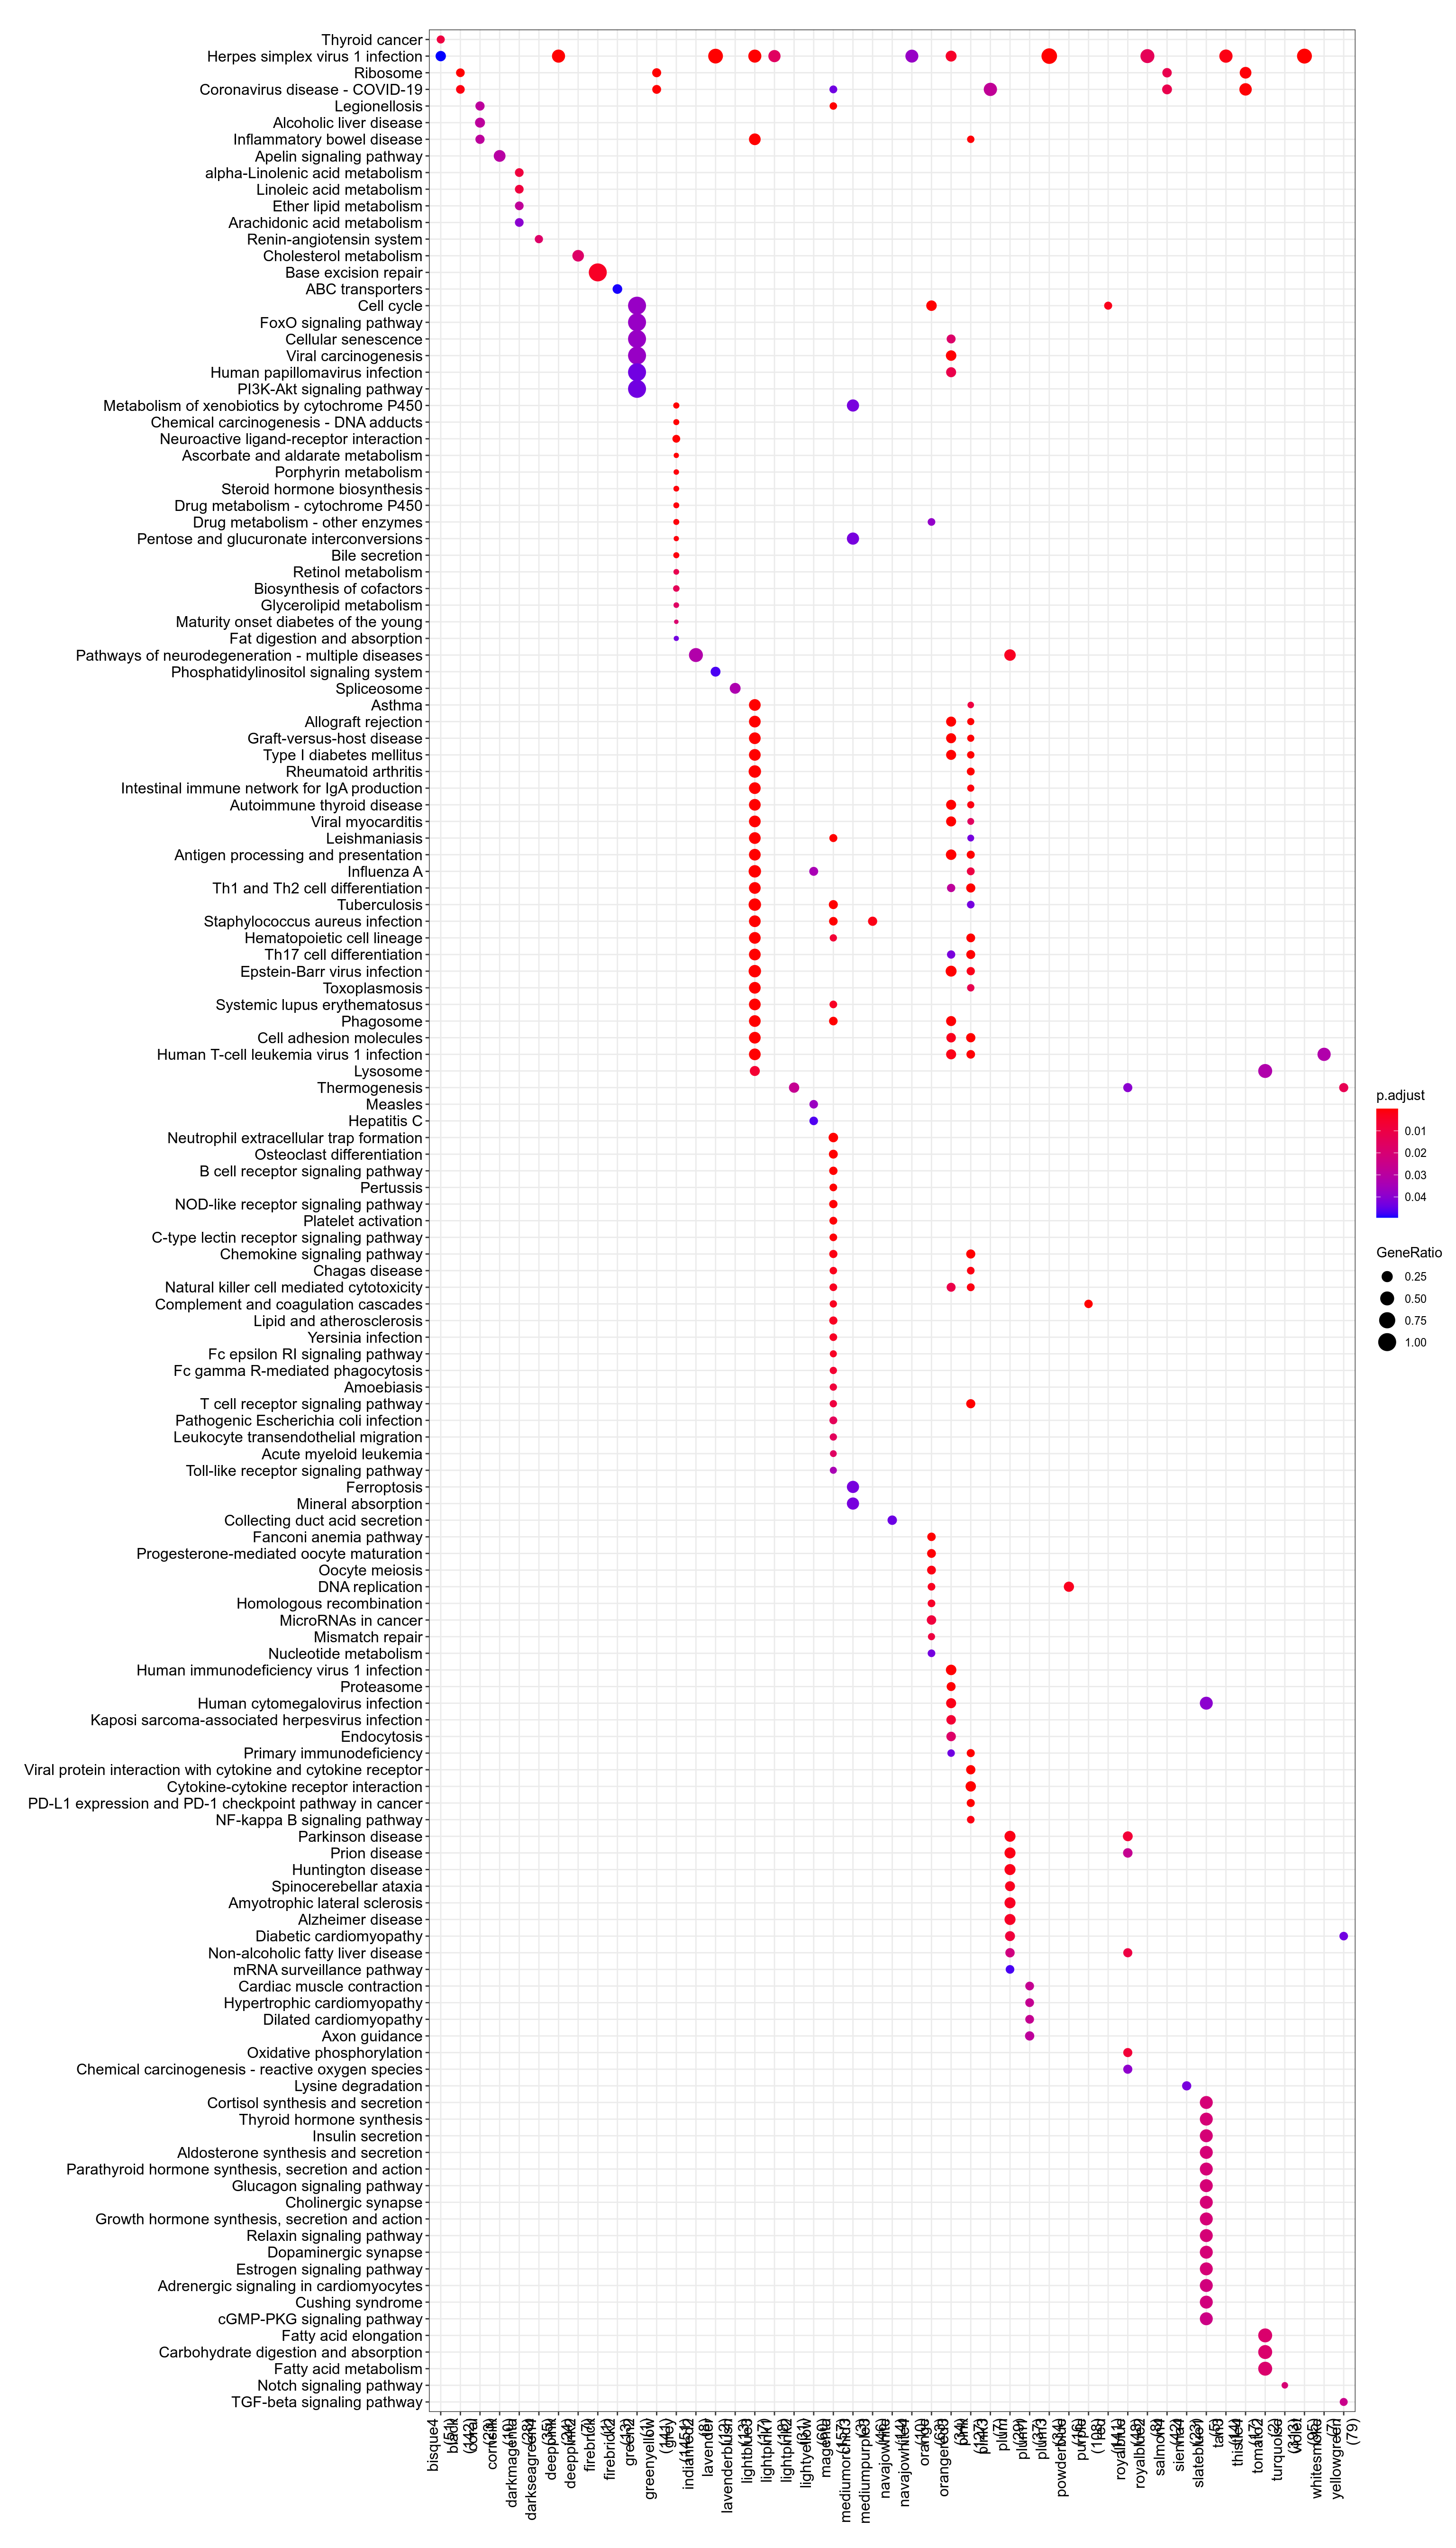
Figure 3.138: Kegg
.](_main_files/figure-html/resultsWgcnaTcgaSarcMFSKnitPlotEnrichHallmarks-1.png)
Figure 3.139: MSigDb Hallmarks. readable pdf version.
## No enriched DO term in these classesTo check that module-to-genes reattribution is working as expected, heatmap of signal for VNN1 module is produced, both as absolute values and as Z-score ones.
.](../../../out/bookdown/VNN1_sarcoma/plots/resultsWgcnaTcgaSarcMFSKnitPlotHeatmapVNN1ModuleAbsoluteValues.png)
Figure 3.140: log2(vst) signal in VNN1 module. Rows were gene name is prefixed with "-" display negative Z-score for these genes, meaning their signal is anticorrelated with other genes in the cluster. pdf version with readable genes and findable VNN1.
.](../../../out/bookdown/VNN1_sarcoma/plots/resultsWgcnaTcgaSarcMFSKnitPlotHeatmapVNN1ModuleZscoreValues.png)
Figure 3.141: Zscore of log2(vst) signal in VNN1 module. Rows were gene name is prefixed with "-" display negative Z-score for these genes, meaning their signal is anticorrelated with other genes in the cluster. pdf version with readable genes and findable VNN1.
.](_main_files/figure-html/resultsWgcnaTcgaSarcMFSKnitPlotGenesInVNN1ModuleCorPearson-1.png)
Figure 3.142: Genes in VNN1 module plotted by Pearson correlation against it. Details are available in this table.
- Enrichr results for all genes in VNN1 module are available here
- Enrichr results for genes in VNN1 module and positively correlated with it are available here
- Enrichr results for genes in VNN1 module and negatively correlated with it are available here
- g:Profiler results for all genes in VNN1 module are available here
- g:Profiler results for genes in VNN1 module and positively correlated with it are available here
- g:Profiler results for genes in VNN1 module and negatively correlated with it are available here
- g:Profiler results for comparison of the three queries above are available here