3.2.2 Primary diagnosis subsets
3.2.2.1 Leiomyosarcoma
There are 36886 genes and 104 samples in the dataset.
At least some samples or genes look not suitable for the co-expression analysis. After removing them, there remain 36857 genes and 104 samples.
##    Power SFT.R.sq slope truncated.R.sq  mean.k. median.k.  max.k.
## 1      1    0.436 -2.85          0.957 4.43e+03  4.27e+03 8300.00
## 2      3    0.818 -2.52          0.988 2.33e+02  1.78e+02 1210.00
## 3      5    0.866 -2.23          0.988 2.90e+01  1.45e+01  307.00
## 4      7    0.925 -2.05          0.998 6.07e+00  1.80e+00  135.00
## 5      9    0.962 -1.87          0.990 1.84e+00  3.07e-01   88.50
## 6     11    0.968 -1.70          0.985 7.36e-01  6.58e-02   62.50
## 7     13    0.977 -1.56          0.995 3.60e-01  1.63e-02   46.30
## 8     15    0.973 -1.47          0.991 2.04e-01  4.48e-03   35.40
## 9     17    0.974 -1.41          0.991 1.28e-01  1.32e-03   27.70
## 10    19    0.971 -1.37          0.989 8.58e-02  4.08e-04   22.10
## 11    21    0.979 -1.33          0.997 6.08e-02  1.30e-04   17.90
## 12    23    0.977 -1.31          0.993 4.48e-02  4.35e-05   14.70
## 13    25    0.977 -1.29          0.993 3.40e-02  1.46e-05   12.20
## 14    27    0.973 -1.29          0.987 2.65e-02  5.05e-06   10.20
## 15    29    0.975 -1.27          0.995 2.11e-02  1.76e-06    8.65

Network is computed using power=5.

Here are the modules for a few genes of interest:
- VNN1 is in the red module.
- PPARA is in the royalblue module.
- PPARD is in the lightsteelblue1 module.
- PPARG is in the turquoise module.
- PPARGC1A is in the blue module.
- PPARGC1B is in the grey module.
g:Profiler results for all modules are available here. Since there are many modules, you should expect at least 1 minute computation on the g:Profiler website for this query. Check below for faster queries focused on VNN1 module.

Figure 3.87: Pathway
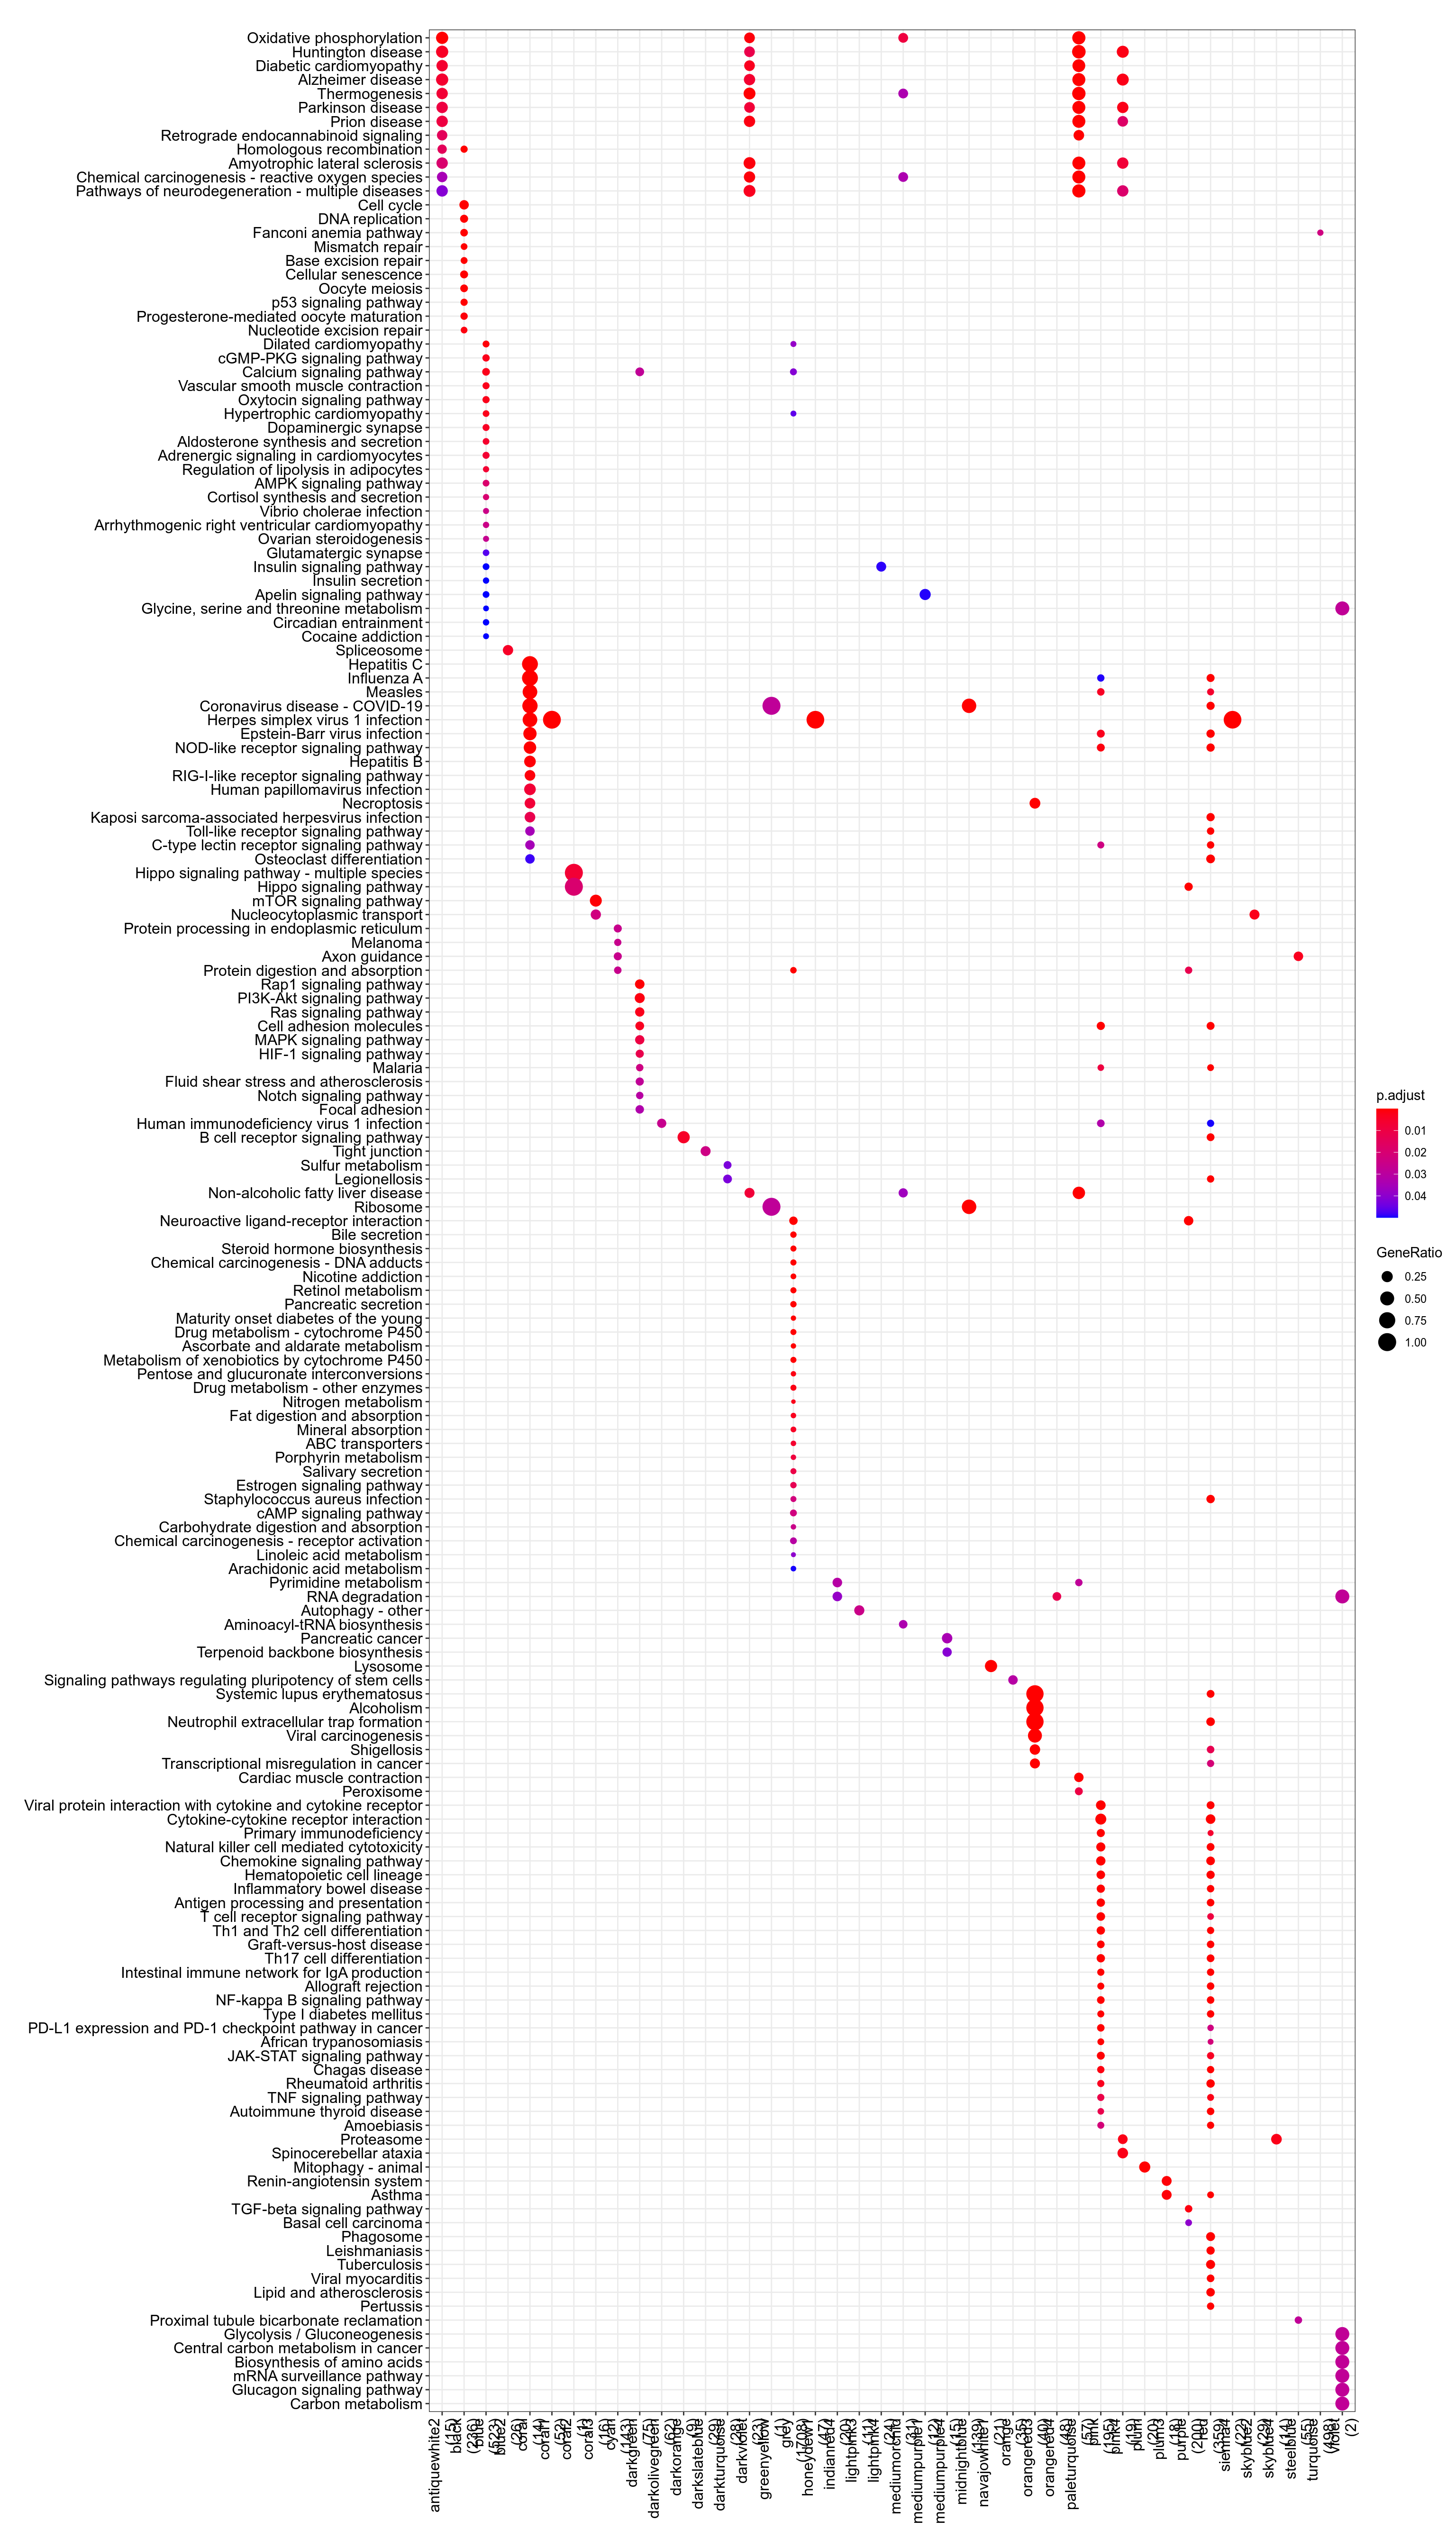
Figure 3.88: Kegg
.](_main_files/figure-html/resultsWgcnaTcgaSarcLeiomyosarcomaKnitPlotEnrichHallmarks-1.png)
Figure 3.89: MSigDb Hallmarks. readable pdf version.
## No enriched DO term in these classesTo check that module-to-genes reattribution is working as expected, heatmap of signal for VNN1 module is produced, both as absolute values and as Z-score ones.
.](../../../out/bookdown/VNN1_sarcoma/plots/resultsWgcnaTcgaSarcLeiomyosarcomaKnitPlotHeatmapVNN1ModuleAbsoluteValues.png)
Figure 3.90: log2(vst) signal in VNN1 module. Rows were gene name is prefixed with "-" display negative Z-score for these genes, meaning their signal is anticorrelated with other genes in the cluster. pdf version with readable genes and findable VNN1.
.](../../../out/bookdown/VNN1_sarcoma/plots/resultsWgcnaTcgaSarcLeiomyosarcomaKnitPlotHeatmapVNN1ModuleZscoreValues.png)
Figure 3.91: Zscore of log2(vst) signal in VNN1 module. Rows were gene name is prefixed with "-" display negative Z-score for these genes, meaning their signal is anticorrelated with other genes in the cluster. pdf version with readable genes and findable VNN1.
.](_main_files/figure-html/resultsWgcnaTcgaSarcLeiomyosarcomaKnitPlotGenesInVNN1ModuleCorPearson-1.png)
Figure 3.92: Genes in VNN1 module plotted by Pearson correlation against it. Details are available in this table.
- Enrichr results for all genes in VNN1 module are available here
- Enrichr results for genes in VNN1 module and positively correlated with it are available here
- Enrichr results for genes in VNN1 module and negatively correlated with it are available here
- g:Profiler results for all genes in VNN1 module are available here
- g:Profiler results for genes in VNN1 module and positively correlated with it are available here
- g:Profiler results for genes in VNN1 module and negatively correlated with it are available here
- g:Profiler results for comparison of the three queries above are available here