3.2.2.3 Undifferentiated sarcoma
There are 36886 genes and 35 samples in the dataset.
At least some samples or genes look not suitable for the co-expression analysis. After removing them, there remain 36699 genes and 35 samples.
##    Power SFT.R.sq slope truncated.R.sq  mean.k. median.k. max.k.
## 1      1    0.438 -4.26          0.904 5930.000  5.73e+03 9460.0
## 2      3    0.841 -3.15          0.977  480.000  4.07e+02 1760.0
## 3      5    0.906 -2.69          0.984   77.600  5.40e+01  554.0
## 4      7    0.927 -2.36          0.990   18.900  1.04e+01  233.0
## 5      9    0.917 -2.17          0.985    6.190  2.52e+00  125.0
## 6     11    0.900 -2.00          0.966    2.550  7.34e-01   78.2
## 7     13    0.936 -1.74          0.958    1.270  2.44e-01   52.4
## 8     15    0.968 -1.55          0.966    0.738  8.97e-02   41.0
## 9     17    0.900 -1.52          0.882    0.486  3.57e-02   34.7
## 10    19    0.828 -1.52          0.798    0.353  1.50e-02   33.3
## 11    21    0.395 -1.93          0.348    0.277  6.62e-03   32.3
## 12    23    0.351 -2.19          0.325    0.230  3.02e-03   31.5
## 13    25    0.354 -1.64          0.194    0.199  1.41e-03   31.0
## 14    27    0.355 -1.59          0.195    0.178  6.81e-04   30.6
## 15    29    0.355 -1.55          0.197    0.163  3.33e-04   30.2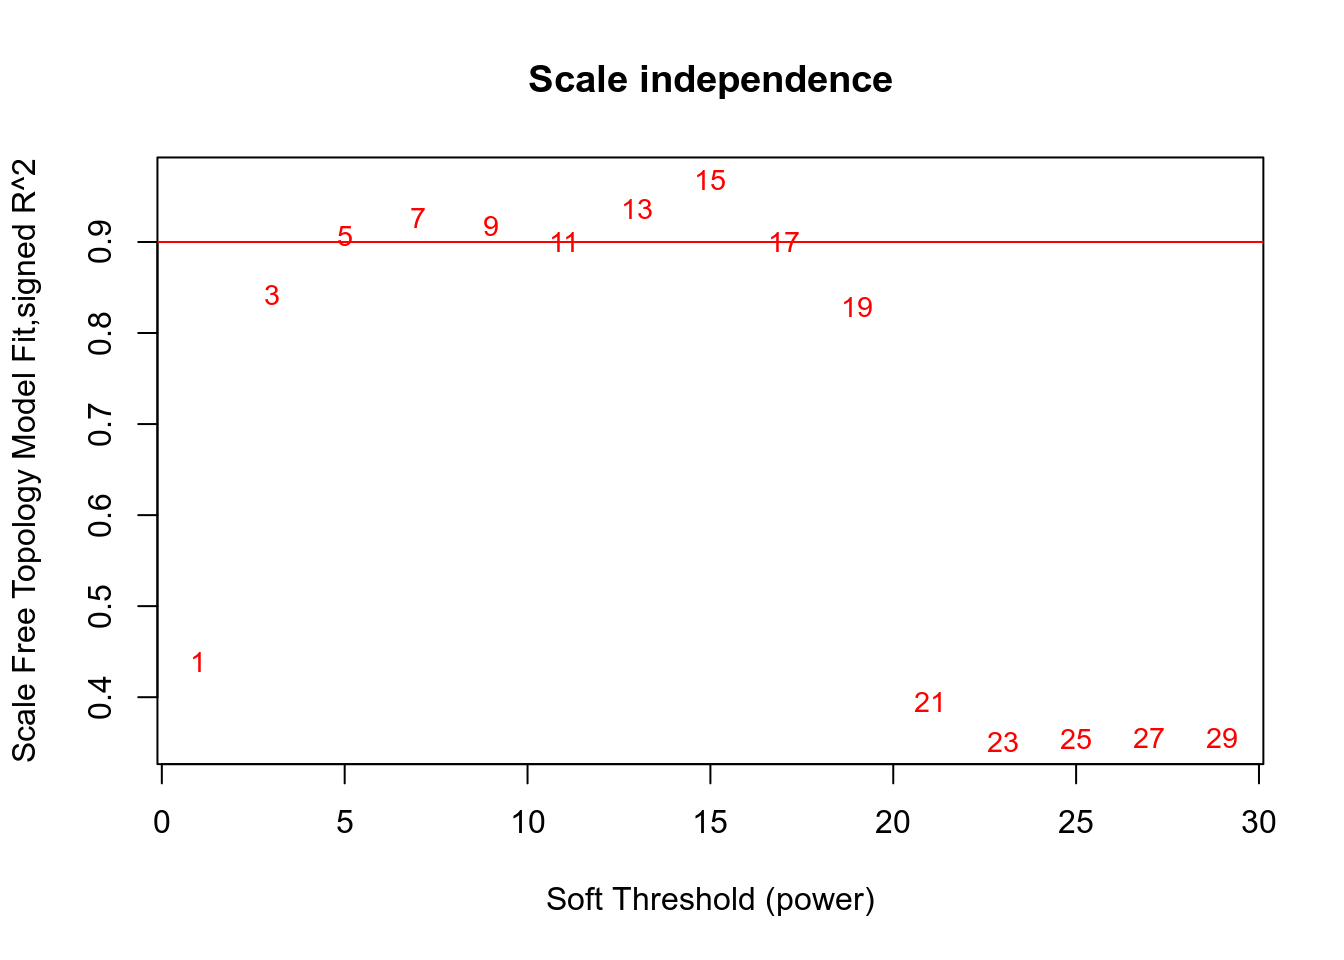
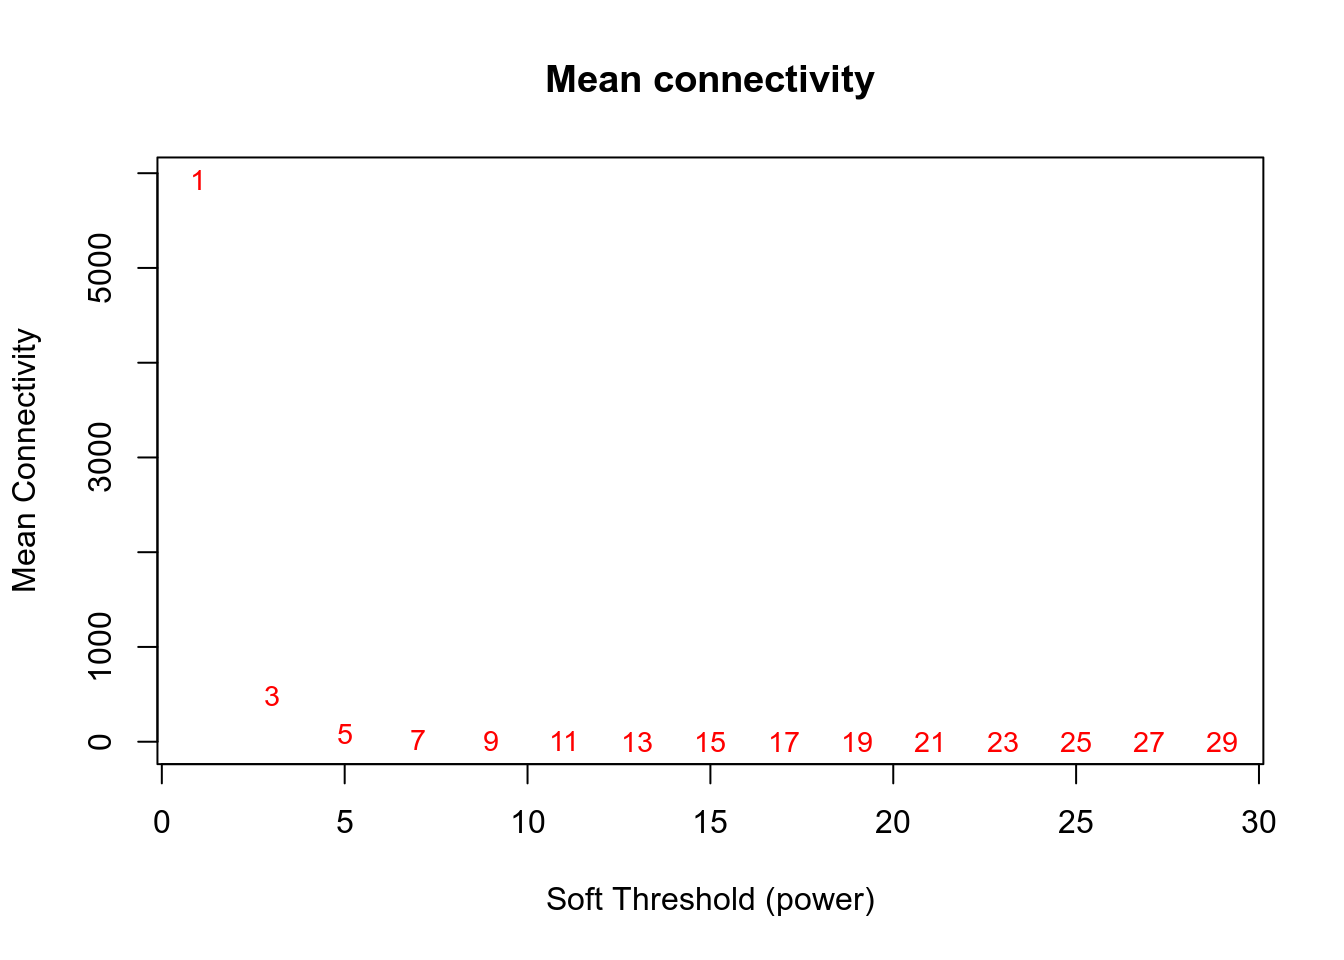
Network is computed using power=5.
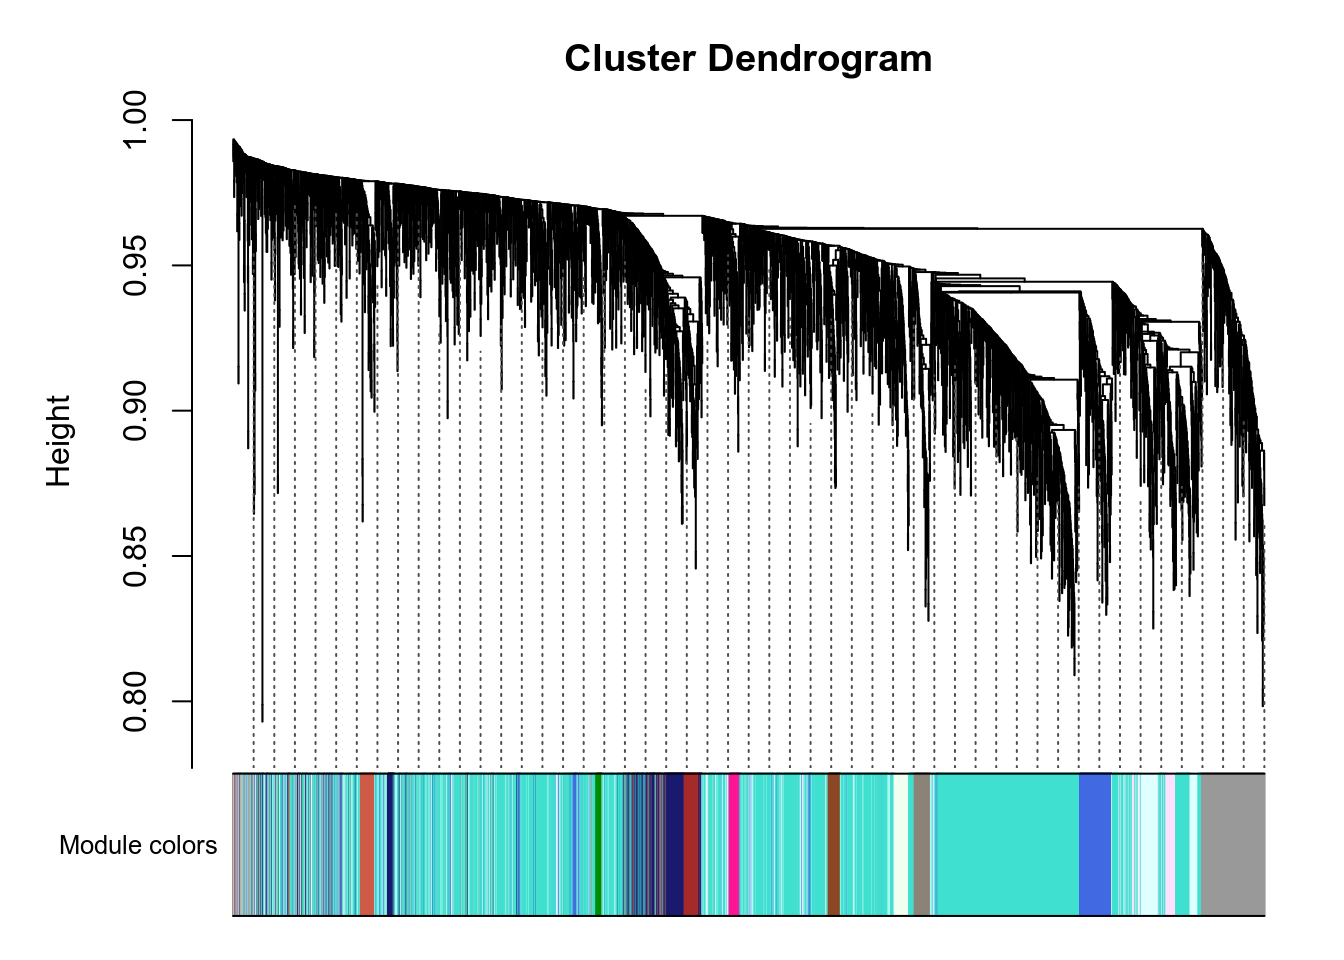
Here are the modules for a few genes of interest:
- VNN1 is in the red module.
- PPARA is in the coral module.
- PPARD is in the lightcyan module.
- PPARG is in the grey module.
- PPARGC1A is in the grey module.
- PPARGC1B is in the turquoise module.
g:Profiler results for all modules are available here. Since there are many modules, you should expect at least 1 minute computation on the g:Profiler website for this query. Check below for faster queries focused on VNN1 module.
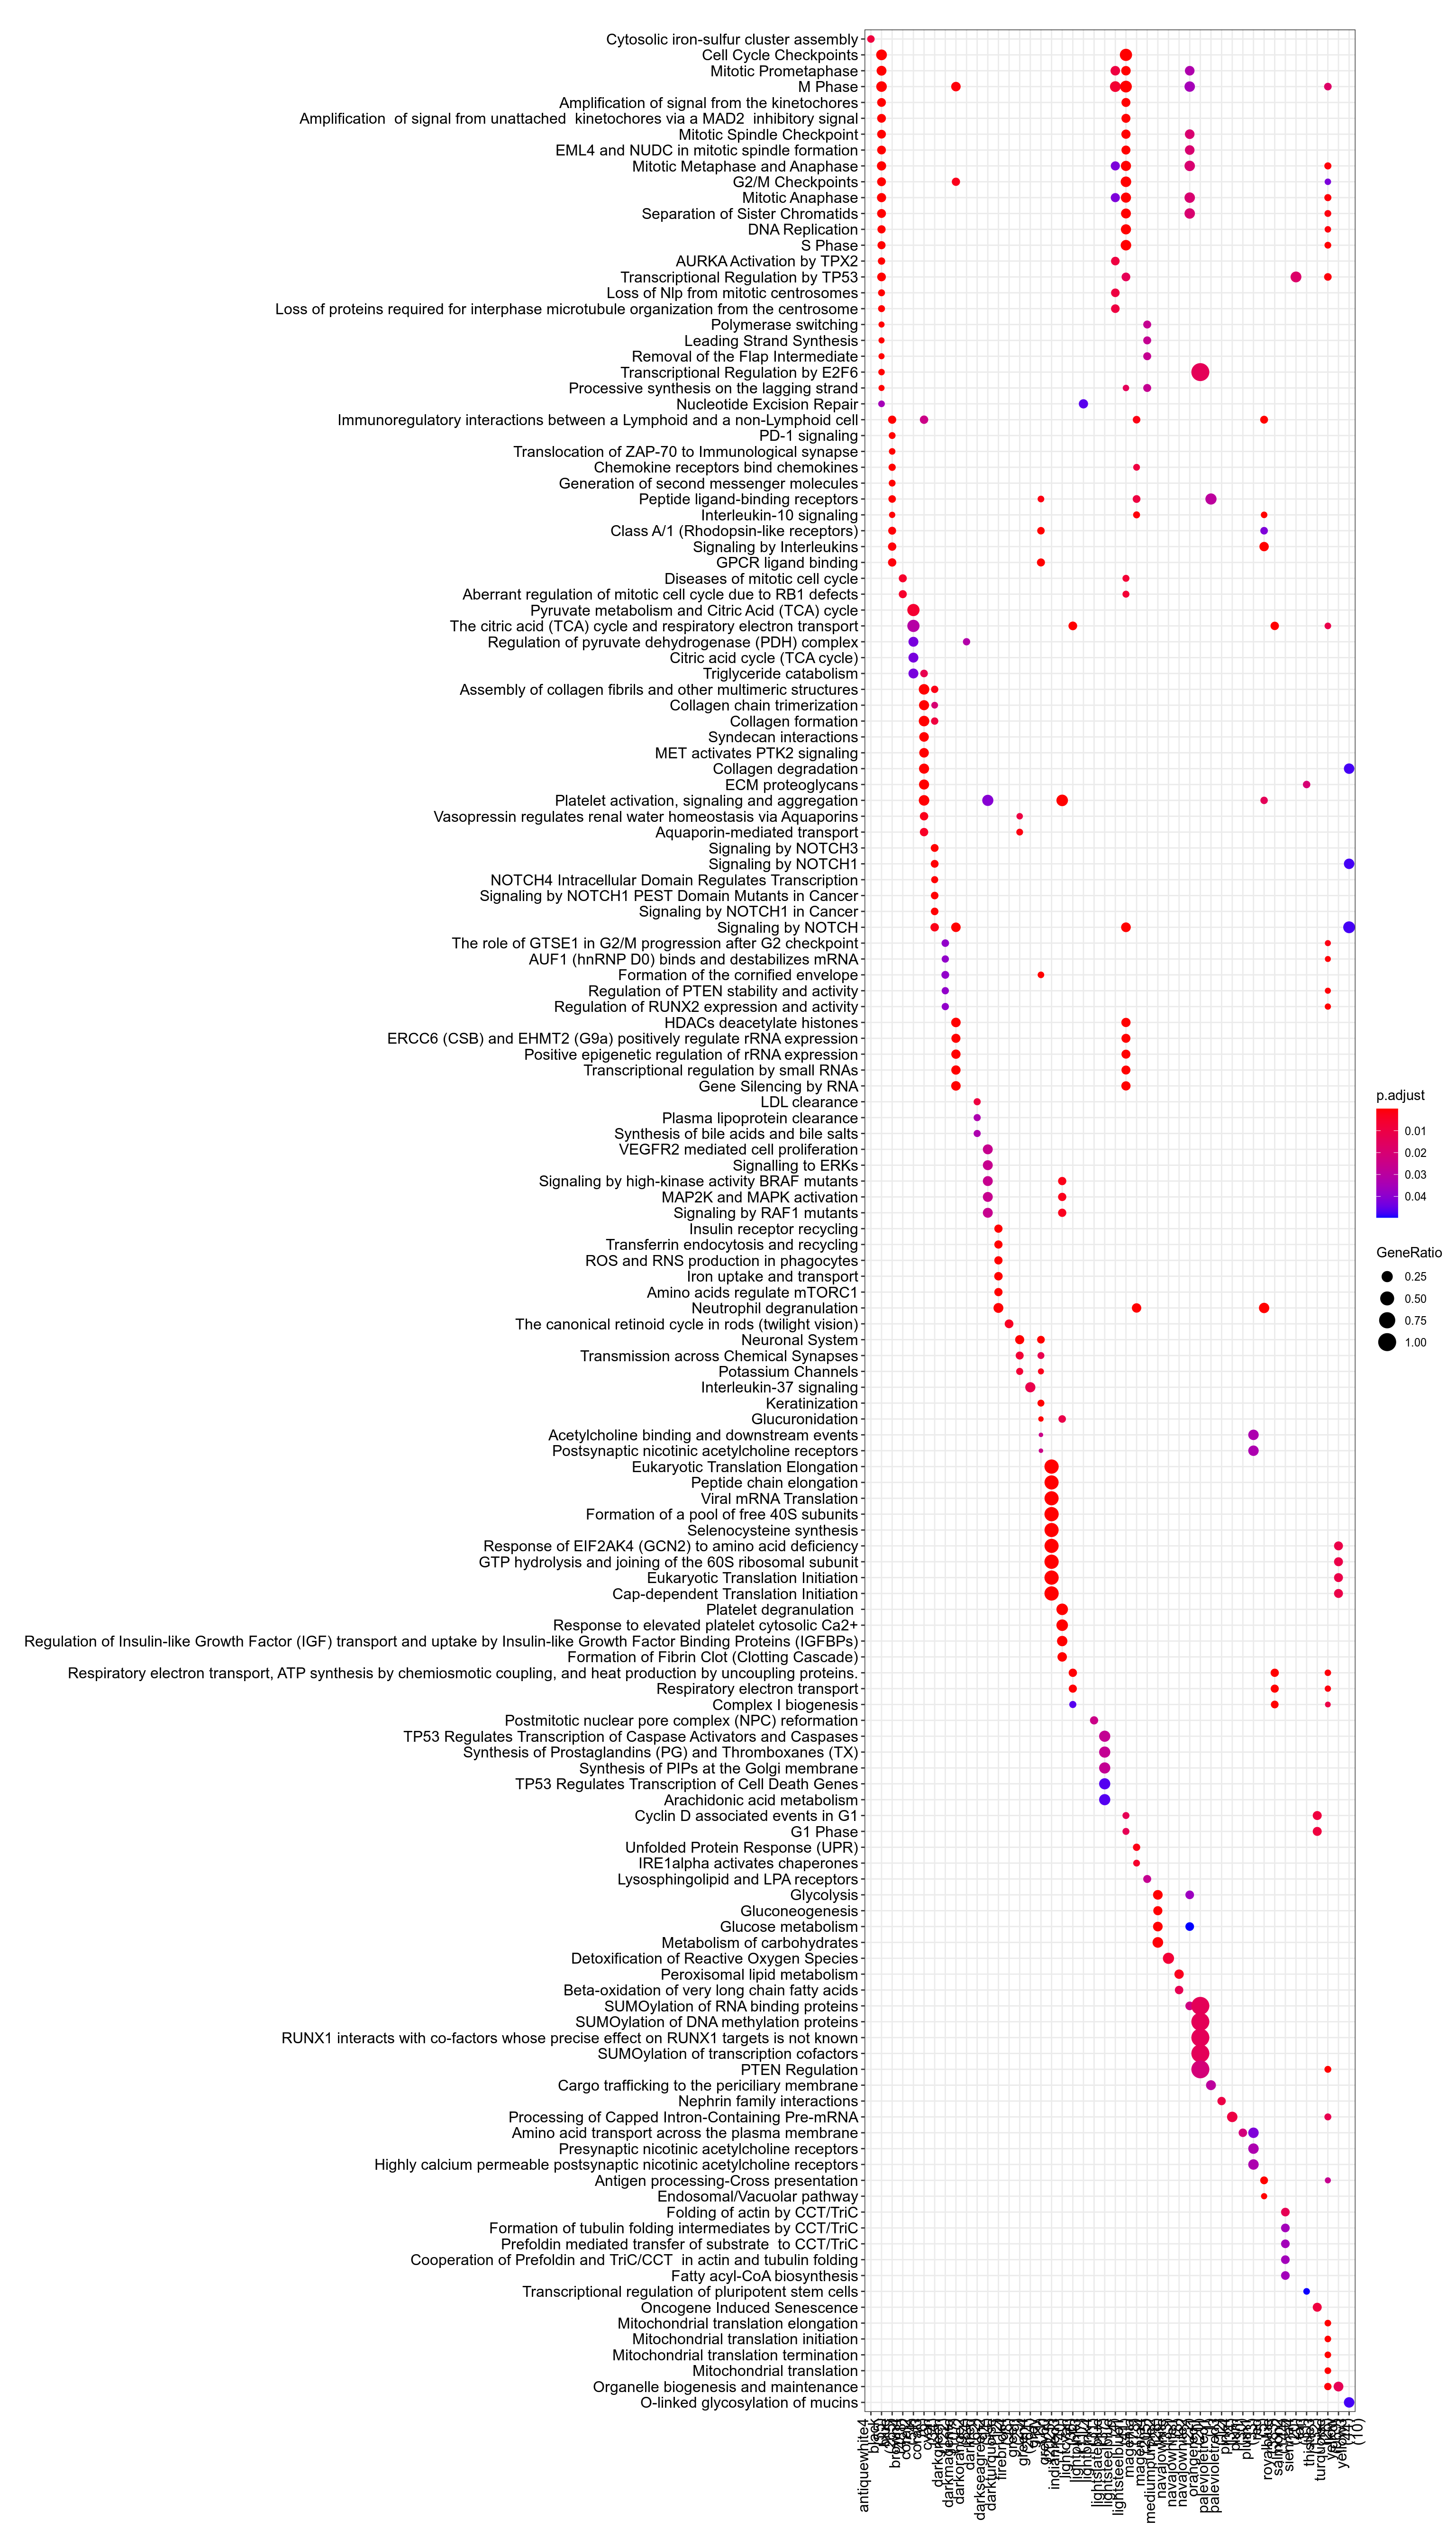
Figure 3.99: Pathway
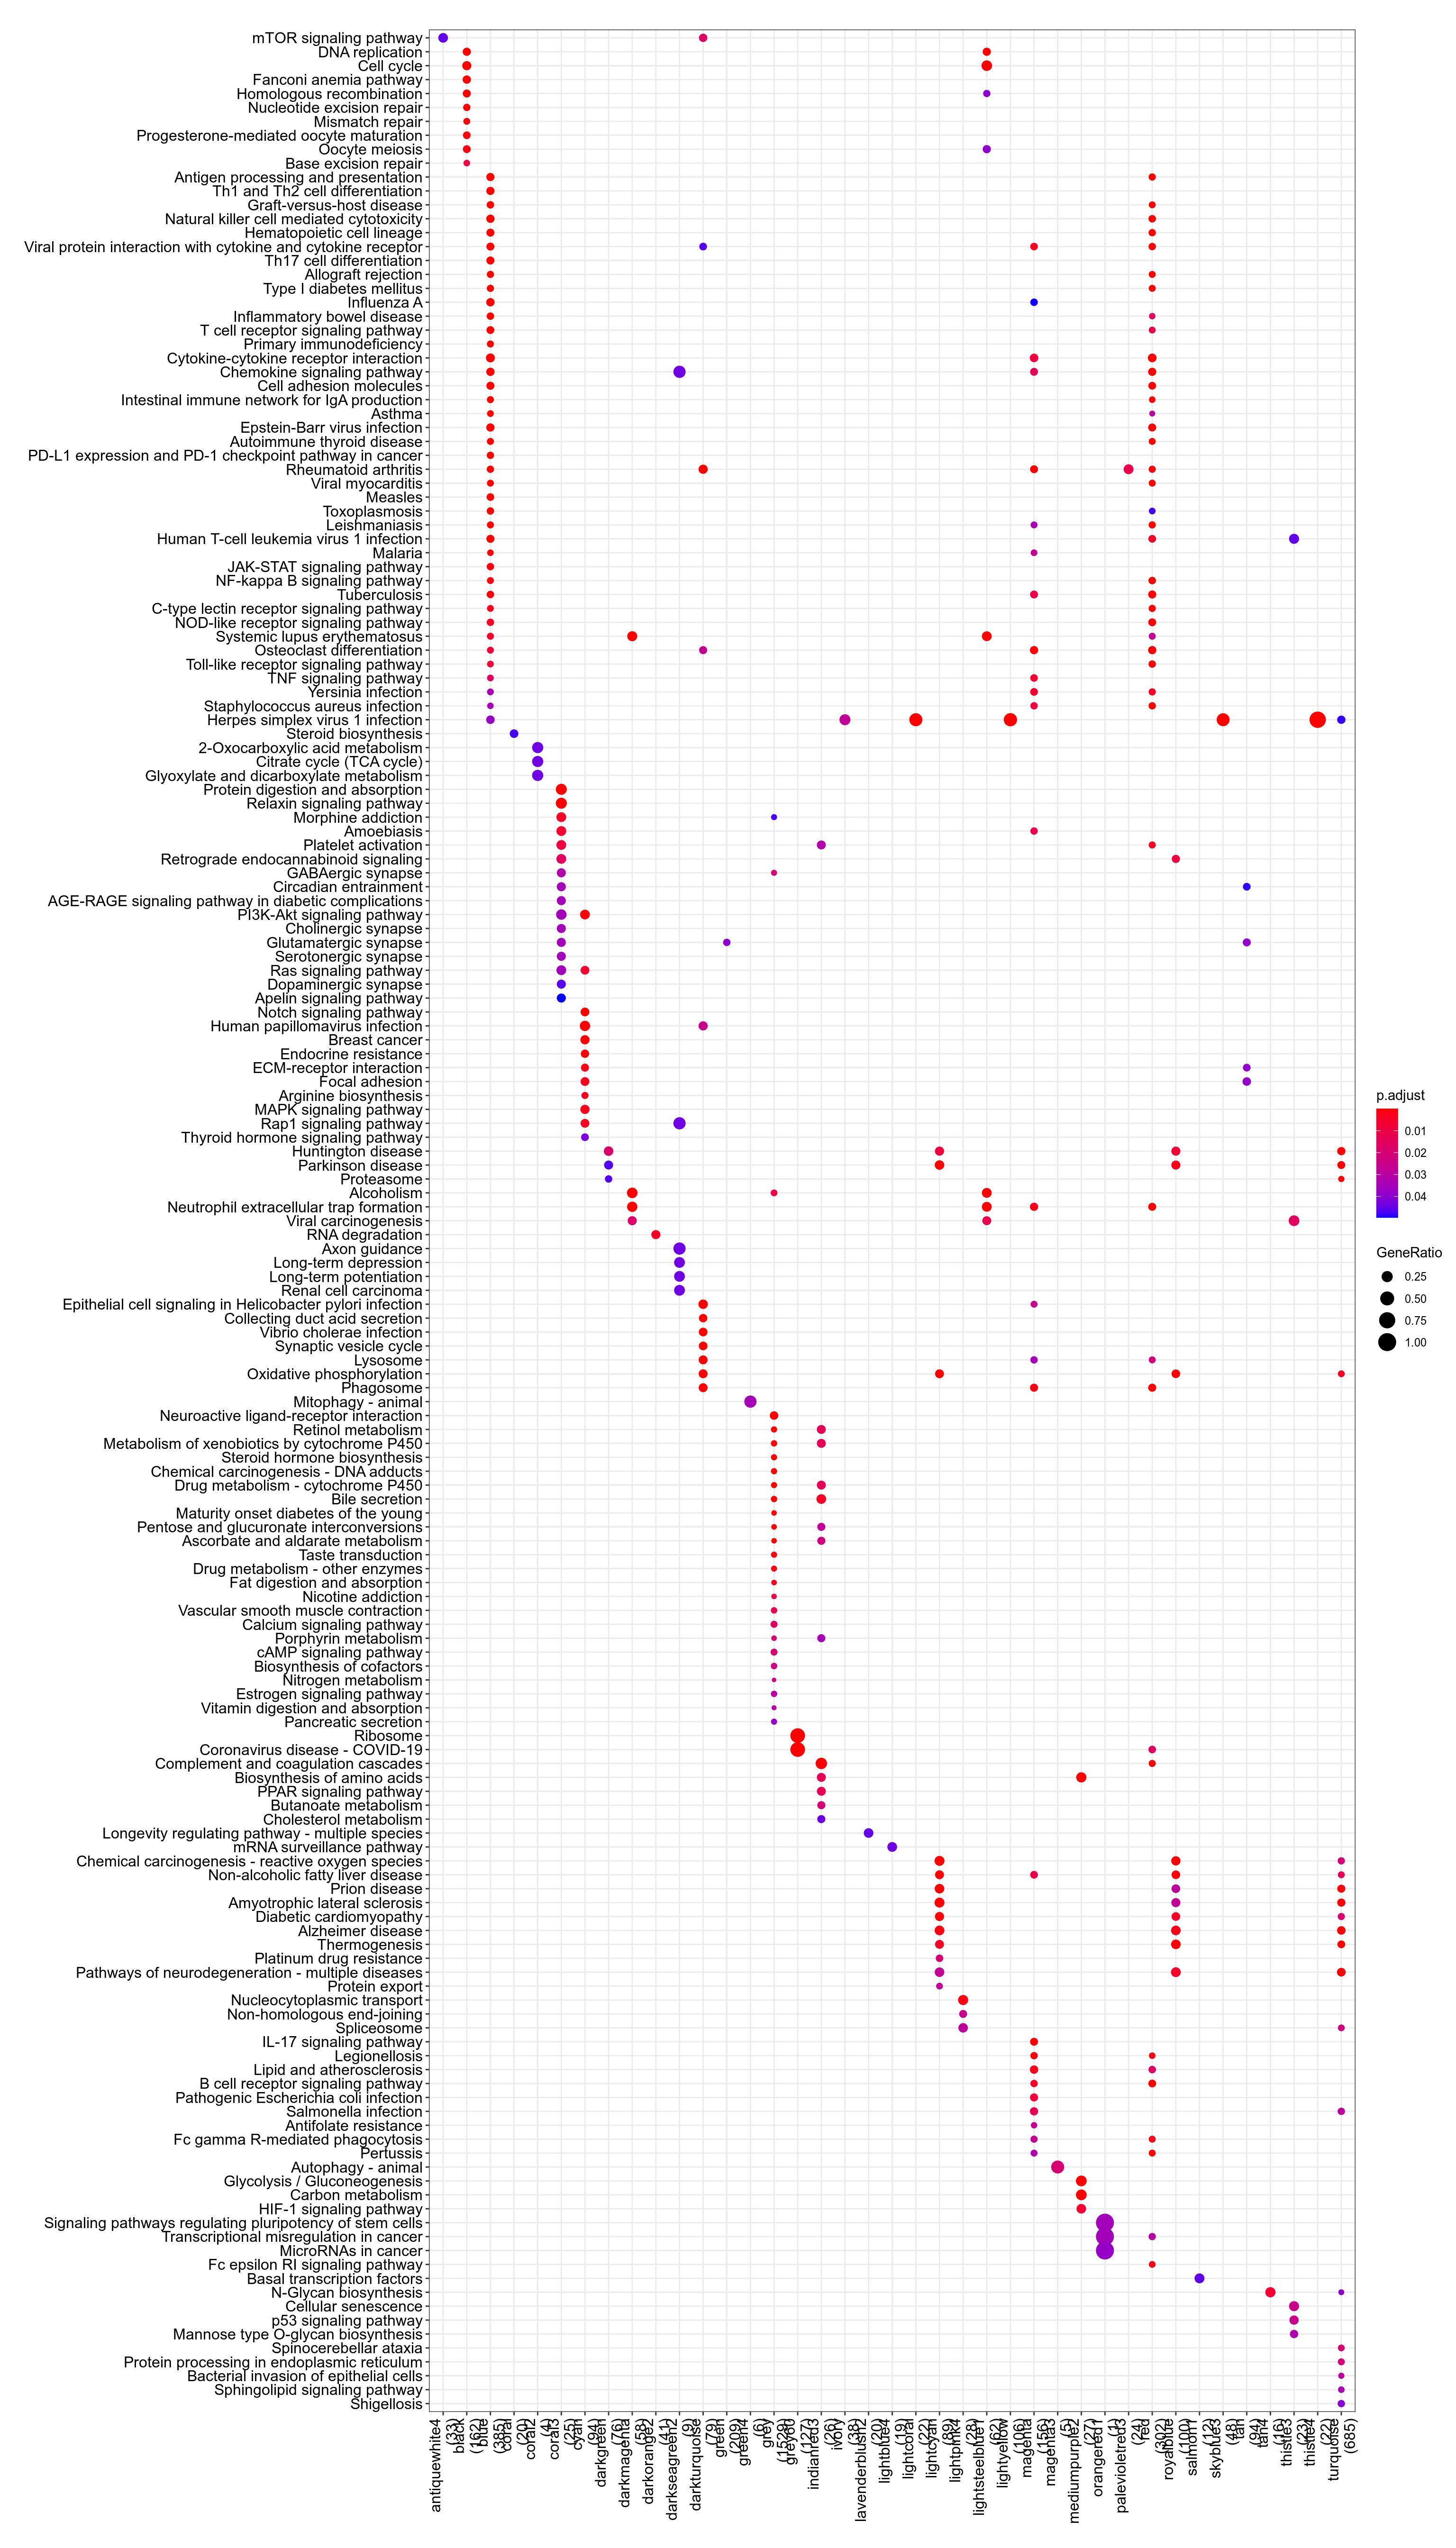
Figure 3.100: Kegg
.](_main_files/figure-html/resultsWgcnaTcgaSarcUndifferentiatedSarcomaKnitPlotEnrichHallmarks-1.png)
Figure 3.101: MSigDb Hallmarks. readable pdf version.
## No enriched DO term in these classesTo check that module-to-genes reattribution is working as expected, heatmap of signal for VNN1 module is produced, both as absolute values and as Z-score ones.
.](../../../out/bookdown/VNN1_sarcoma/plots/resultsWgcnaTcgaSarcUndifferentiatedSarcomaKnitPlotHeatmapVNN1ModuleAbsoluteValues.png)
Figure 3.102: log2(vst) signal in VNN1 module. Rows were gene name is prefixed with "-" display negative Z-score for these genes, meaning their signal is anticorrelated with other genes in the cluster. pdf version with readable genes and findable VNN1.
.](../../../out/bookdown/VNN1_sarcoma/plots/resultsWgcnaTcgaSarcUndifferentiatedSarcomaKnitPlotHeatmapVNN1ModuleZscoreValues.png)
Figure 3.103: Zscore of log2(vst) signal in VNN1 module. Rows were gene name is prefixed with "-" display negative Z-score for these genes, meaning their signal is anticorrelated with other genes in the cluster. pdf version with readable genes and findable VNN1.
.](_main_files/figure-html/resultsWgcnaTcgaSarcUndifferentiatedSarcomaKnitPlotGenesInVNN1ModuleCorPearson-1.png)
Figure 3.104: Genes in VNN1 module plotted by Pearson correlation against it. Details are available in this table.
- Enrichr results for all genes in VNN1 module are available here
- Enrichr results for genes in VNN1 module and positively correlated with it are available here
- Enrichr results for genes in VNN1 module and negatively correlated with it are available here
- g:Profiler results for all genes in VNN1 module are available here
- g:Profiler results for genes in VNN1 module and positively correlated with it are available here
- g:Profiler results for genes in VNN1 module and negatively correlated with it are available here
- g:Profiler results for comparison of the three queries above are available here