3.2 Co-expression network with WGCNA
Co-expression network is produced for the whole TCGA-SARC dataset and for each sarcoma subtype with at least 10 available samples. The resulting sections are ordered below by decreasing number of samples in the considered datasets.
3.2.1 Projects
3.2.1.1 TCGA-SARC dataset
There are 36886 genes and 265 samples in the dataset.
At least some samples or genes look not suitable for the co-expression analysis. After removing them, there remain 36880 genes and 265 samples.
##    Power SFT.R.sq slope truncated.R.sq  mean.k. median.k. max.k.
## 1      1    0.441 -2.42          0.920 3.90e+03  3.74e+03 8380.0
## 2      3    0.772 -2.35          0.959 1.88e+02  1.26e+02 1280.0
## 3      5    0.912 -2.00          0.998 2.39e+01  8.53e+00  371.0
## 4      7    0.964 -1.81          0.991 5.36e+00  8.73e-01  186.0
## 5      9    0.977 -1.65          0.989 1.78e+00  1.31e-01  121.0
## 6     11    0.990 -1.50          0.997 7.85e-01  2.47e-02   85.7
## 7     13    0.990 -1.40          0.998 4.18e-01  5.36e-03   64.2
## 8     15    0.988 -1.34          0.996 2.53e-01  1.30e-03   50.2
## 9     17    0.982 -1.30          0.990 1.67e-01  3.40e-04   40.6
## 10    19    0.974 -1.28          0.981 1.17e-01  9.18e-05   33.5
## 11    21    0.964 -1.27          0.971 8.49e-02  2.60e-05   28.0
## 12    23    0.966 -1.25          0.974 6.38e-02  7.45e-06   23.7
## 13    25    0.958 -1.25          0.966 4.92e-02  2.19e-06   20.3
## 14    27    0.973 -1.23          0.980 3.87e-02  6.55e-07   17.4
## 15    29    0.981 -1.20          0.989 3.10e-02  1.96e-07   15.1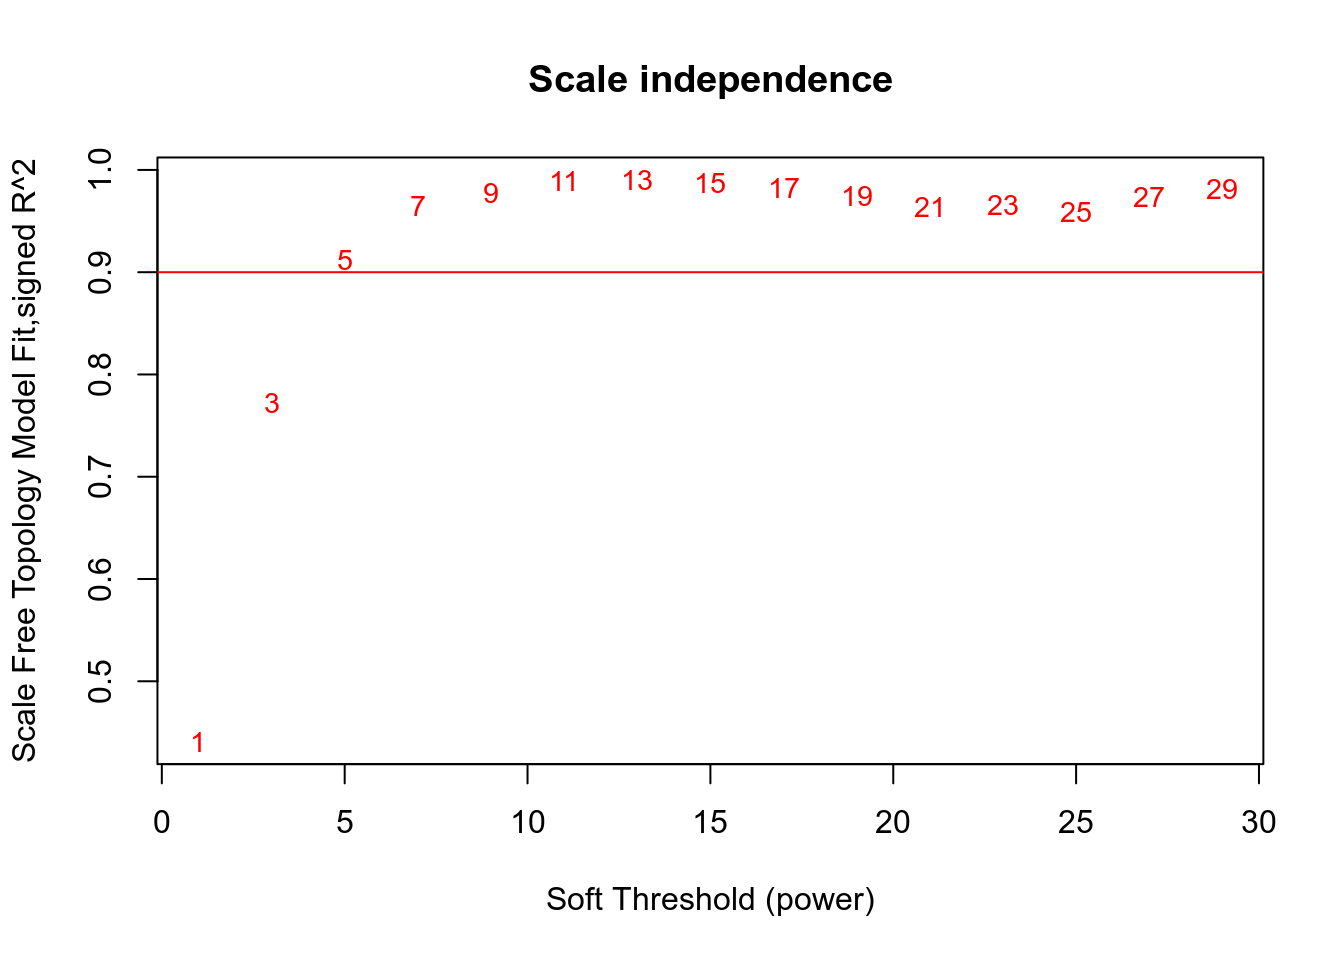
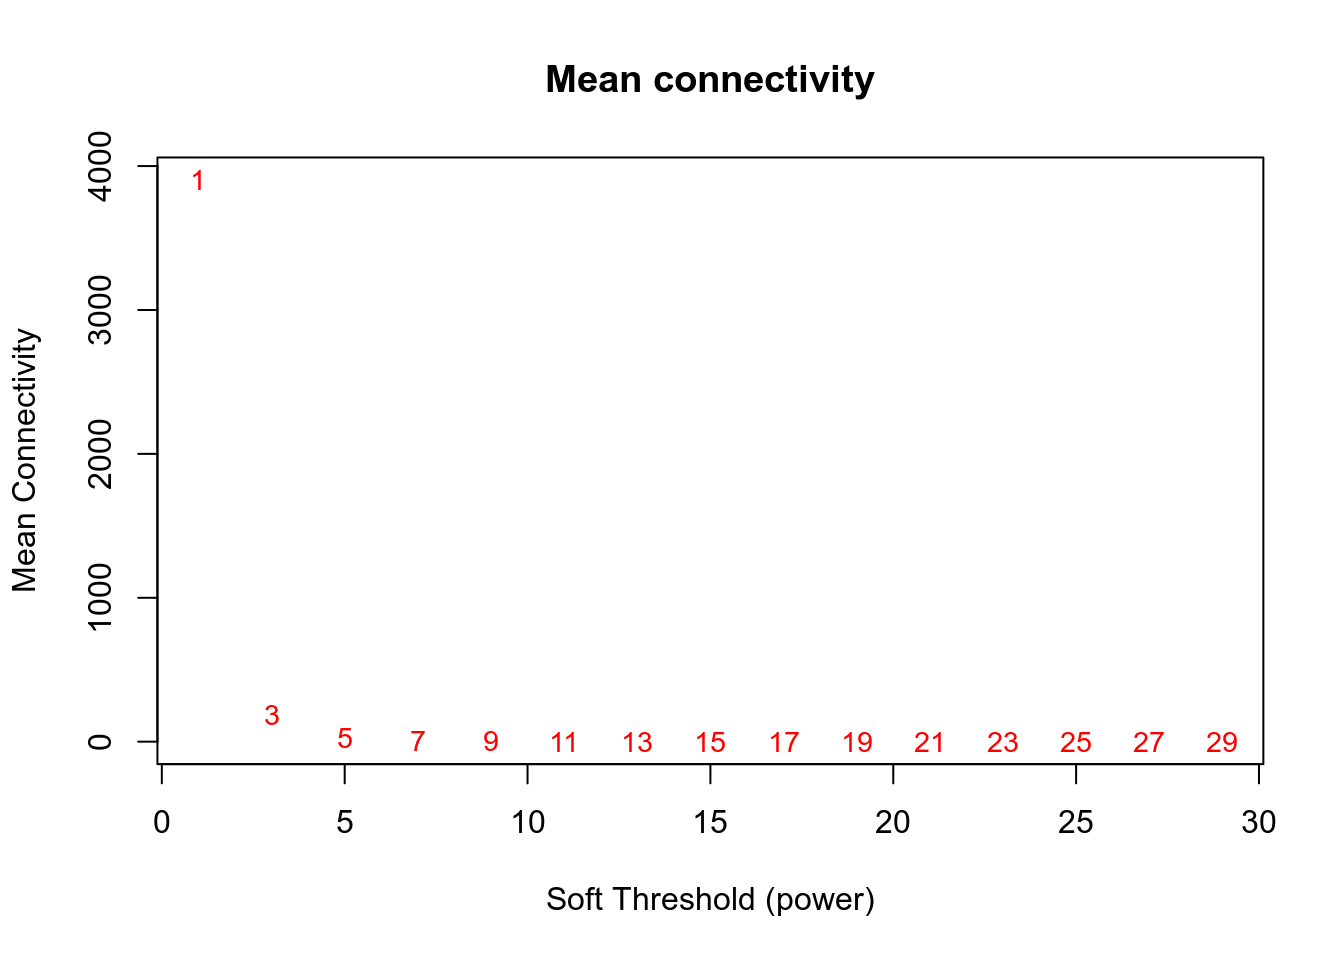
Network is computed using power=5.
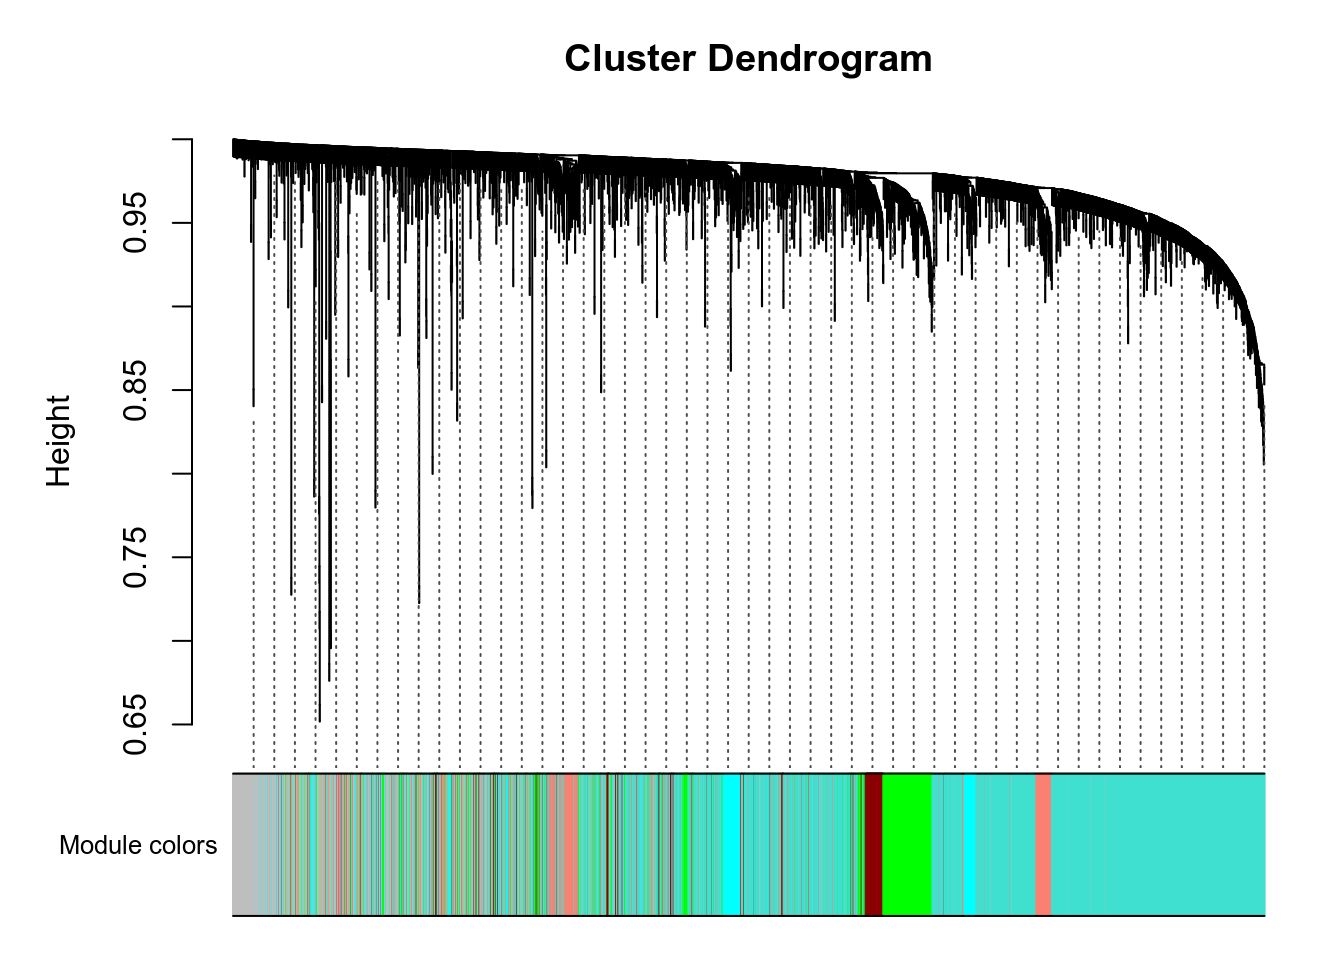
Here are the modules for a few genes of interest:
- VNN1 is in the blue module.
- PPARA is in the grey module.
- PPARD is in the grey module.
- PPARG is in the blue module.
- PPARGC1A is in the turquoise module.
- PPARGC1B is in the lightcyan1 module.
g:Profiler results for all modules are available here. Since there are many modules, you should expect at least 1 minute computation on the g:Profiler website for this query. Check below for faster queries focused on VNN1 module.
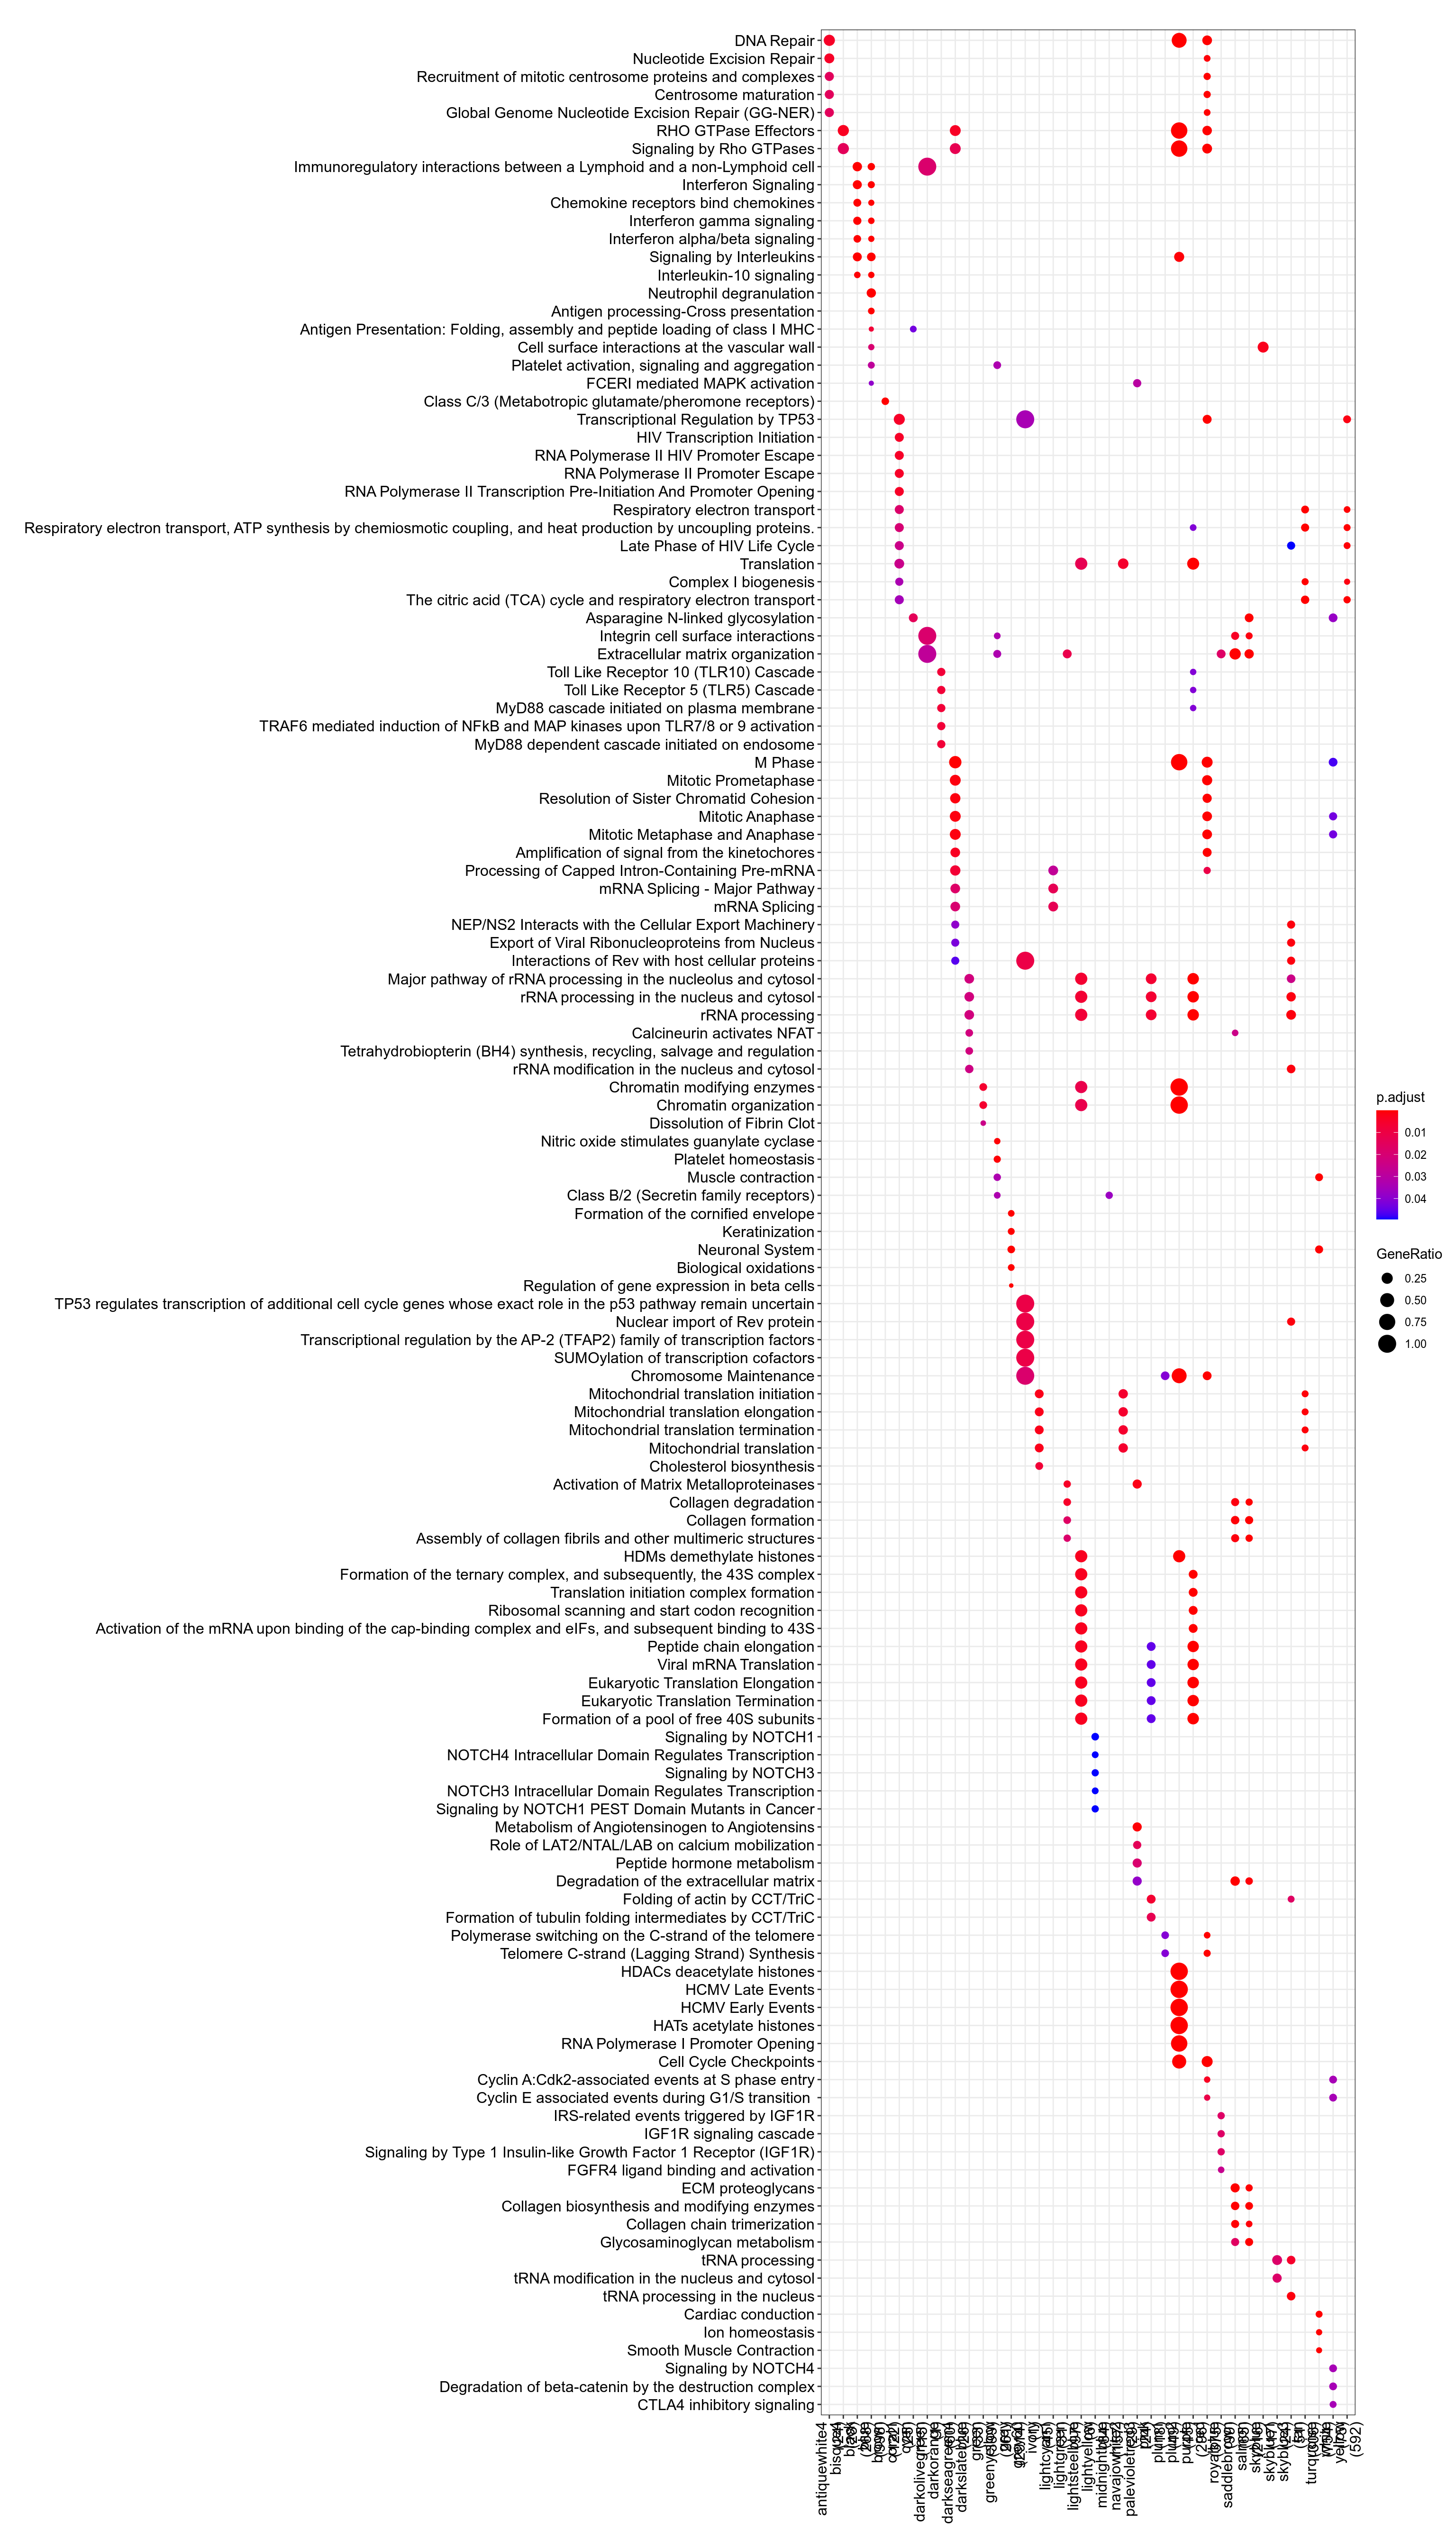
Figure 3.33: Pathway
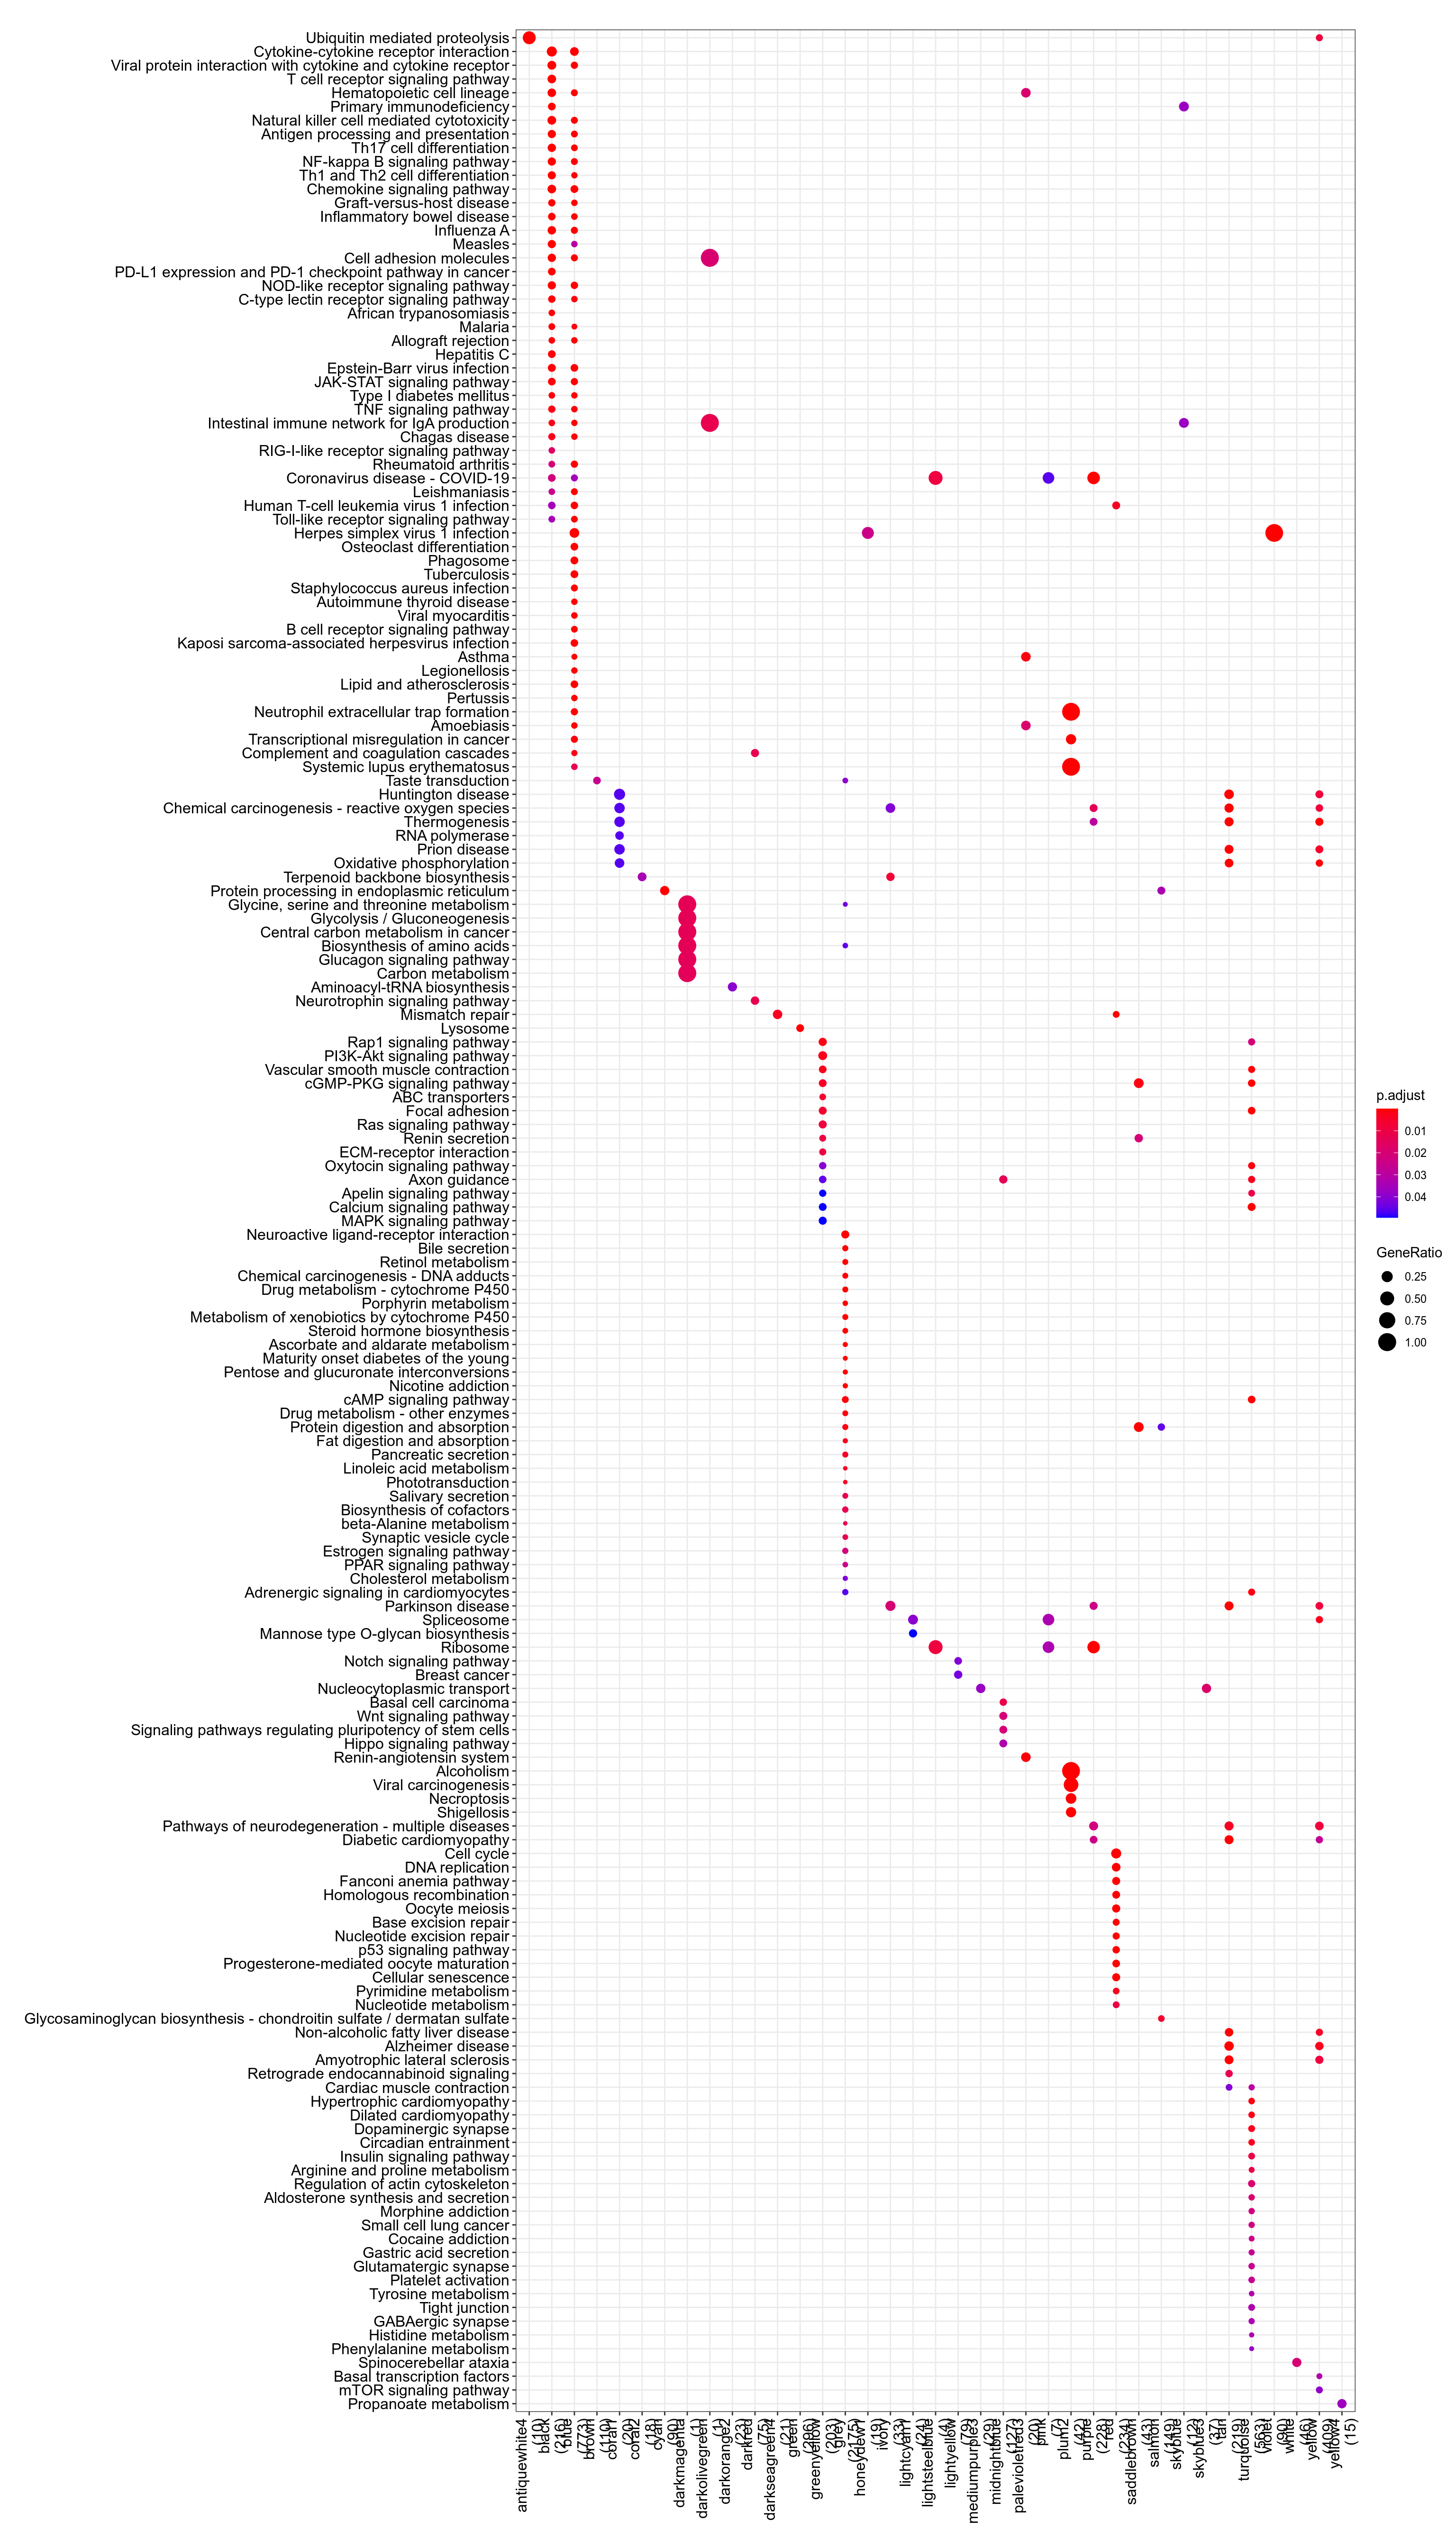
Figure 3.34: Kegg
.](_main_files/figure-html/resultsWgcnaProjectIdTcgaSarcKnitPlotEnrichHallmarks-1.png)
Figure 3.35: MSigDb Hallmarks. readable pdf version.
## No enriched DO term in these classesTo check that module-to-genes reattribution is working as expected, heatmap of signal for VNN1 module is produced, both as absolute values and as Z-score ones.
## VNN1 module contains more than 2000 genes. Heatmap generation is skippedVNN1 module contains more than 2000 genes. Heatmap generation is skipped
.](_main_files/figure-html/resultsWgcnaProjectIdTcgaSarcKnitPlotGenesInVNN1ModuleCorPearson-1.png)
Figure 3.36: Genes in VNN1 module plotted by Pearson correlation against it. Details are available in this table.
- Enrichr results for all genes in VNN1 module are available here
- Enrichr results for genes in VNN1 module and positively correlated with it are available here
- Enrichr results for genes in VNN1 module and negatively correlated with it are available here
- g:Profiler results for all genes in VNN1 module are available here
- g:Profiler results for genes in VNN1 module and positively correlated with it are available here
- g:Profiler results for genes in VNN1 module and negatively correlated with it are available here
- g:Profiler results for comparison of the three queries above are available here