3.2.4 Synthesis
For each dataset, only the module with the lowest p-value is kept in order to highlight biological functions found in each cancer type. the results are first ordered by alphabetical order for hallmarks, then ordered by significant occurence in dataset. Finally, color scale are log10-transformed for q-value to highlight most significant hallmarks and subtle differences between datasets.
3.2.4.1 Hallmarks
The xlsx table for the qvalues of all significant Hallmarks gene sets is available here.
3.2.4.1.1 Alphabetically-ordered hallmarks and all datasets
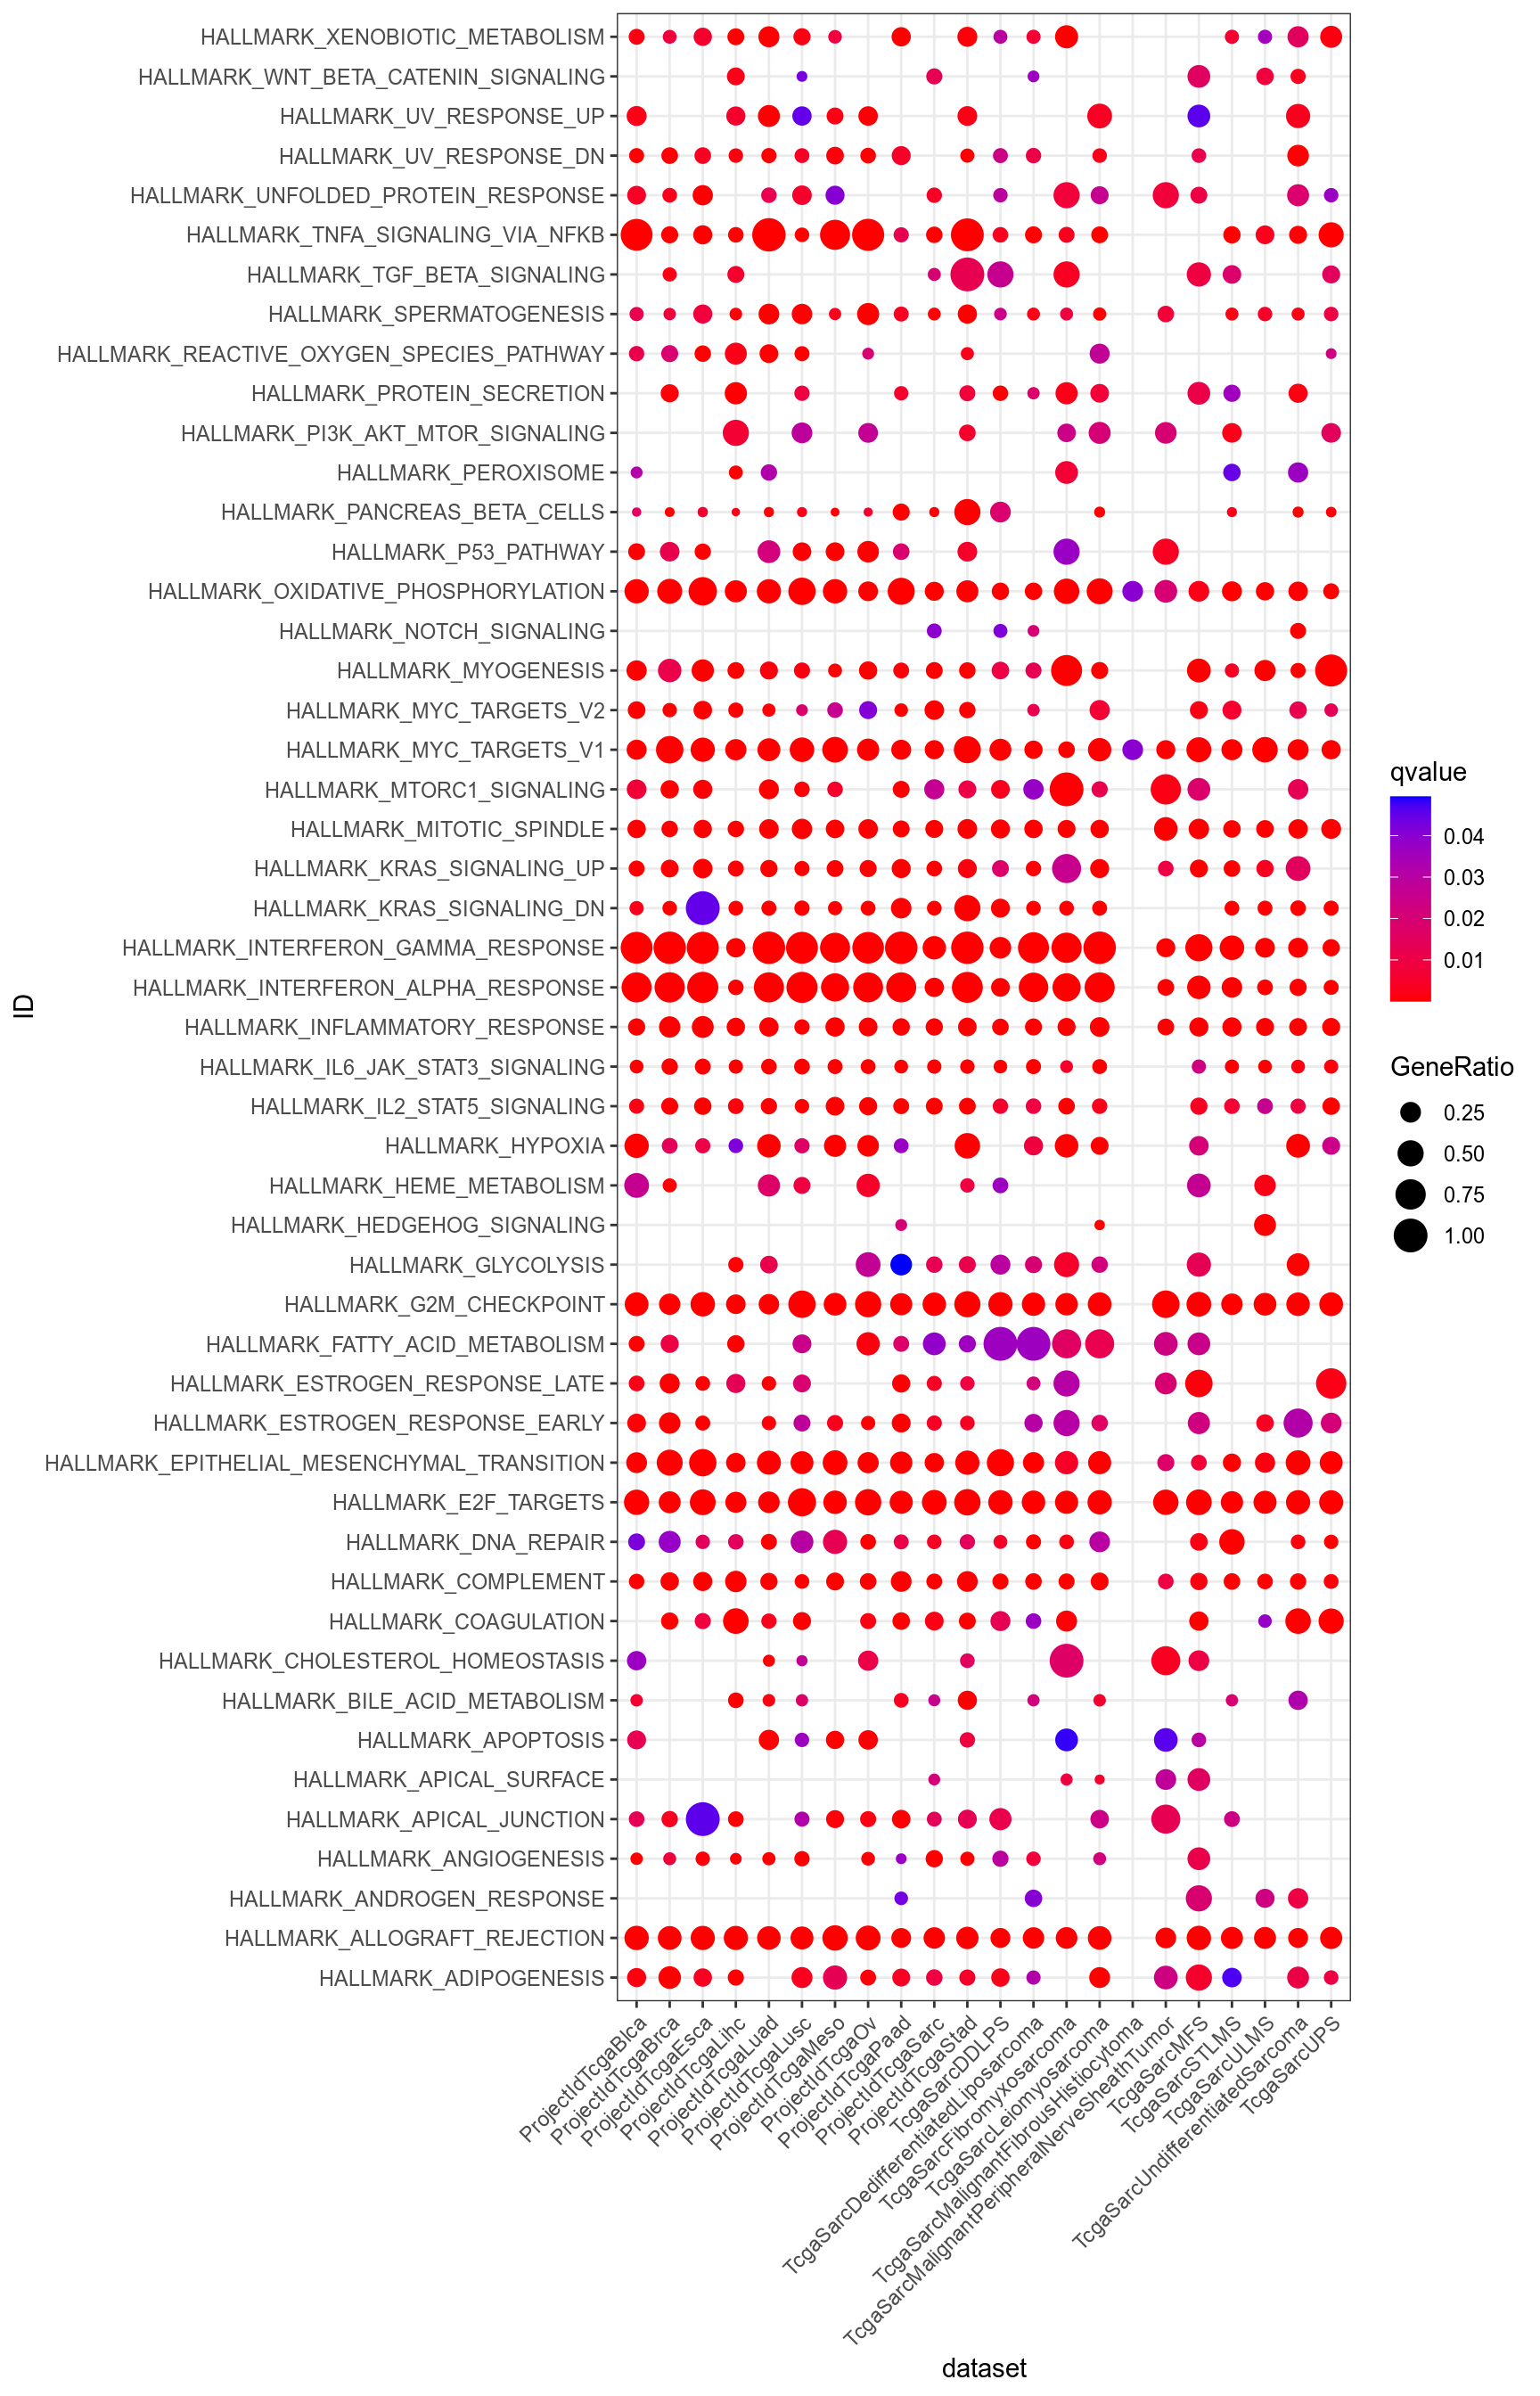
Figure 3.143: Dotplot for Hallmarks significant (q-value < 0.05) in at least one dataset.

Figure 3.144: Dotplot for Hallmarks which are significant (q-value < 0.05) in at least one dataset and non ubiquitous, i.e. not significant for all datasets.
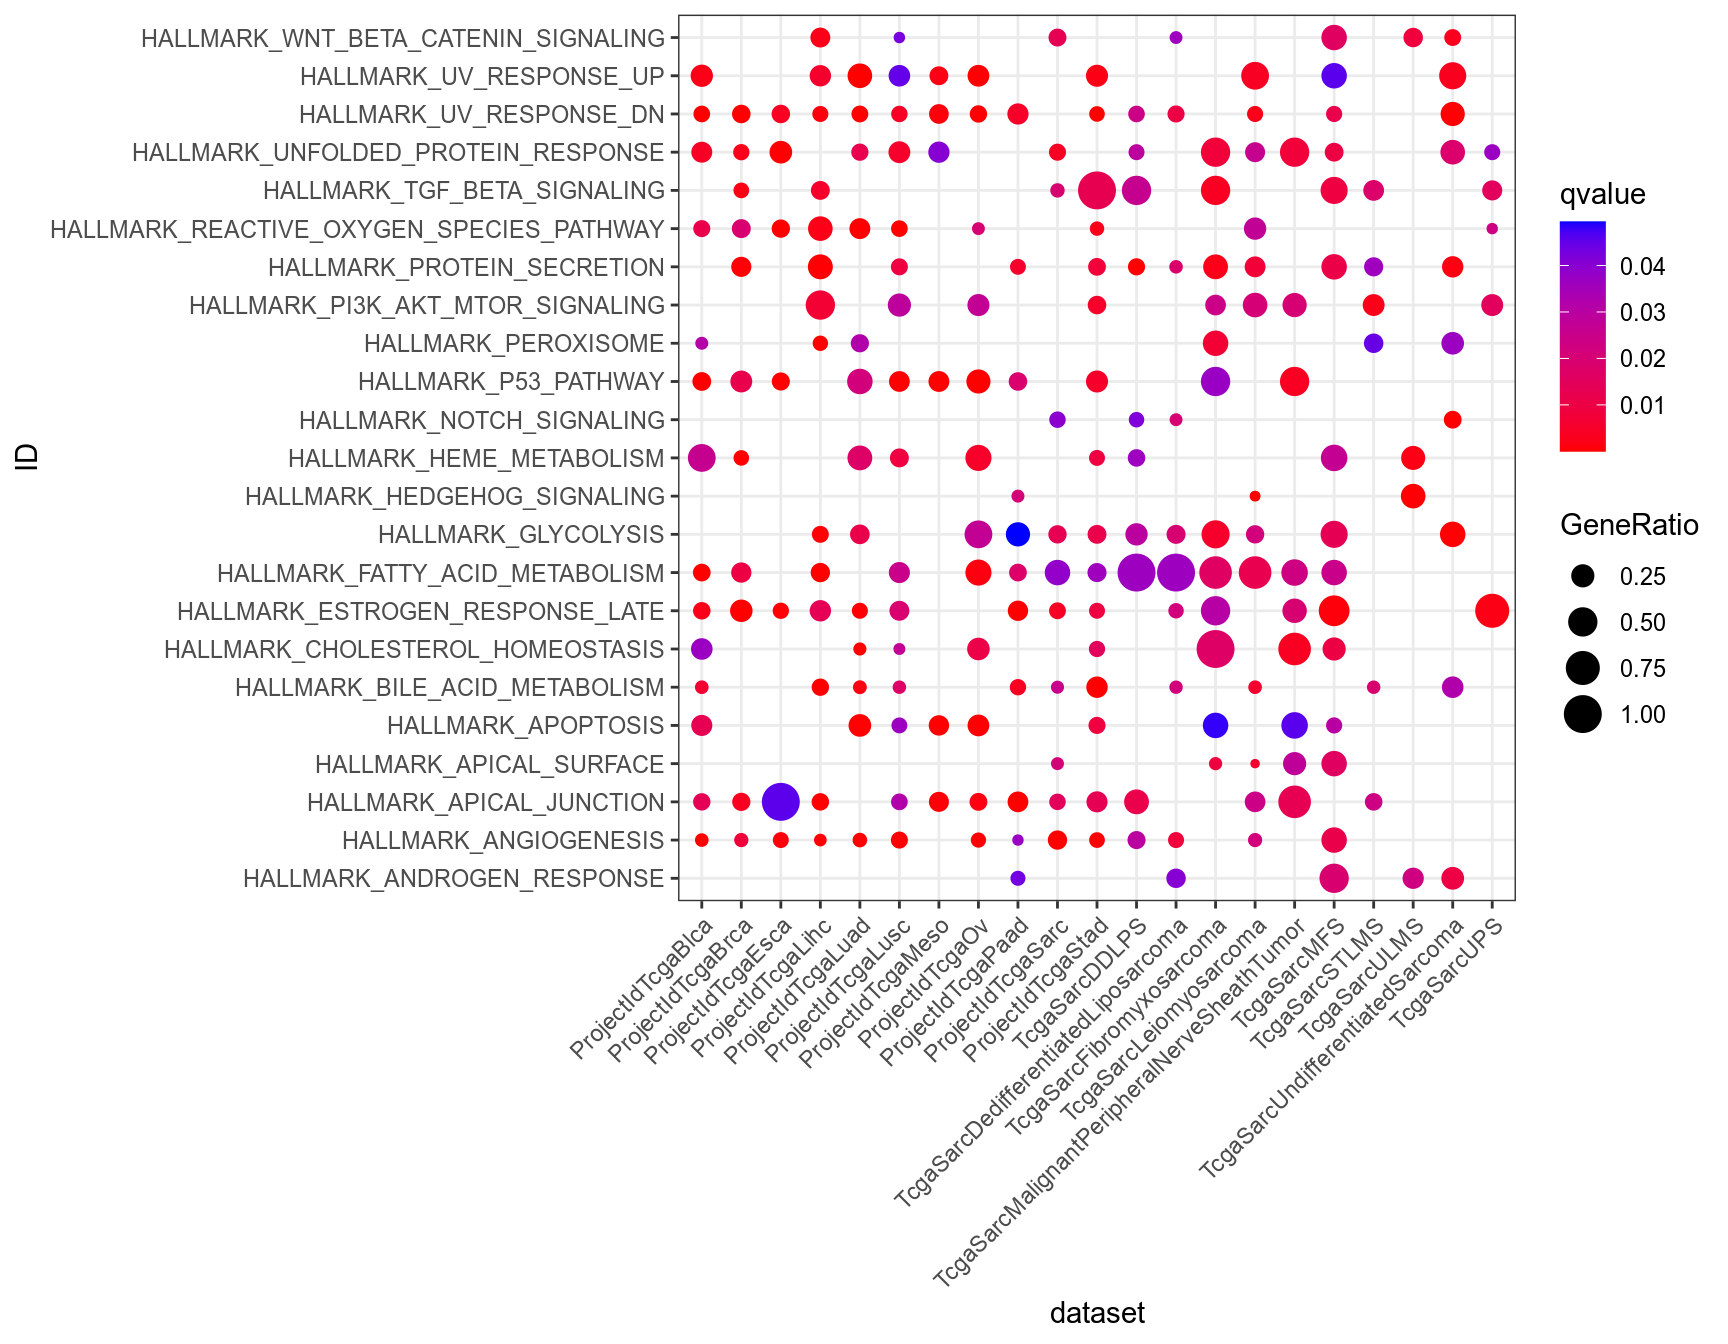
Figure 3.145: Dotplot for Hallmarks which are significant (q-value < 0.05) in at least one dataset, and uncommon, i.e. significant in less than half the datasets.

Figure 3.146: Dotplot for Hallmarks of interest (provided by Philipe Naquet).
3.2.4.1.2 Occurency-ordered hallmarks and all datasets

Figure 3.147: Dotplot for Hallmarks significant (q-value < 0.05) in at least one dataset.

Figure 3.148: Dotplot for Hallmarks which are significant (q-value < 0.05) in at least one dataset and non ubiquitous, i.e. not significant for all datasets.

Figure 3.149: Dotplot for Hallmarks which are significant (q-value < 0.05) in at least one dataset, and uncommon, i.e. significant in less than half the datasets.

Figure 3.150: Dotplot for Hallmarks of interest (provided by Philipe Naquet).
3.2.4.1.3 Log10 transformed color scale
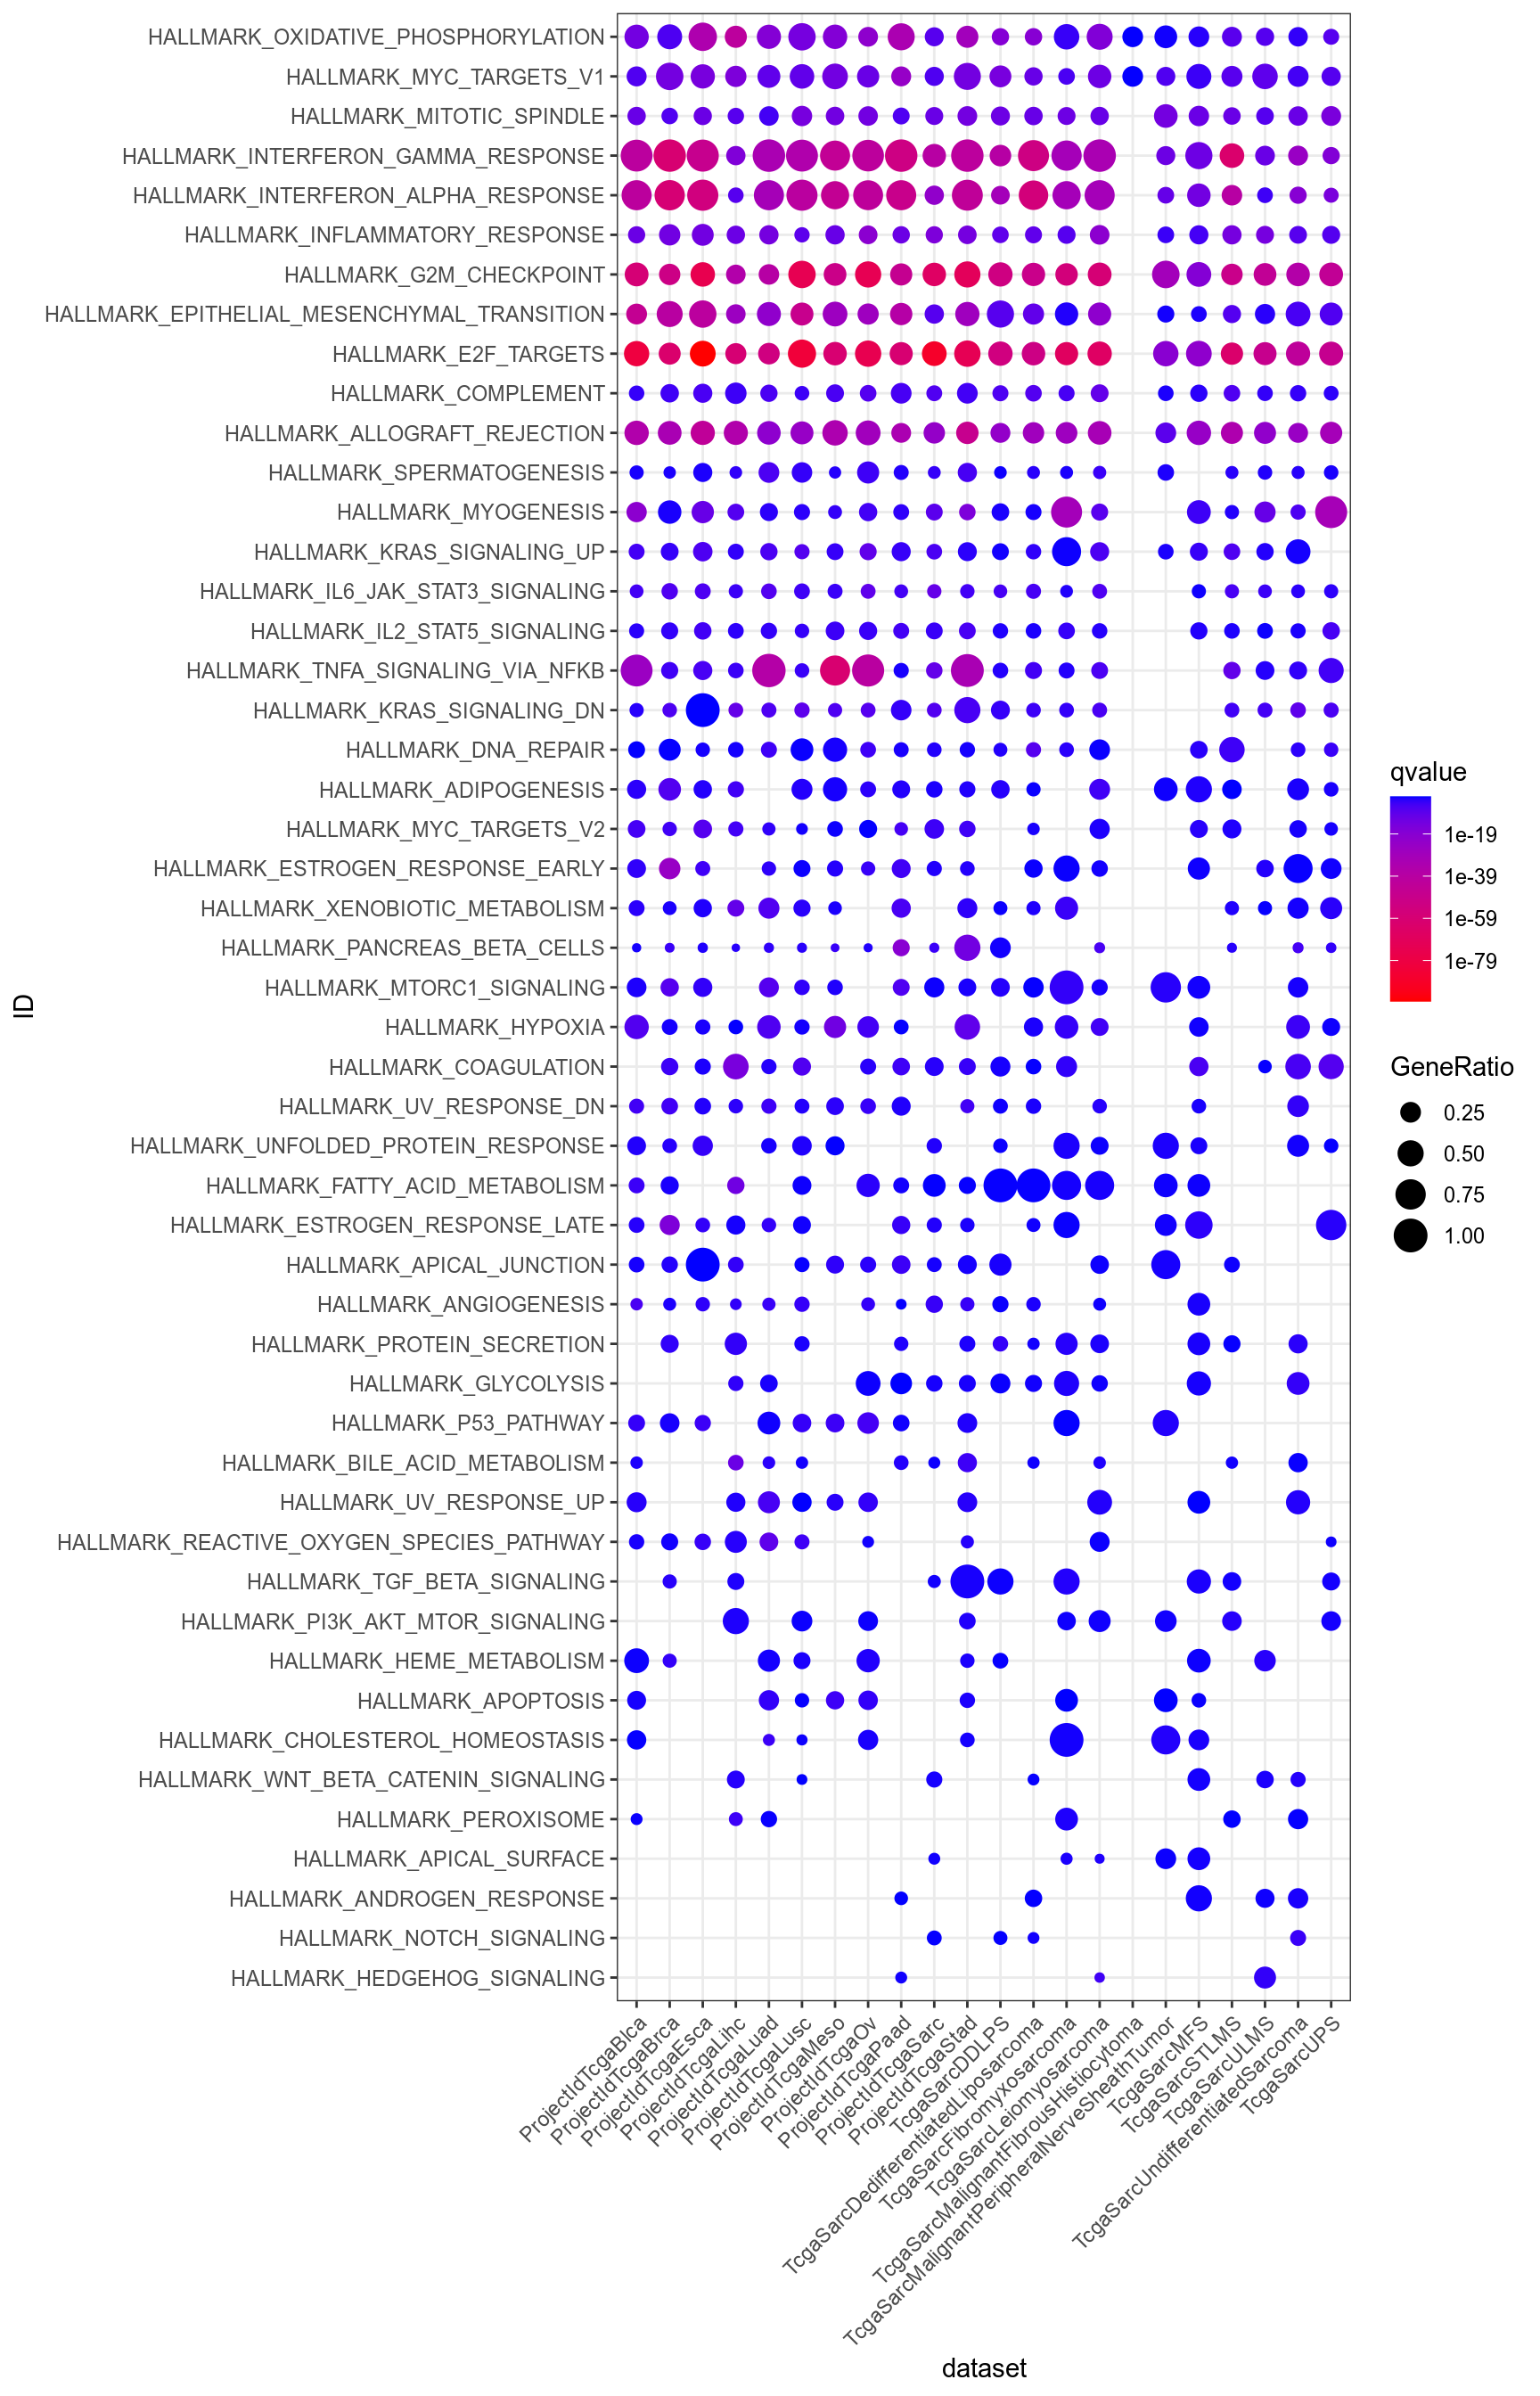
Figure 3.151: Dotplot for Hallmarks significant (q-value < 0.05) in at least one dataset.

Figure 3.152: Dotplot for Hallmarks which are significant (q-value < 0.05) in at least one dataset and non ubiquitous, i.e. not significant for all datasets.
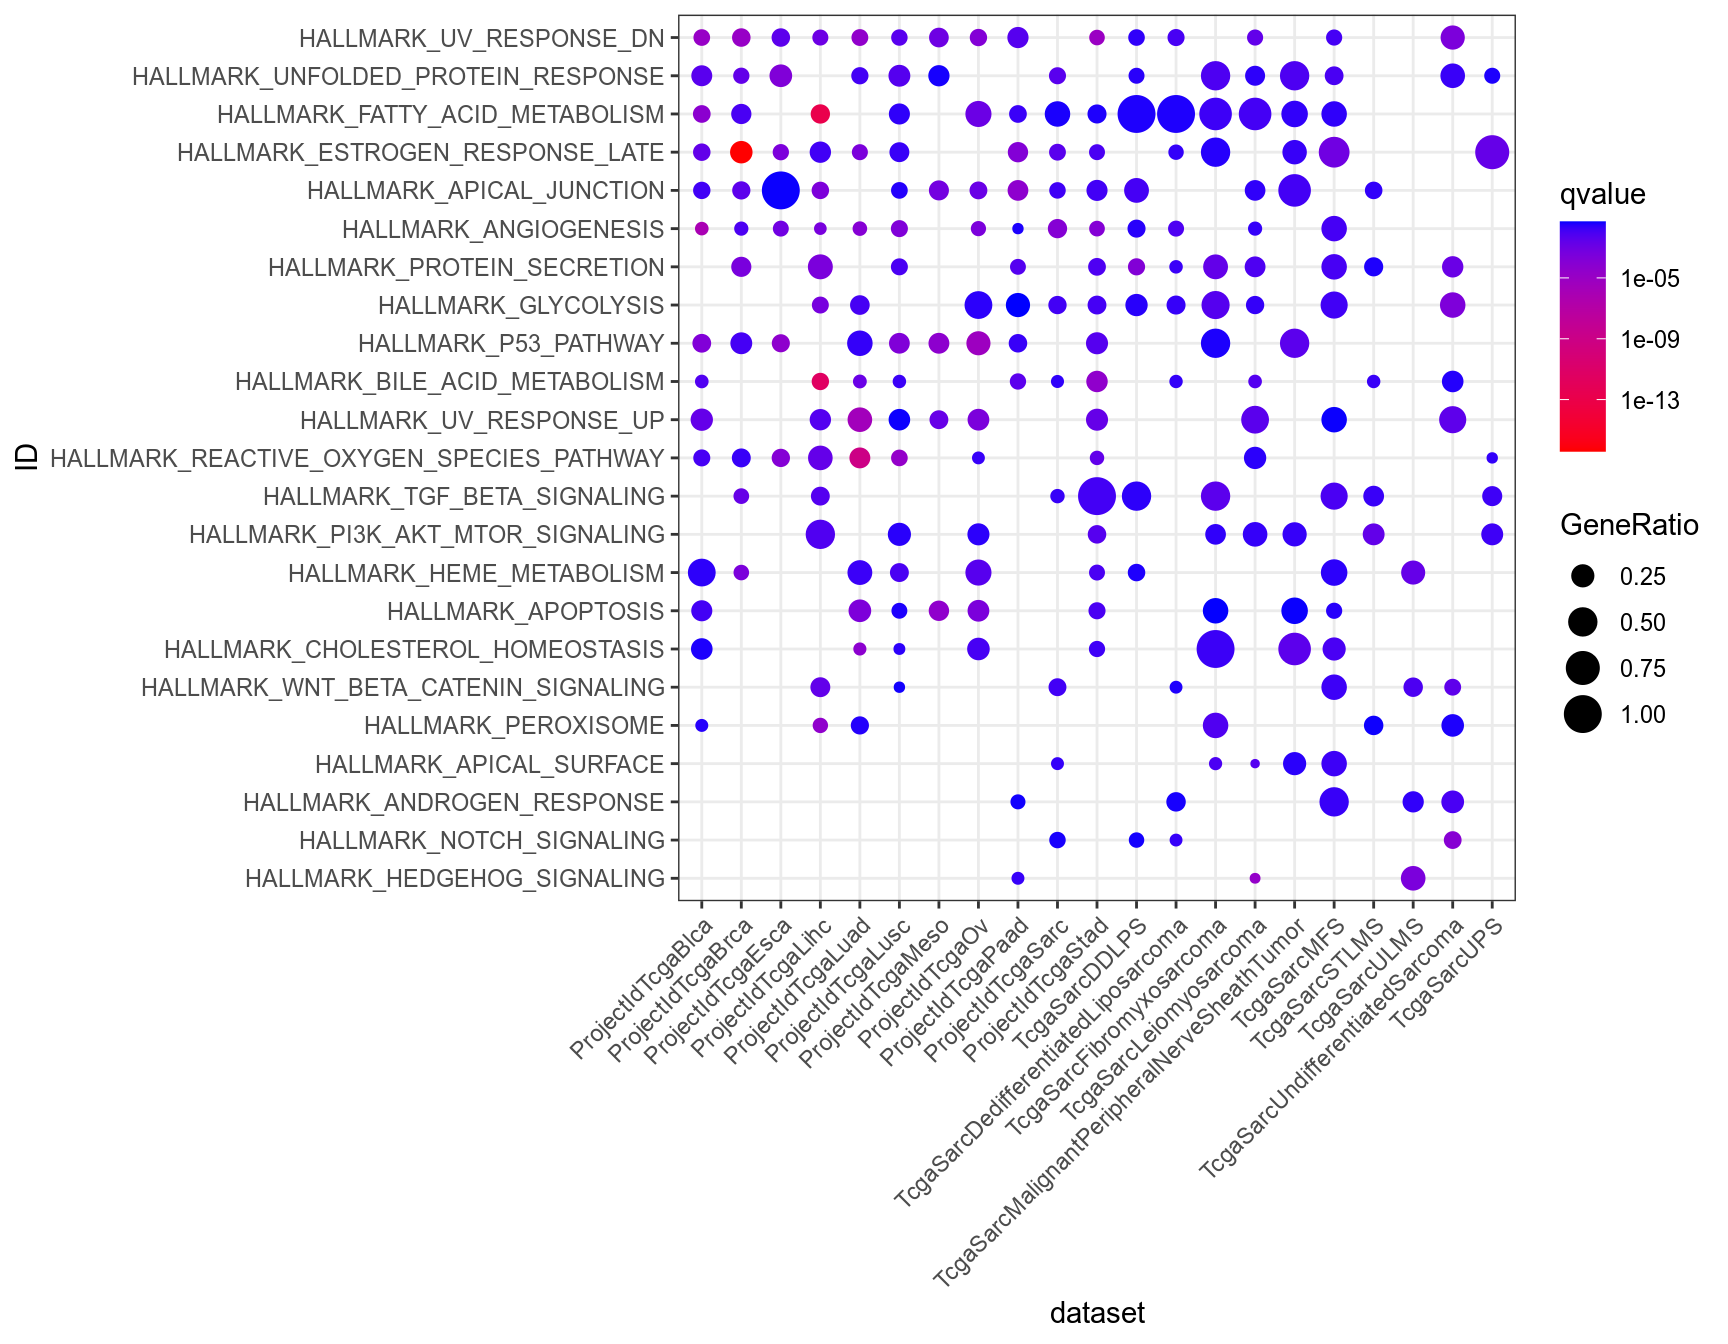
Figure 3.153: Dotplot for Hallmarks which are significant (q-value < 0.05) in at least one dataset, and uncommon, i.e. significant in less than half the datasets.
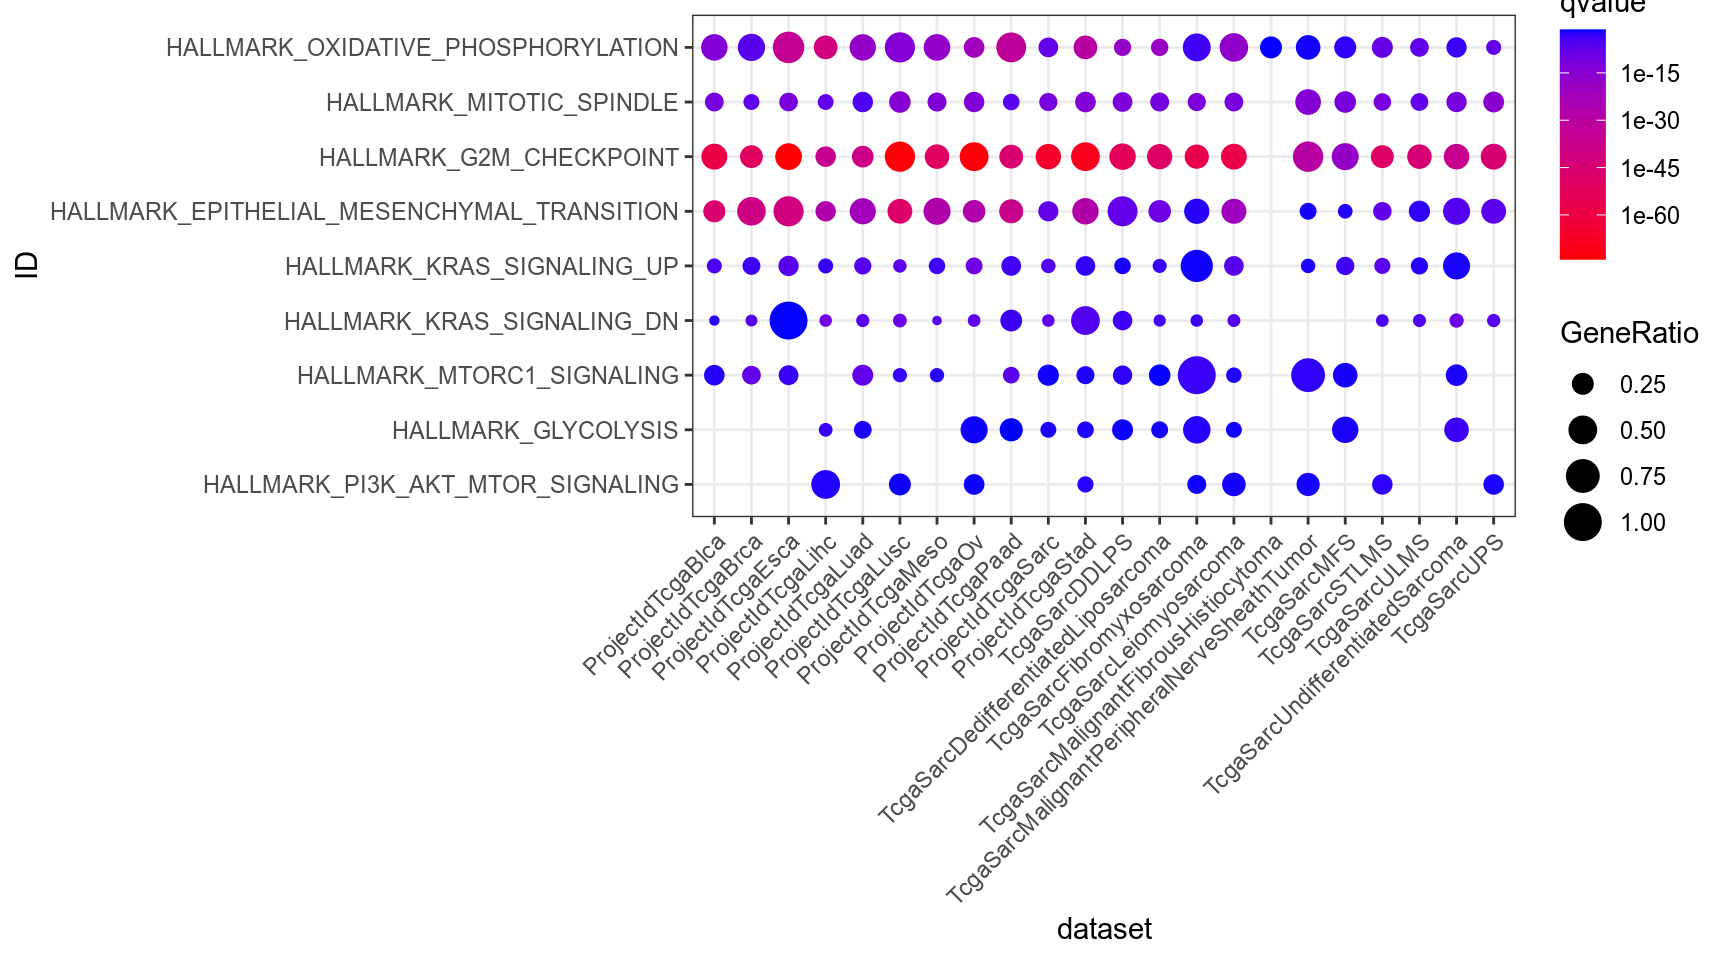
Figure 3.154: Dotplot for Hallmarks of interest (provided by Philipe Naquet).