3.2.1.4 TCGA-OV dataset
There are 36886 genes and 173 samples in the dataset.
All samples and genes look good for the analysis.
##    Power SFT.R.sq  slope truncated.R.sq  mean.k. median.k.  max.k.
## 1      1   0.0468 -0.827          0.963 4.84e+03  4.70e+03 9030.00
## 2      3   0.8240 -2.430          0.994 2.98e+02  2.37e+02 1620.00
## 3      5   0.9120 -2.360          0.996 4.23e+01  2.27e+01  548.00
## 4      7   0.9100 -2.180          0.990 9.92e+00  3.08e+00  244.00
## 5      9   0.9090 -2.010          0.987 3.24e+00  5.55e-01  127.00
## 6     11   0.9010 -1.900          0.991 1.33e+00  1.29e-01   73.70
## 7     13   0.9050 -1.790          0.993 6.40e-01  3.50e-02   45.80
## 8     15   0.9090 -1.710          0.996 3.45e-01  1.05e-02   30.00
## 9     17   0.9100 -1.650          0.996 2.03e-01  3.41e-03   20.50
## 10    19   0.9110 -1.590          0.991 1.28e-01  1.17e-03   14.50
## 11    21   0.9240 -1.520          0.990 8.52e-02  4.15e-04   10.50
## 12    23   0.9540 -1.450          0.996 5.92e-02  1.51e-04    7.84
## 13    25   0.9650 -1.420          0.997 4.26e-02  5.67e-05    6.13
## 14    27   0.9150 -1.470          0.974 3.16e-02  2.17e-05    5.33
## 15    29   0.9230 -1.480          0.988 2.41e-02  8.36e-06    4.68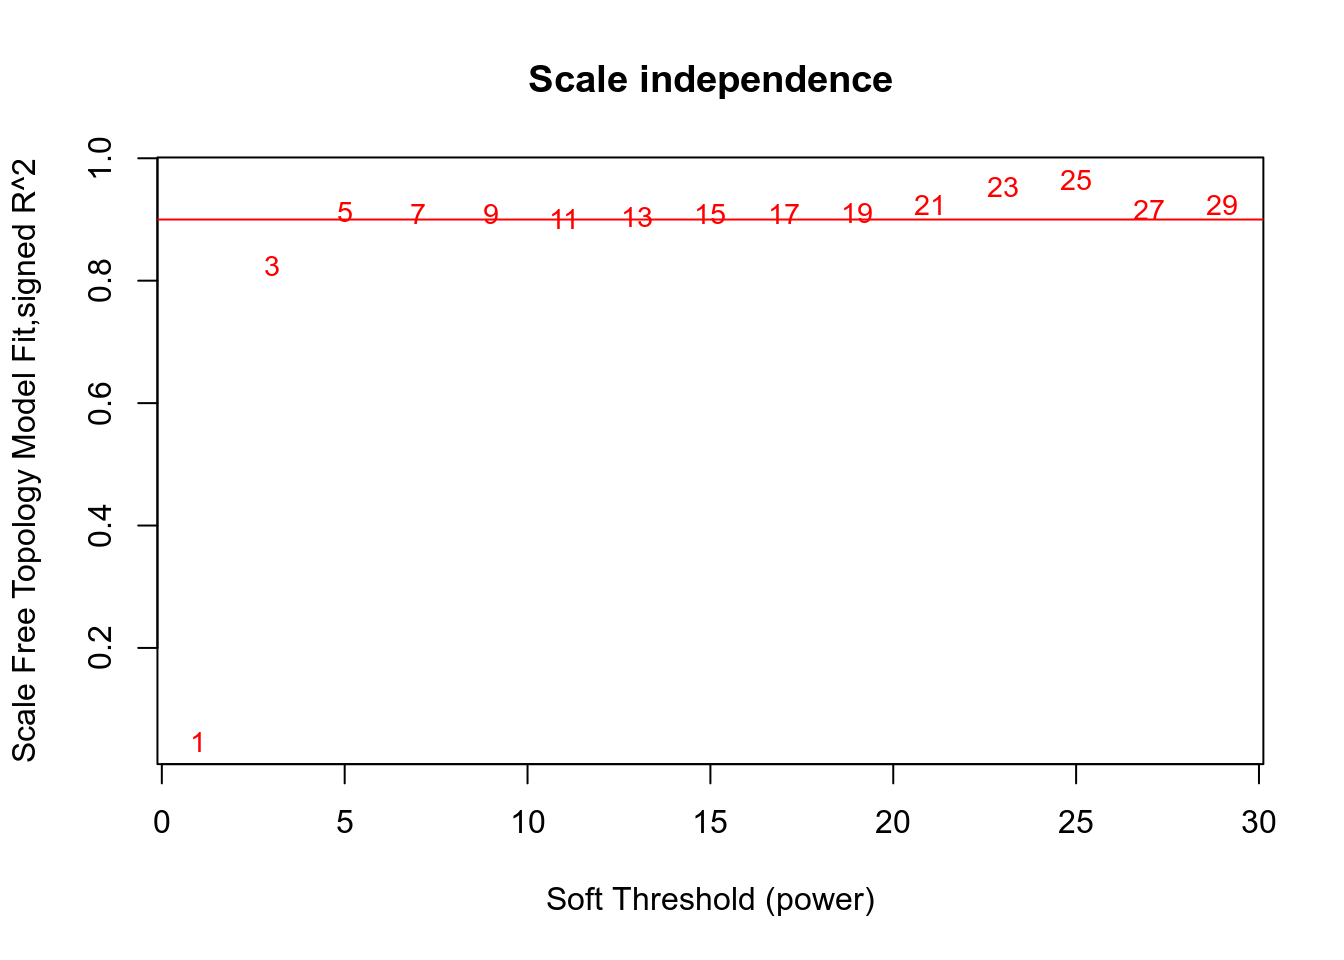
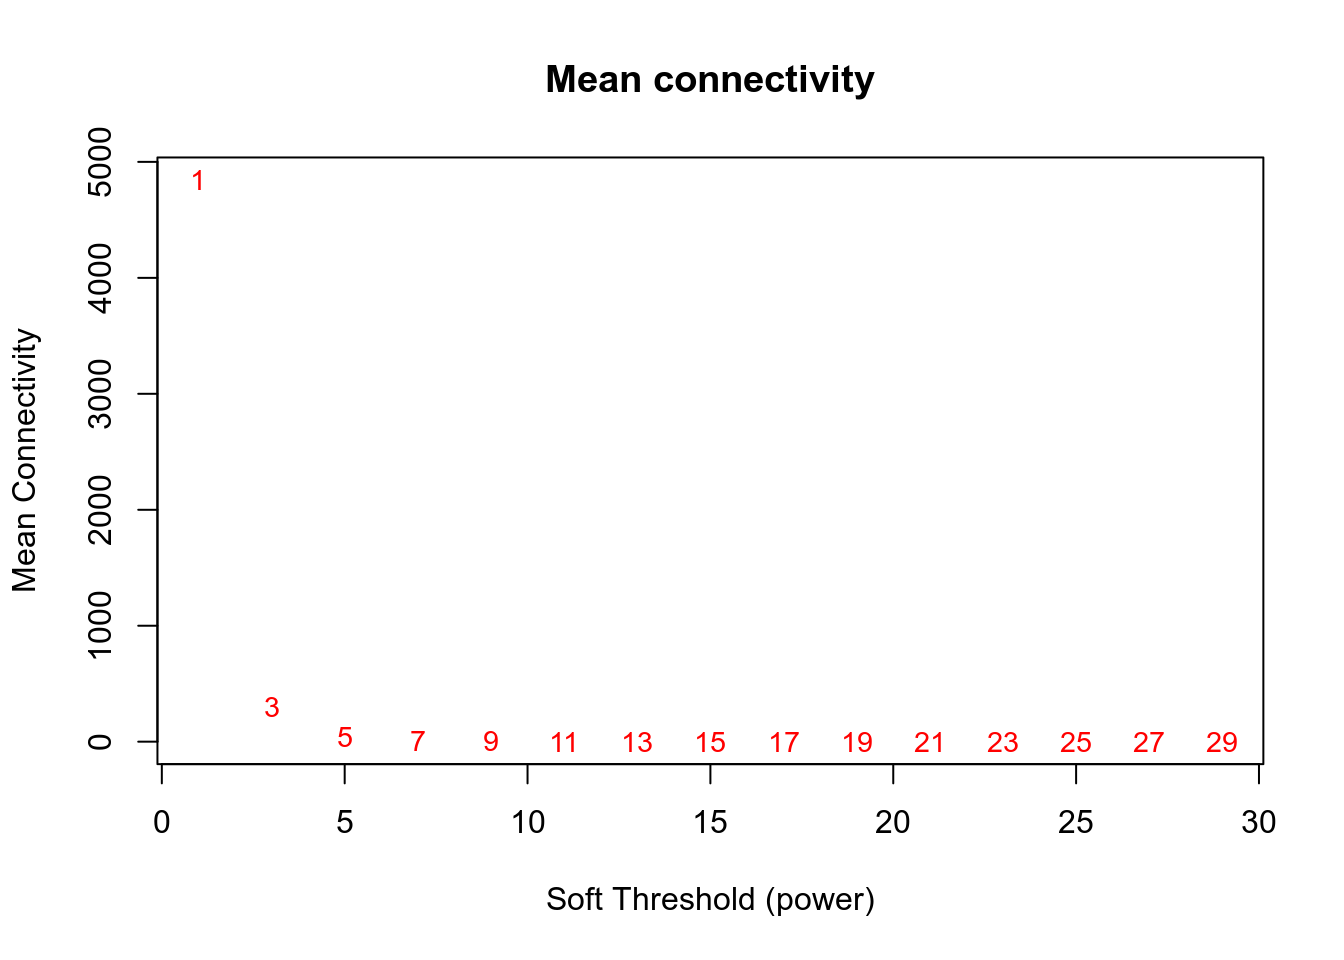
Network is computed using power=5.
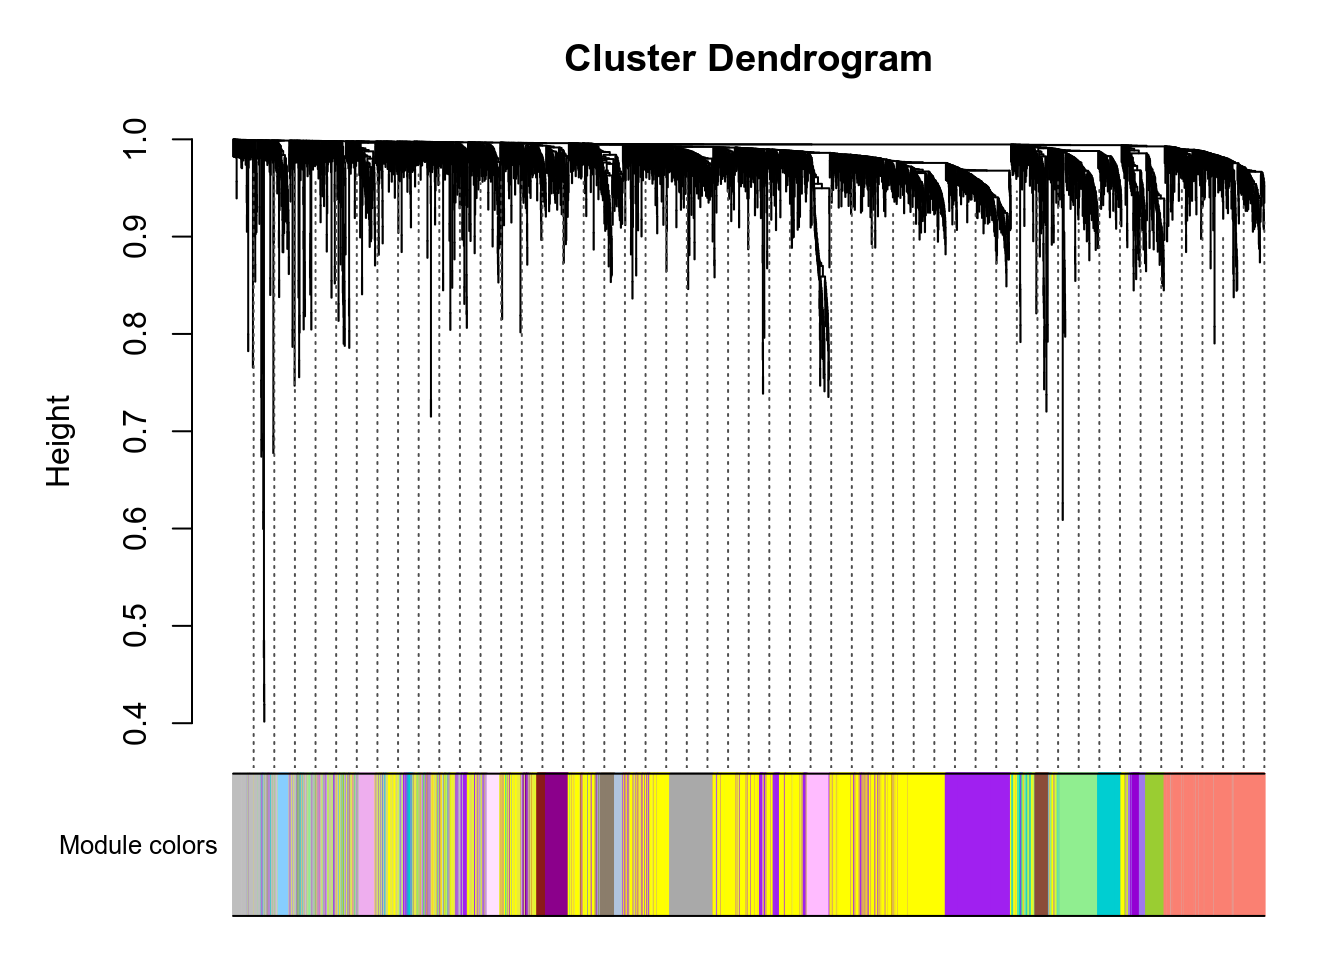
Here are the modules for a few genes of interest:
- VNN1 is in the turquoise module.
- PPARA is in the purple module.
- PPARD is in the brown module.
- PPARG is in the turquoise module.
- PPARGC1A is in the turquoise module.
- PPARGC1B is in the thistle1 module.
g:Profiler results for all modules are available here. Since there are many modules, you should expect at least 1 minute computation on the g:Profiler website for this query. Check below for faster queries focused on VNN1 module.
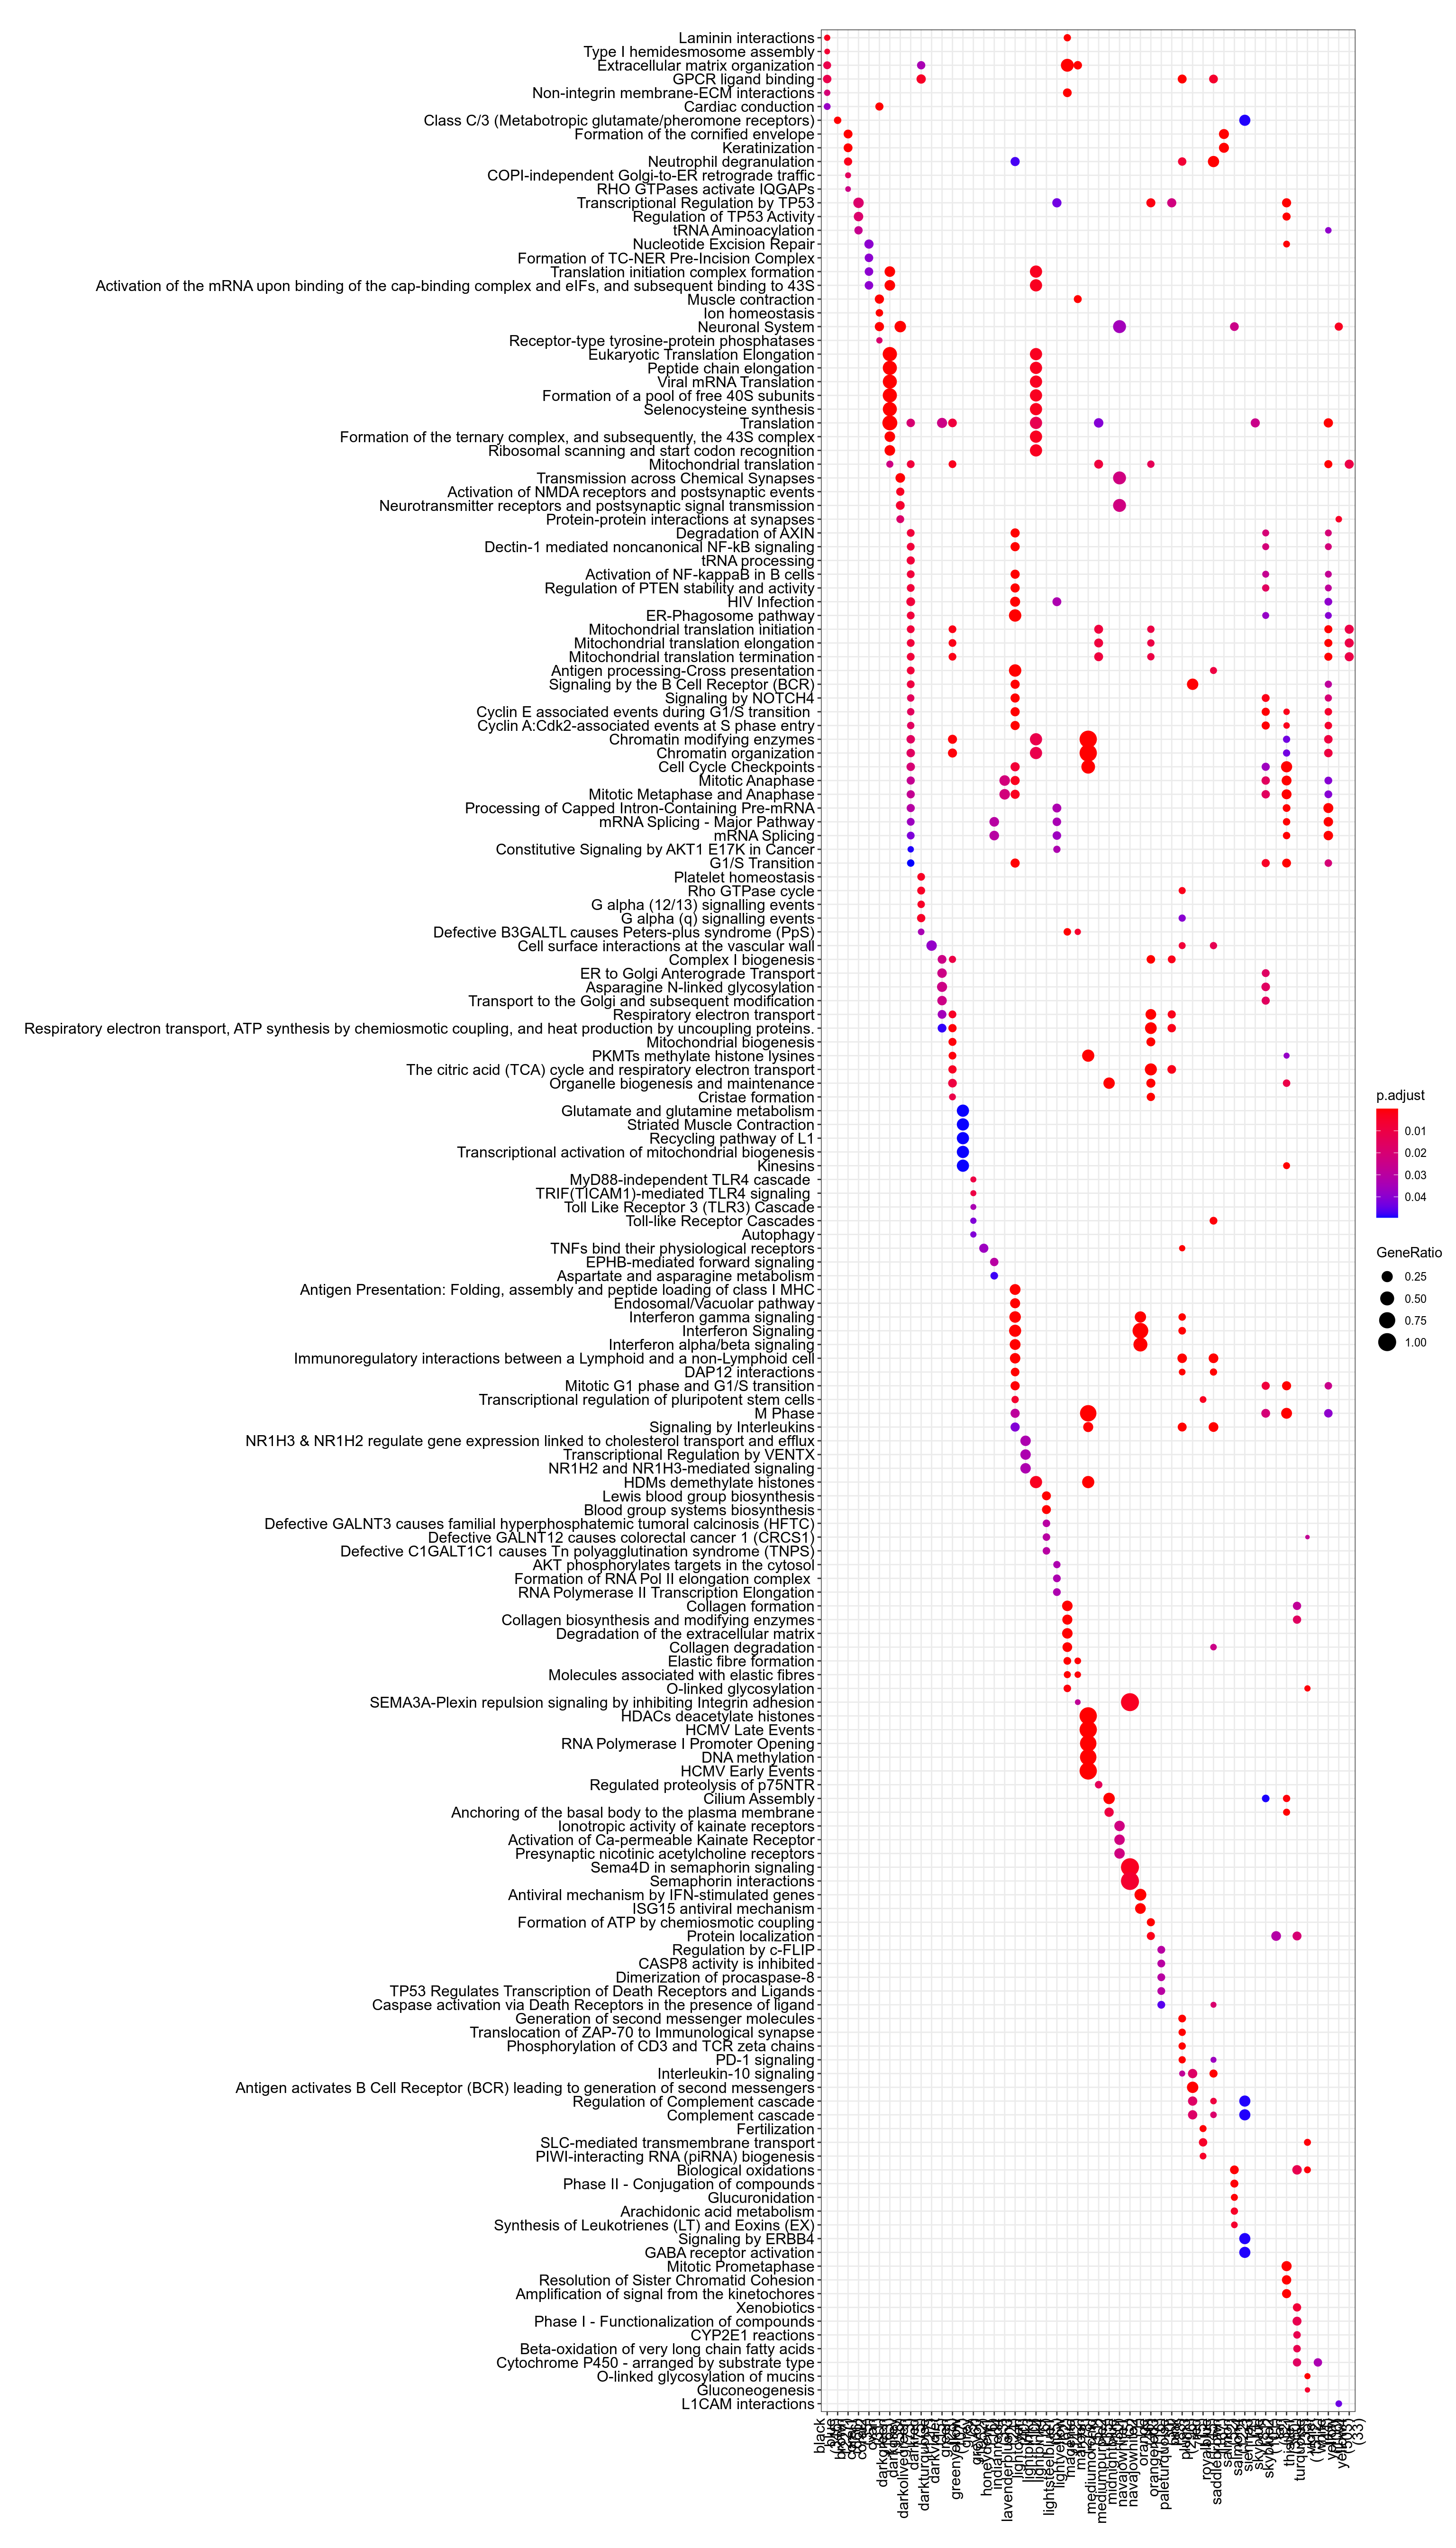
Figure 3.49: Pathway
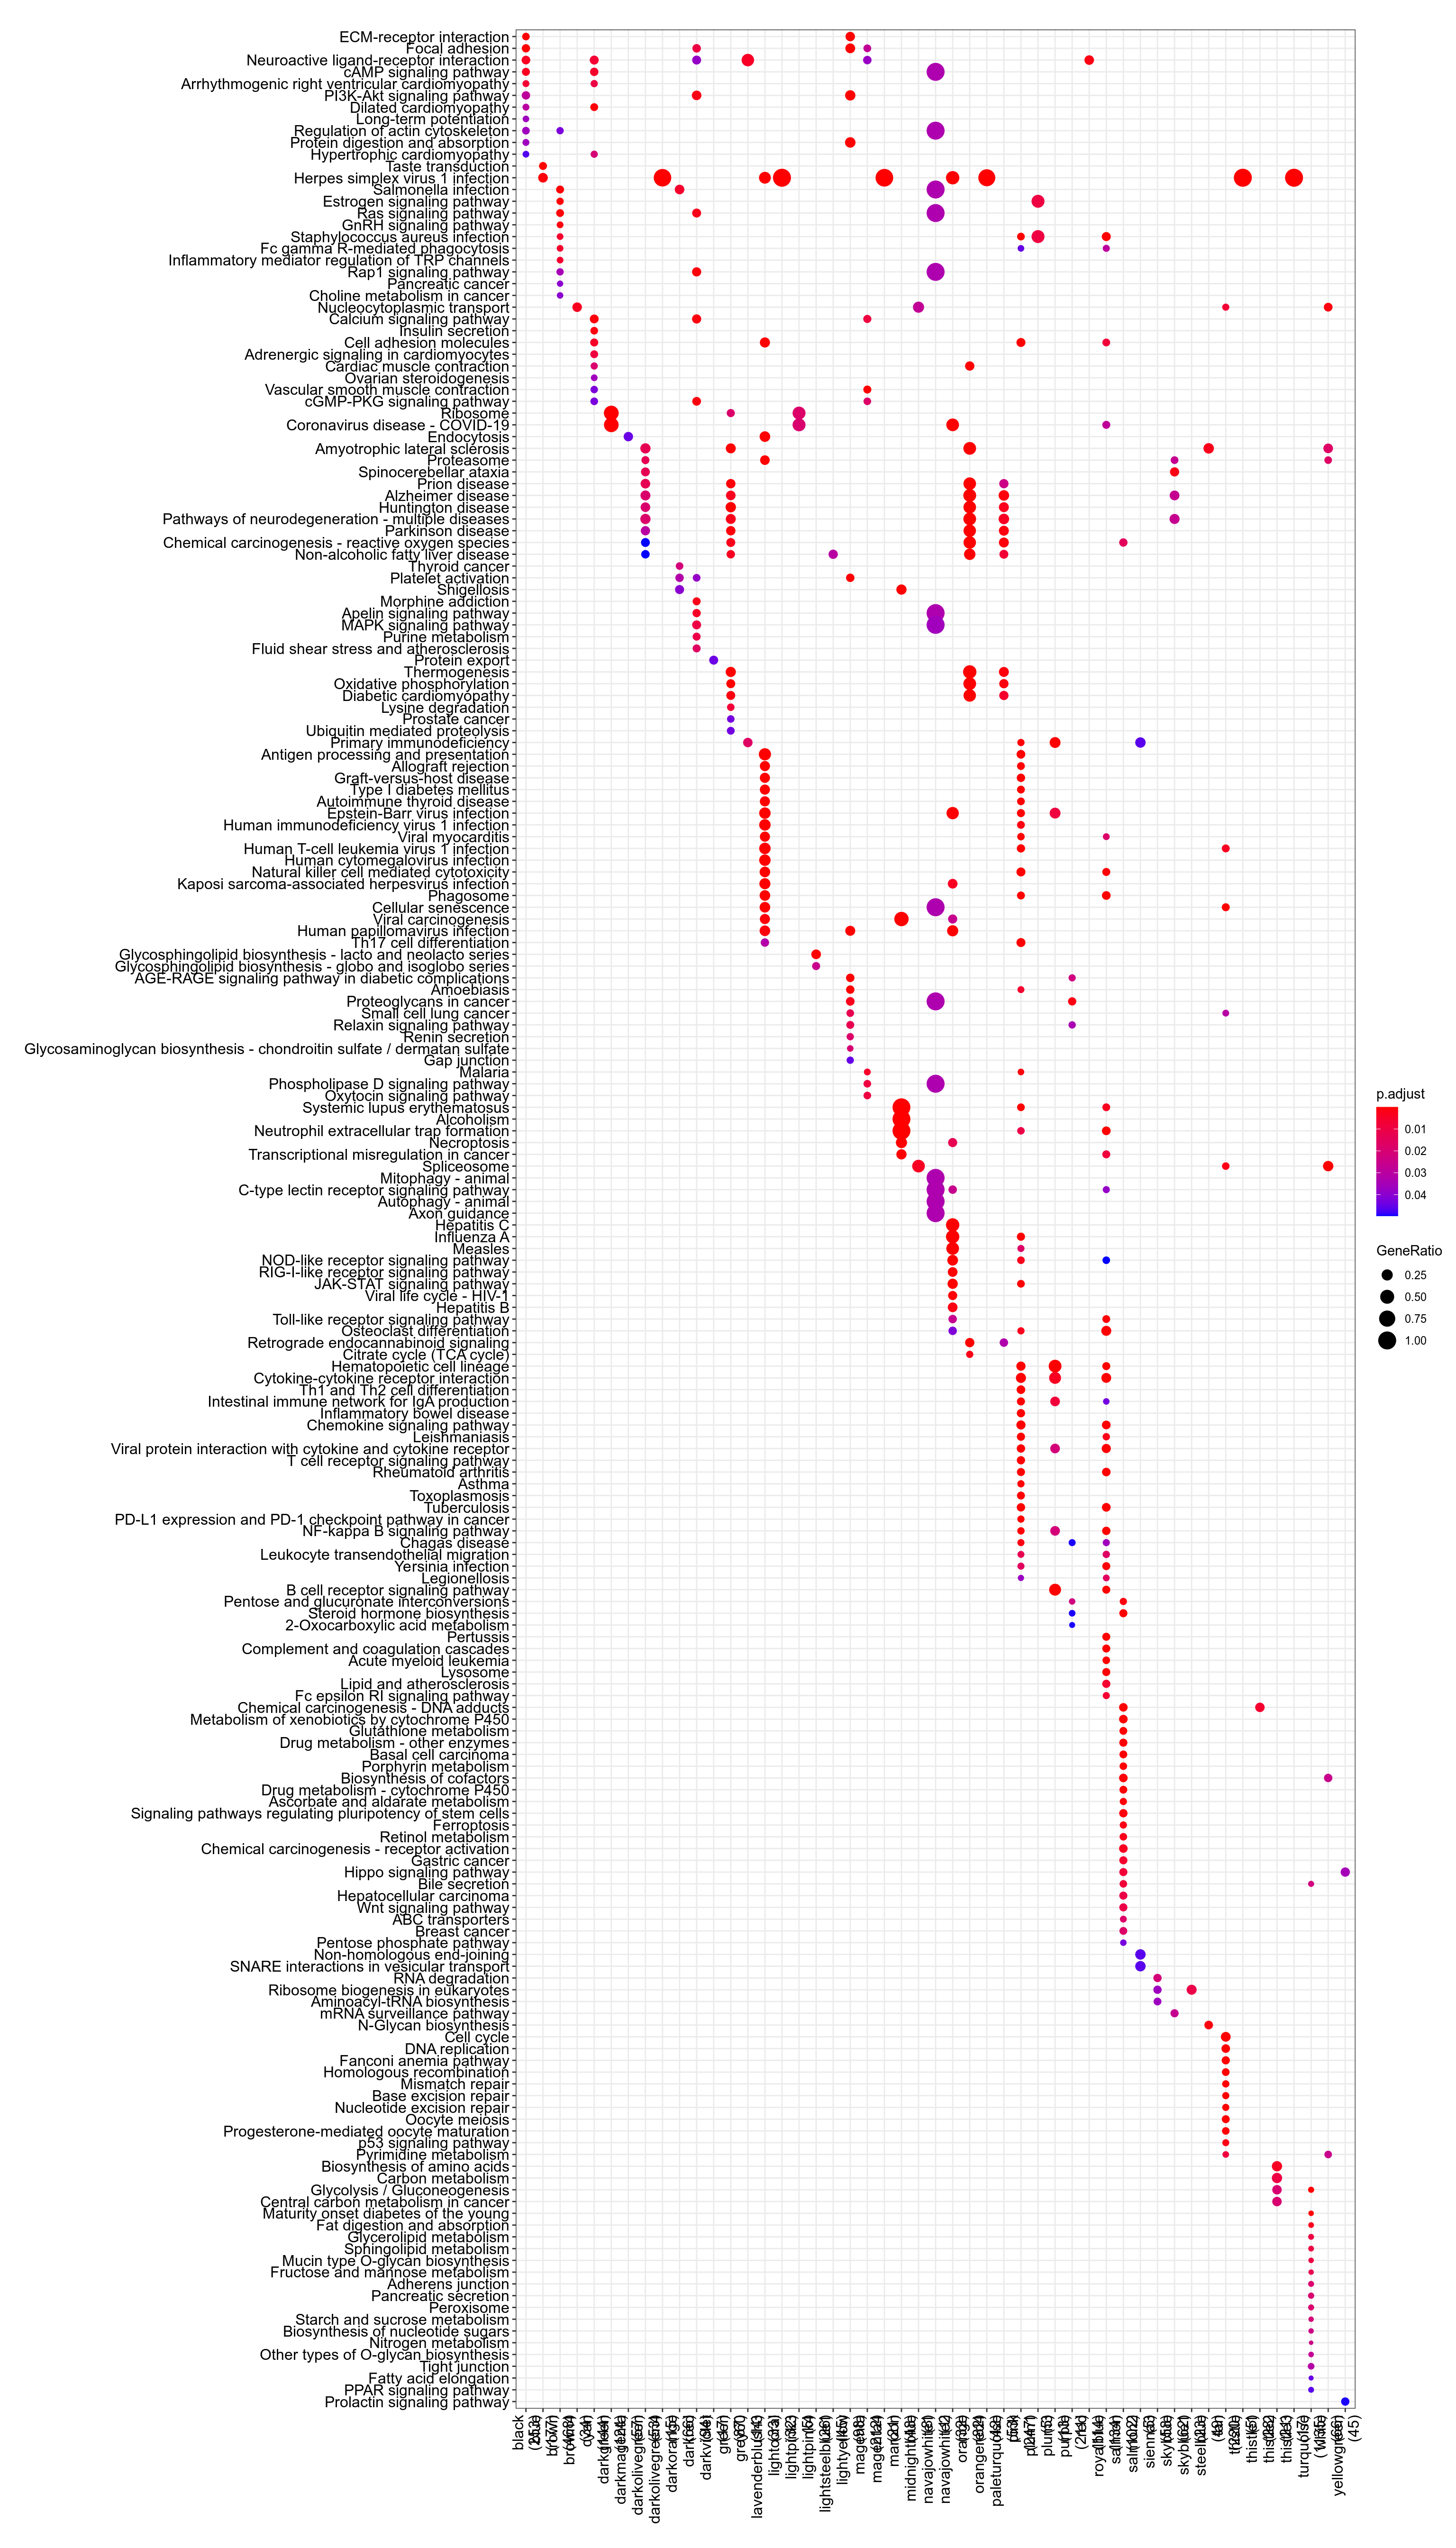
Figure 3.50: Kegg
.](_main_files/figure-html/resultsWgcnaProjectIdTcgaEscaKnitPlotEnrichHallmarks-1.png)
Figure 3.51: MSigDb Hallmarks. readable pdf version.
## No enriched DO term in these classesTo check that module-to-genes reattribution is working as expected, heatmap of signal for VNN1 module is produced, both as absolute values and as Z-score ones.
## VNN1 module contains more than 2000 genes. Heatmap generation is skippedVNN1 module contains more than 2000 genes. Heatmap generation is skipped
.](_main_files/figure-html/resultsWgcnaProjectIdTcgaEscaKnitPlotGenesInVNN1ModuleCorPearson-1.png)
Figure 3.52: Genes in VNN1 module plotted by Pearson correlation against it. Details are available in this table.
- Enrichr results for all genes in VNN1 module are available here
- Enrichr results for genes in VNN1 module and positively correlated with it are available here
- Enrichr results for genes in VNN1 module and negatively correlated with it are available here
- g:Profiler results for all genes in VNN1 module are available here
- g:Profiler results for genes in VNN1 module and positively correlated with it are available here
- g:Profiler results for genes in VNN1 module and negatively correlated with it are available here
- g:Profiler results for comparison of the three queries above are available here