3.2.1.3 TCGA-BRCA dataset
There are 36886 genes and 1221 samples in the dataset.
At least some samples or genes look not suitable for the co-expression analysis. After removing them, there remain 36885 genes and 1221 samples.
##    Power SFT.R.sq   slope truncated.R.sq  mean.k. median.k.  max.k.
## 1      1  0.00135  0.0816          0.932 3.77e+03  3.73e+03 7300.00
## 2      3  0.70600 -1.9100          0.954 1.85e+02  1.37e+02  972.00
## 3      5  0.79600 -1.9000          0.963 2.50e+01  1.03e+01  248.00
## 4      7  0.87800 -1.9000          0.992 5.92e+00  1.15e+00  118.00
## 5      9  0.93100 -1.7900          0.997 1.98e+00  1.82e-01   73.70
## 6     11  0.94900 -1.6800          0.998 8.39e-01  3.62e-02   50.20
## 7     13  0.95500 -1.5900          0.997 4.19e-01  8.38e-03   36.70
## 8     15  0.95700 -1.5200          0.994 2.36e-01  2.14e-03   27.80
## 9     17  0.94300 -1.4900          0.990 1.44e-01  5.80e-04   21.70
## 10    19  0.94100 -1.4600          0.988 9.37e-02  1.66e-04   17.40
## 11    21  0.94200 -1.4300          0.984 6.39e-02  4.91e-05   14.20
## 12    23  0.93500 -1.4200          0.981 4.52e-02  1.45e-05   11.80
## 13    25  0.93900 -1.4100          0.983 3.29e-02  4.48e-06    9.88
## 14    27  0.93000 -1.4100          0.974 2.45e-02  1.40e-06    8.39
## 15    29  0.92500 -1.4100          0.967 1.86e-02  4.43e-07    7.20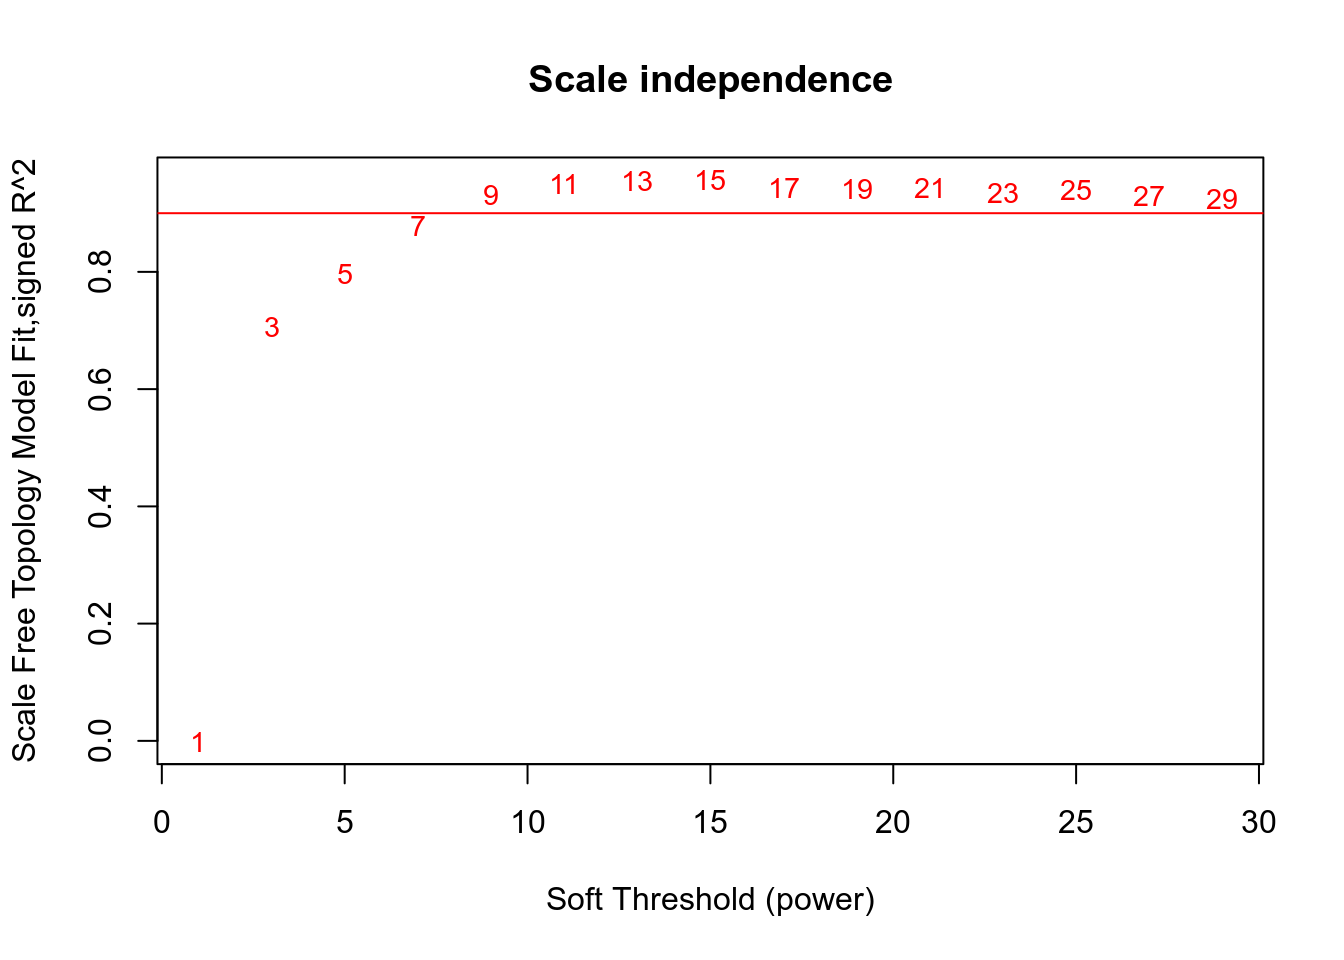
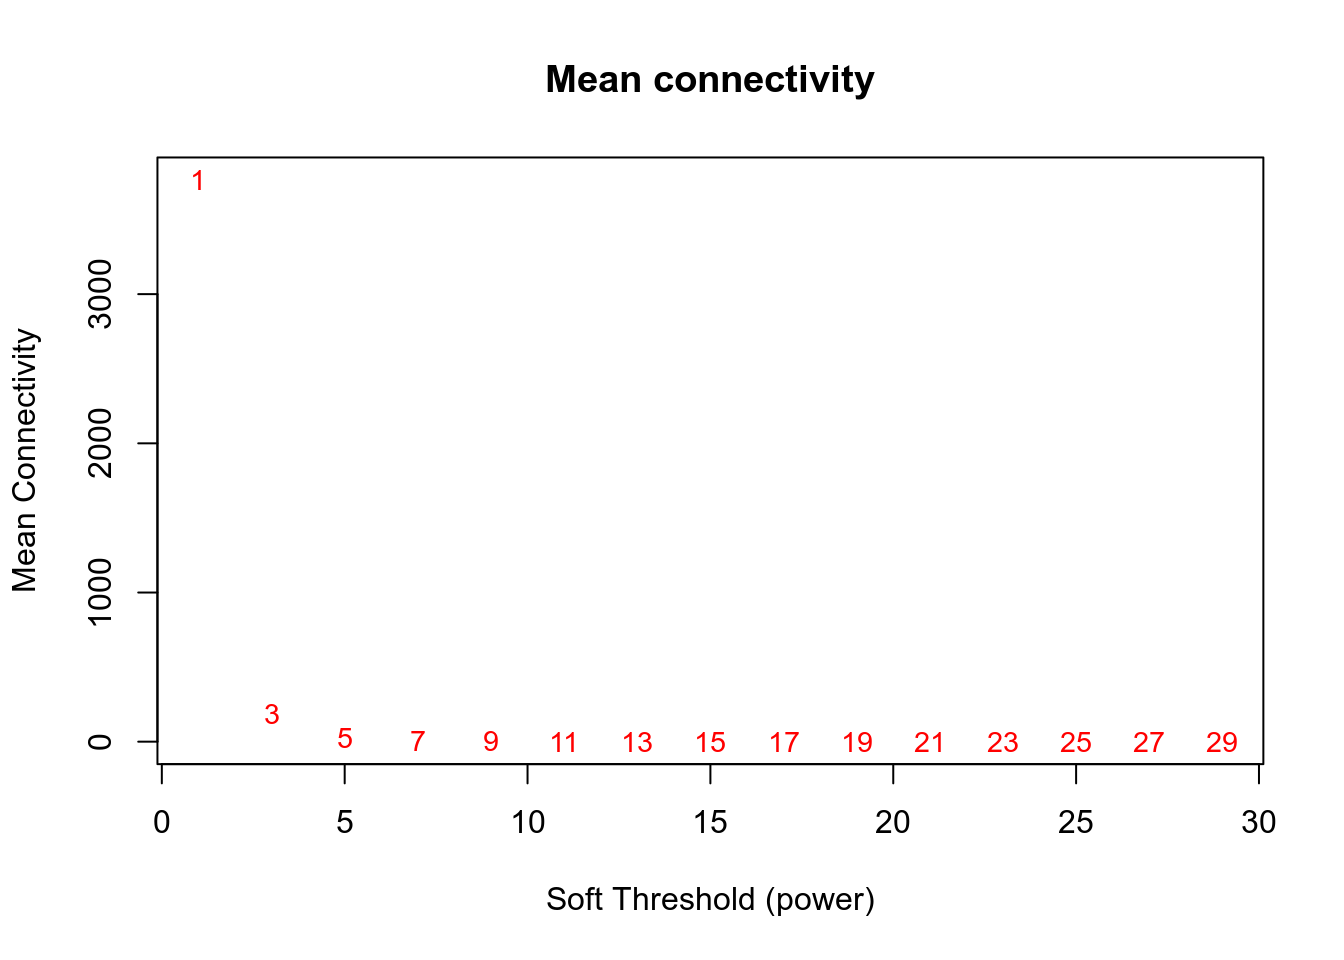
Network is computed using power=7.

Here are the modules for a few genes of interest:
- VNN1 is in the greenyellow module.
- PPARA is in the darkred module.
- PPARD is in the grey module.
- PPARG is in the blue module.
- PPARGC1A is in the turquoise module.
- PPARGC1B is in the turquoise module.
g:Profiler results for all modules are available here. Since there are many modules, you should expect at least 1 minute computation on the g:Profiler website for this query. Check below for faster queries focused on VNN1 module.
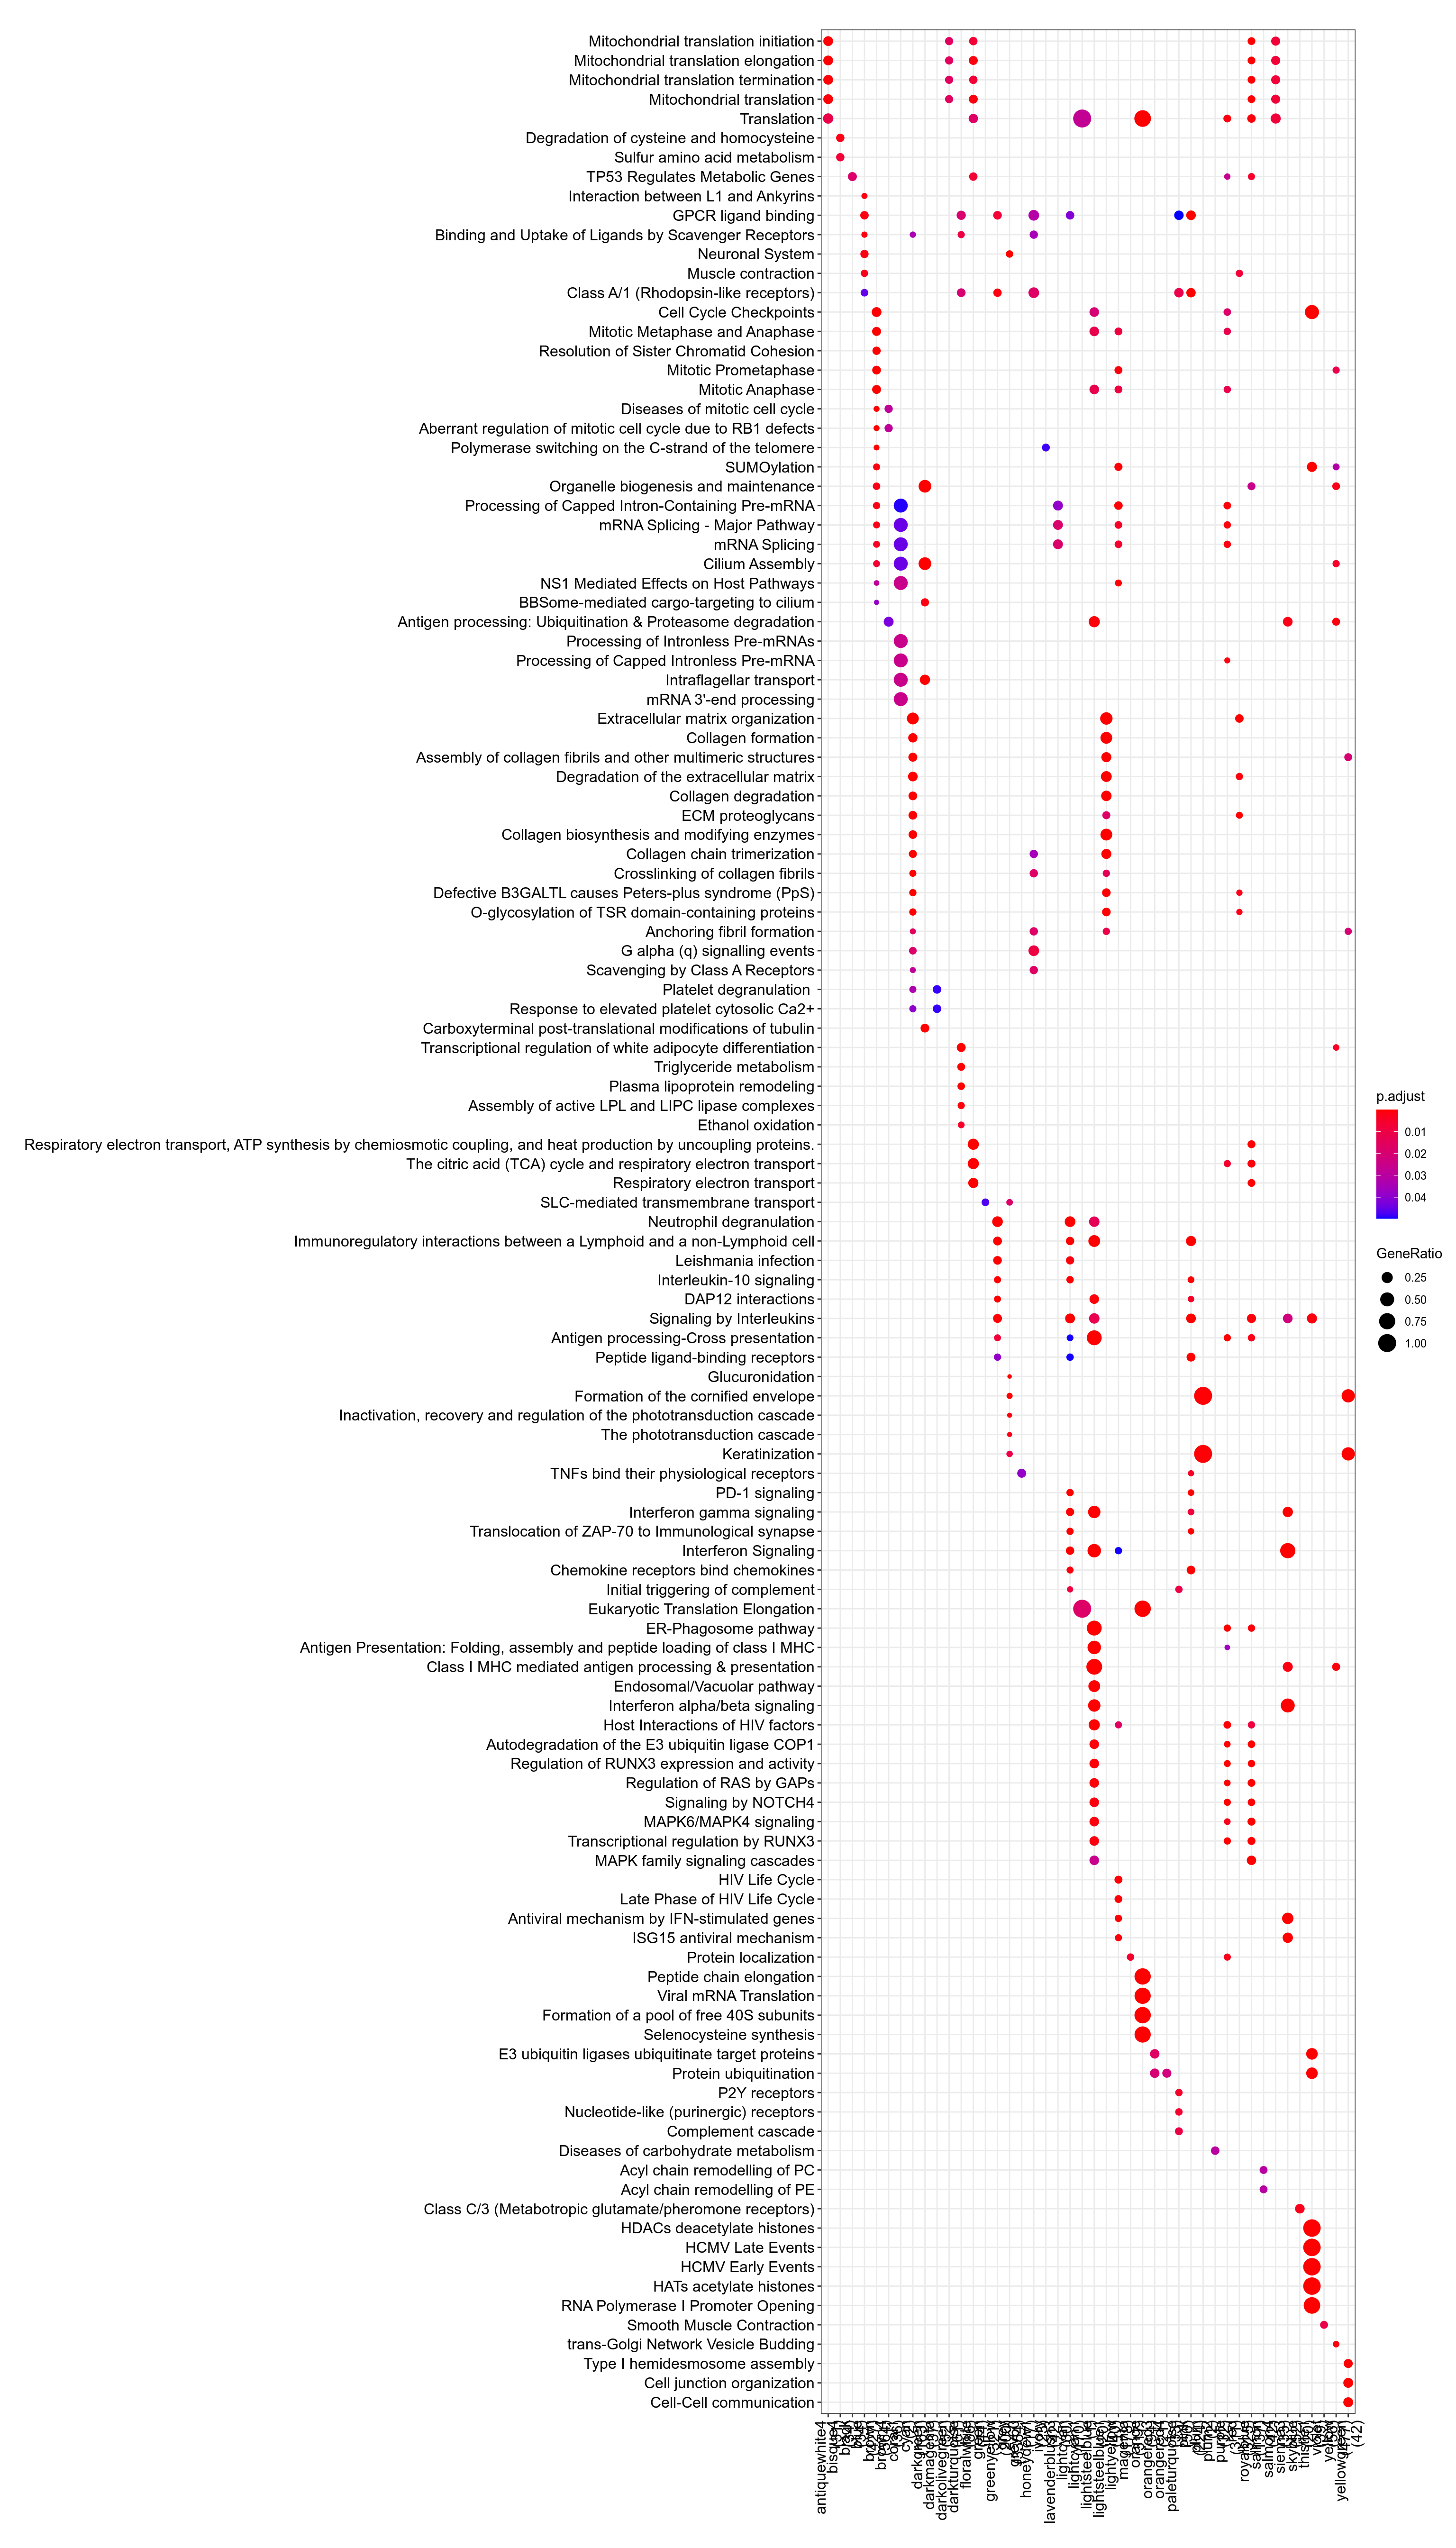
Figure 3.43: Pathway
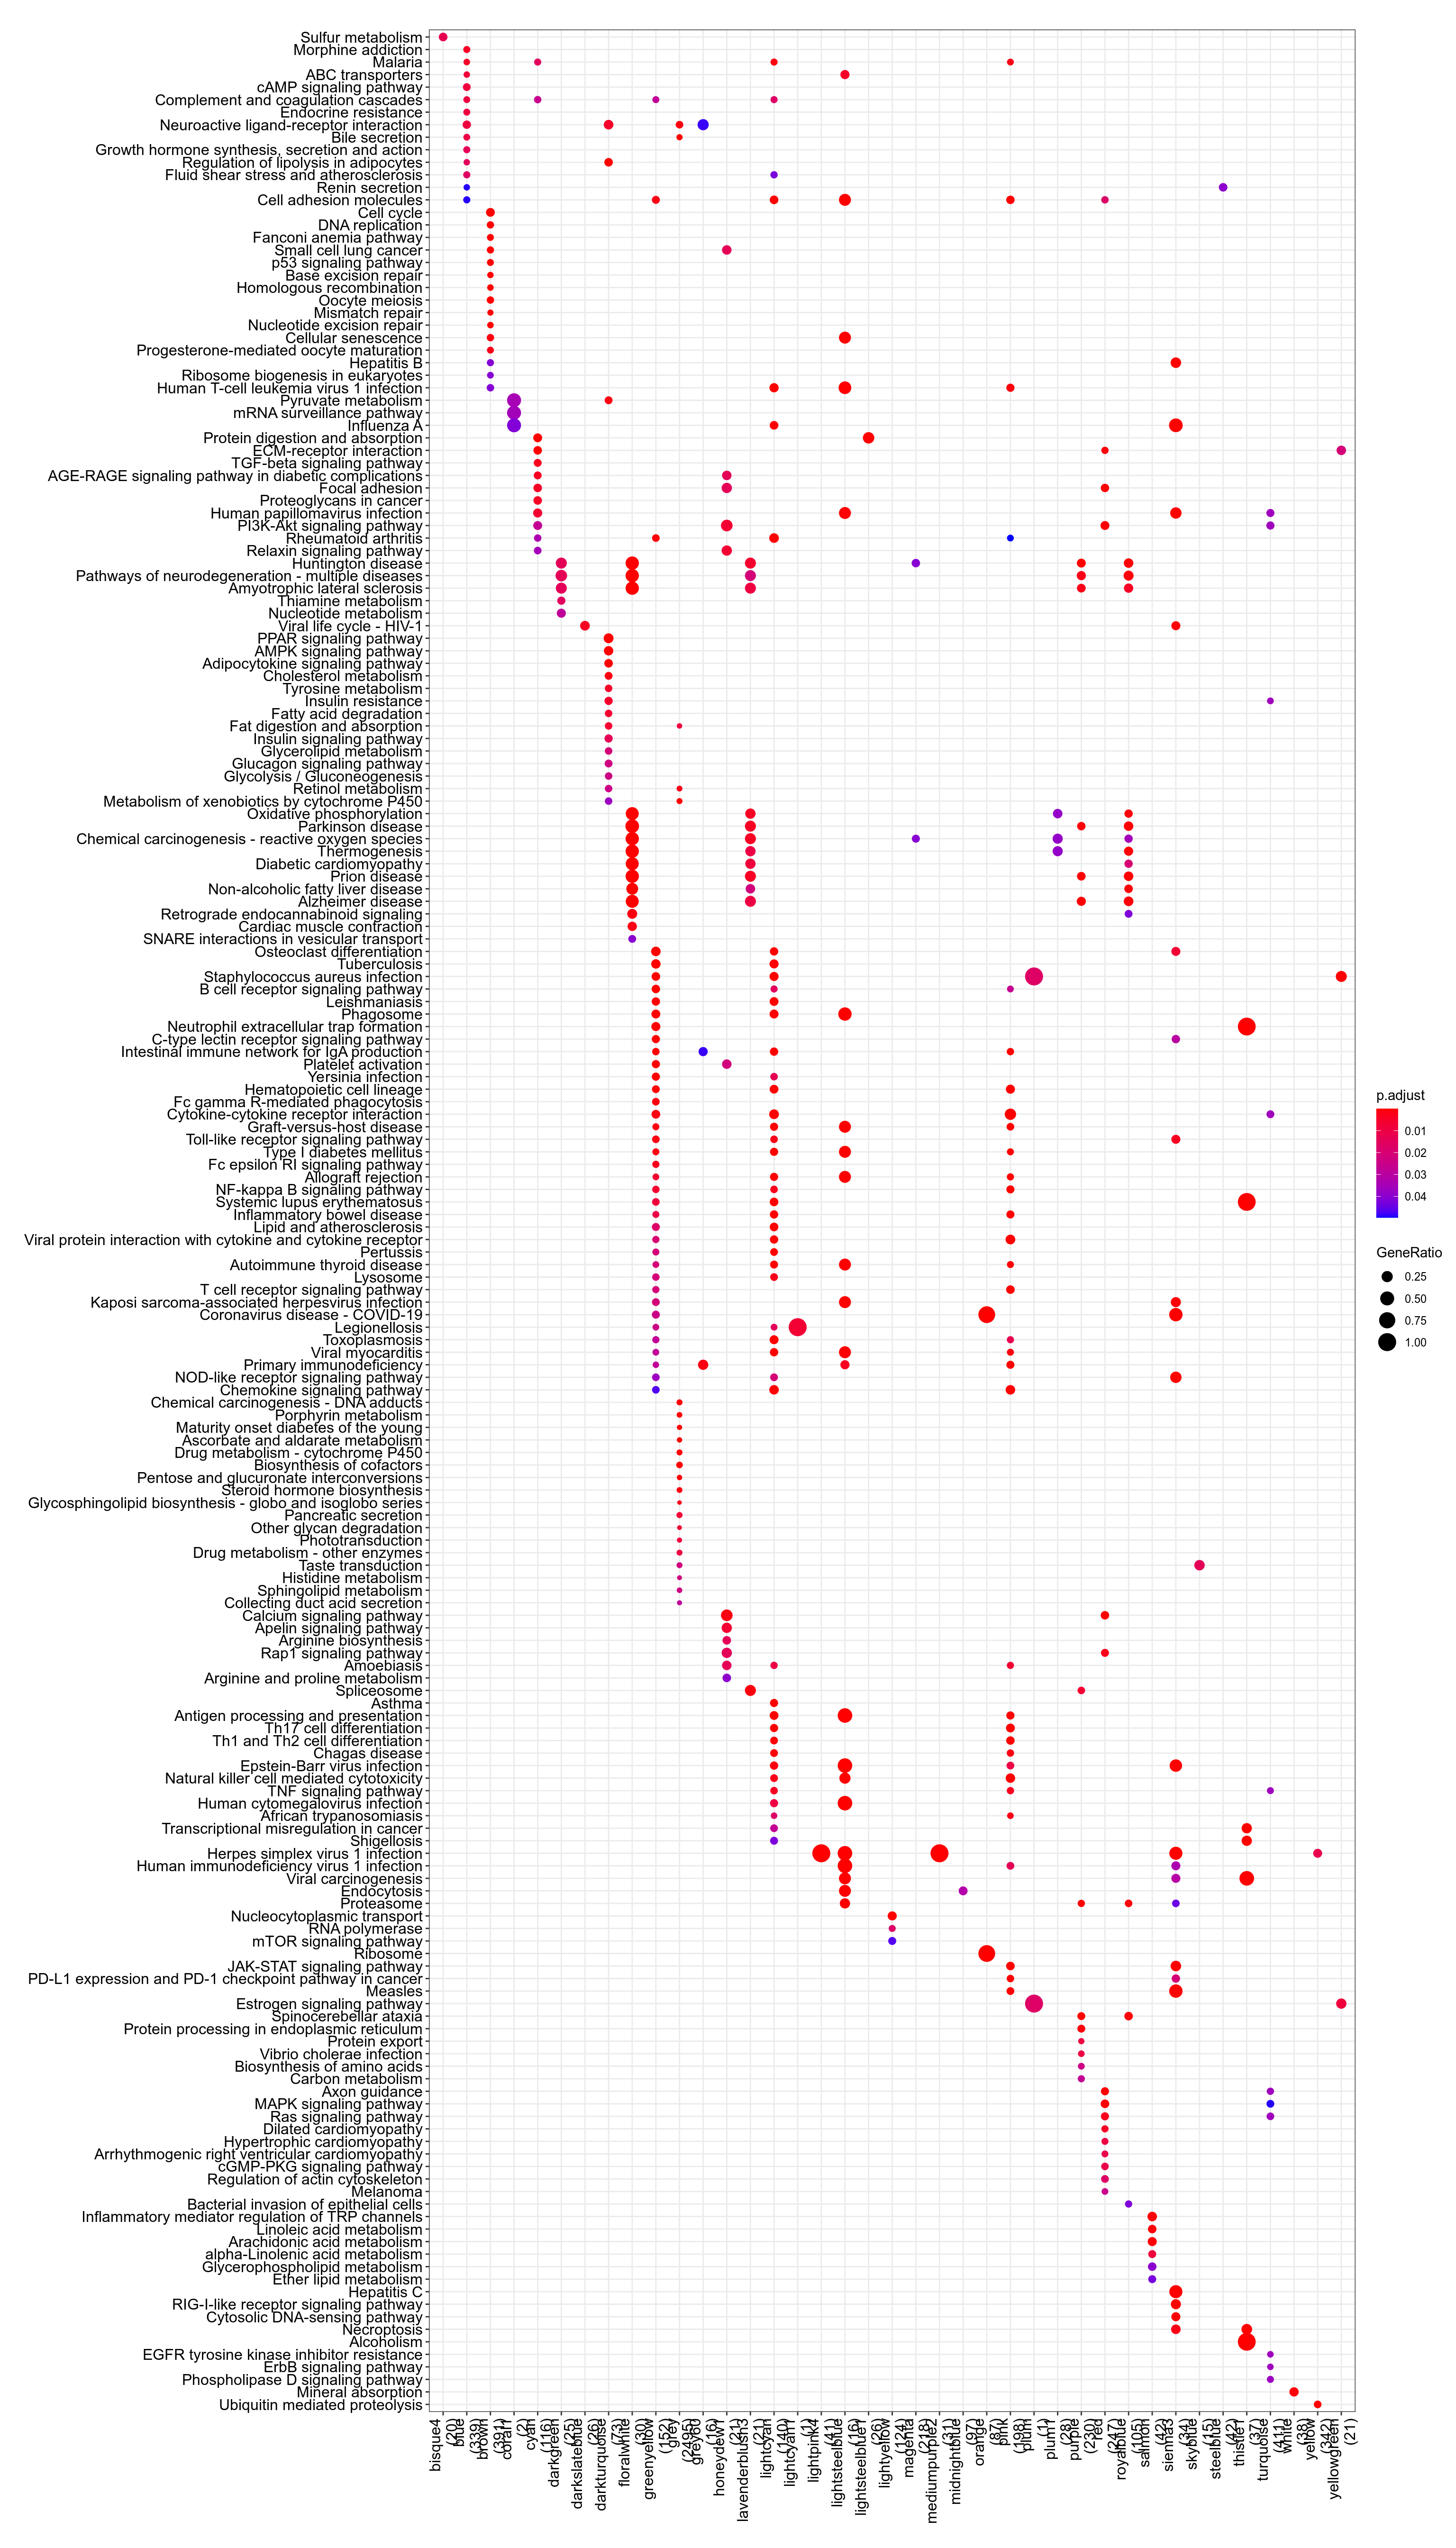
Figure 3.44: Kegg
.](_main_files/figure-html/resultsWgcnaProjectIdTcgaBrcaKnitPlotEnrichHallmarks-1.png)
Figure 3.45: MSigDb Hallmarks. readable pdf version.
## No enriched DO term in these classesTo check that module-to-genes reattribution is working as expected, heatmap of signal for VNN1 module is produced, both as absolute values and as Z-score ones.
.](../../../out/bookdown/VNN1_sarcoma/plots/resultsWgcnaProjectIdTcgaBrcaKnitPlotHeatmapVNN1ModuleAbsoluteValues.png)
Figure 3.46: log2(vst) signal in VNN1 module. Rows were gene name is prefixed with "-" display negative Z-score for these genes, meaning their signal is anticorrelated with other genes in the cluster. pdf version with readable genes and findable VNN1.
.](../../../out/bookdown/VNN1_sarcoma/plots/resultsWgcnaProjectIdTcgaBrcaKnitPlotHeatmapVNN1ModuleZscoreValues.png)
Figure 3.47: Zscore of log2(vst) signal in VNN1 module. Rows were gene name is prefixed with "-" display negative Z-score for these genes, meaning their signal is anticorrelated with other genes in the cluster. pdf version with readable genes and findable VNN1.
.](_main_files/figure-html/resultsWgcnaProjectIdTcgaBrcaKnitPlotGenesInVNN1ModuleCorPearson-1.png)
Figure 3.48: Genes in VNN1 module plotted by Pearson correlation against it. Details are available in this table.
- Enrichr results for all genes in VNN1 module are available here
- Enrichr results for genes in VNN1 module and positively correlated with it are available here
- Enrichr results for genes in VNN1 module and negatively correlated with it are available here
- g:Profiler results for all genes in VNN1 module are available here
- g:Profiler results for genes in VNN1 module and positively correlated with it are available here
- g:Profiler results for genes in VNN1 module and negatively correlated with it are available here
- g:Profiler results for comparison of the three queries above are available here