3.2.1.5 TCGA-LIHC dataset
There are 36886 genes and 424 samples in the dataset.
At least some samples or genes look not suitable for the co-expression analysis. After removing them, there remain 36883 genes and 424 samples.
##    Power SFT.R.sq slope truncated.R.sq  mean.k. median.k.  max.k.
## 1      1    0.223 -1.08          0.882 3.58e+03  3.47e+03 6970.00
## 2      3    0.662 -2.25          0.913 1.63e+02  1.08e+02  969.00
## 3      5    0.722 -2.23          0.940 2.14e+01  7.07e+00  280.00
## 4      7    0.904 -1.81          0.993 5.03e+00  7.08e-01  132.00
## 5      9    0.929 -1.68          0.980 1.72e+00  9.74e-02   82.90
## 6     11    0.942 -1.55          0.981 7.57e-01  1.69e-02   57.10
## 7     13    0.937 -1.45          0.970 3.98e-01  3.39e-03   41.40
## 8     15    0.956 -1.35          0.976 2.36e-01  7.30e-04   31.00
## 9     17    0.968 -1.29          0.986 1.51e-01  1.68e-04   23.90
## 10    19    0.973 -1.25          0.982 1.03e-01  4.08e-05   18.80
## 11    21    0.976 -1.23          0.991 7.30e-02  1.02e-05   15.50
## 12    23    0.975 -1.21          0.992 5.34e-02  2.64e-06   12.80
## 13    25    0.978 -1.20          0.993 4.00e-02  6.98e-07   10.70
## 14    27    0.971 -1.19          0.988 3.05e-02  1.90e-07    8.92
## 15    29    0.979 -1.19          0.993 2.36e-02  5.30e-08    7.49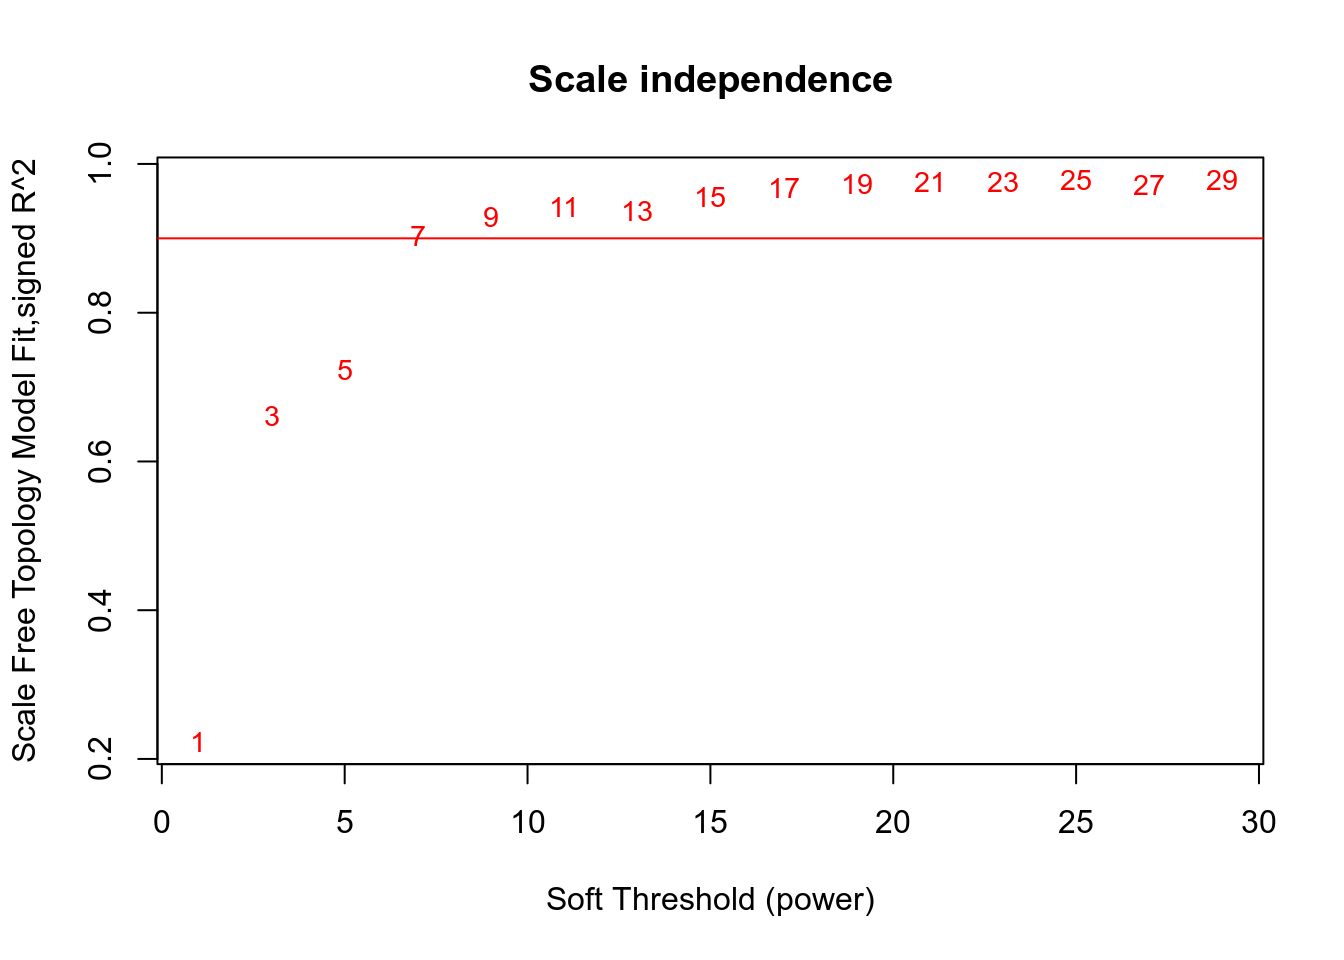
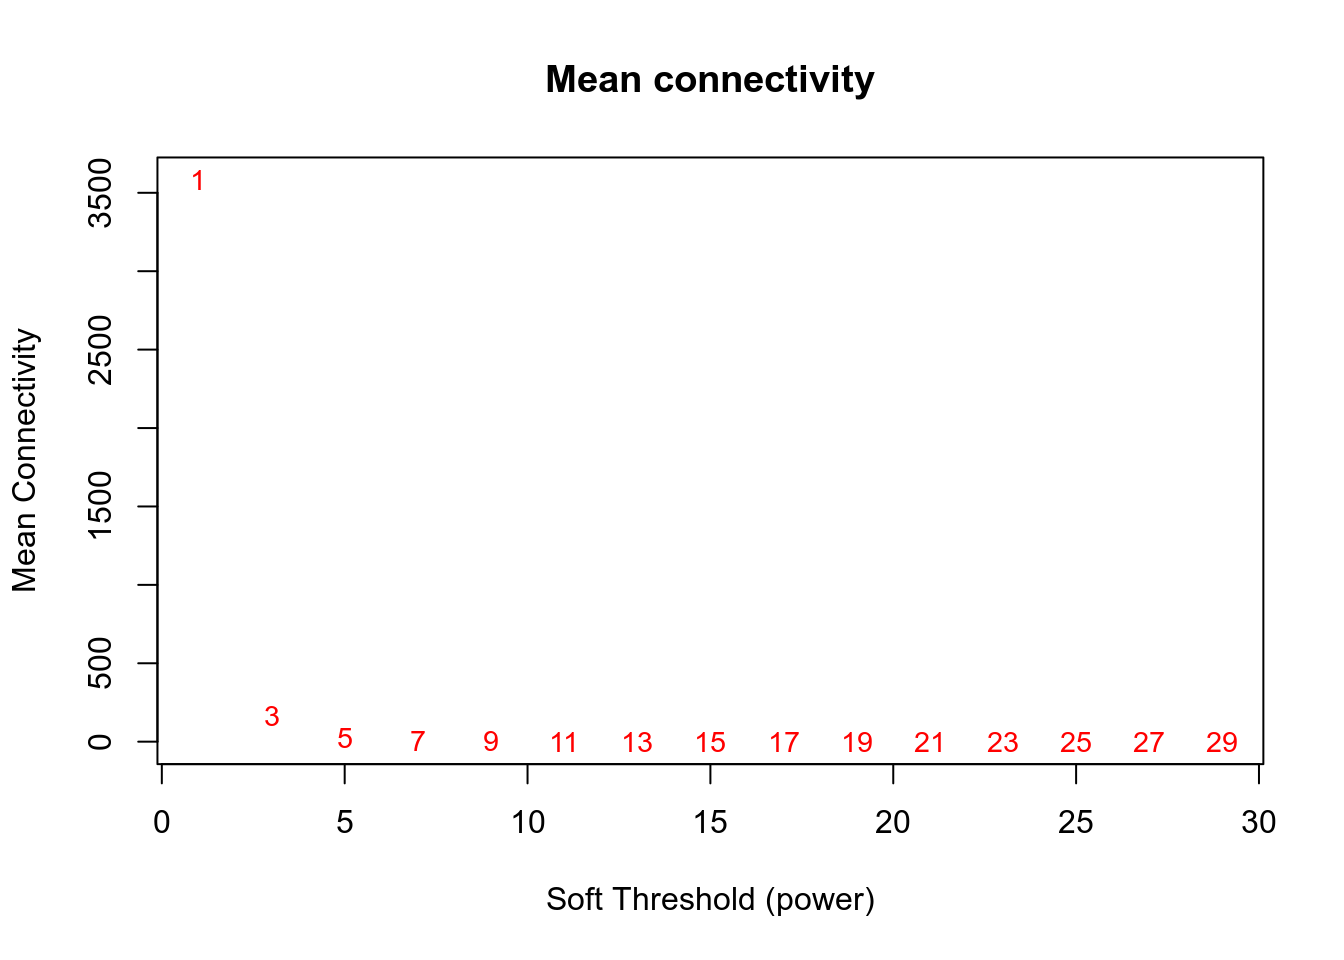
Network is computed using power=7.
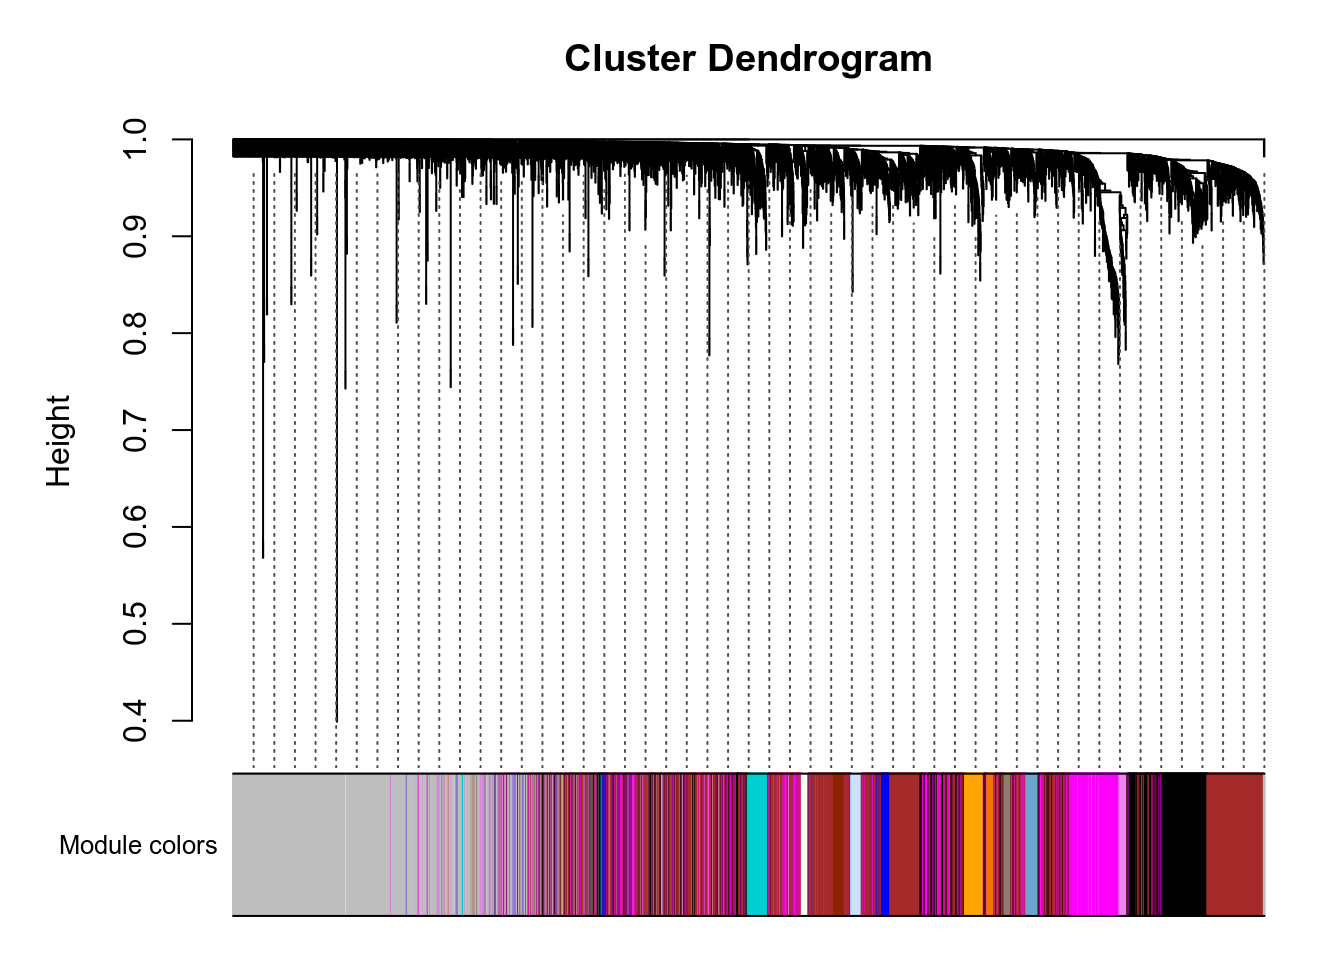
Here are the modules for a few genes of interest:
- VNN1 is in the grey module.
- PPARA is in the blue module.
- PPARD is in the grey module.
- PPARG is in the grey module.
- PPARGC1A is in the turquoise module.
- PPARGC1B is in the grey module.
g:Profiler results for all modules are available here. Since there are many modules, you should expect at least 1 minute computation on the g:Profiler website for this query. Check below for faster queries focused on VNN1 module.
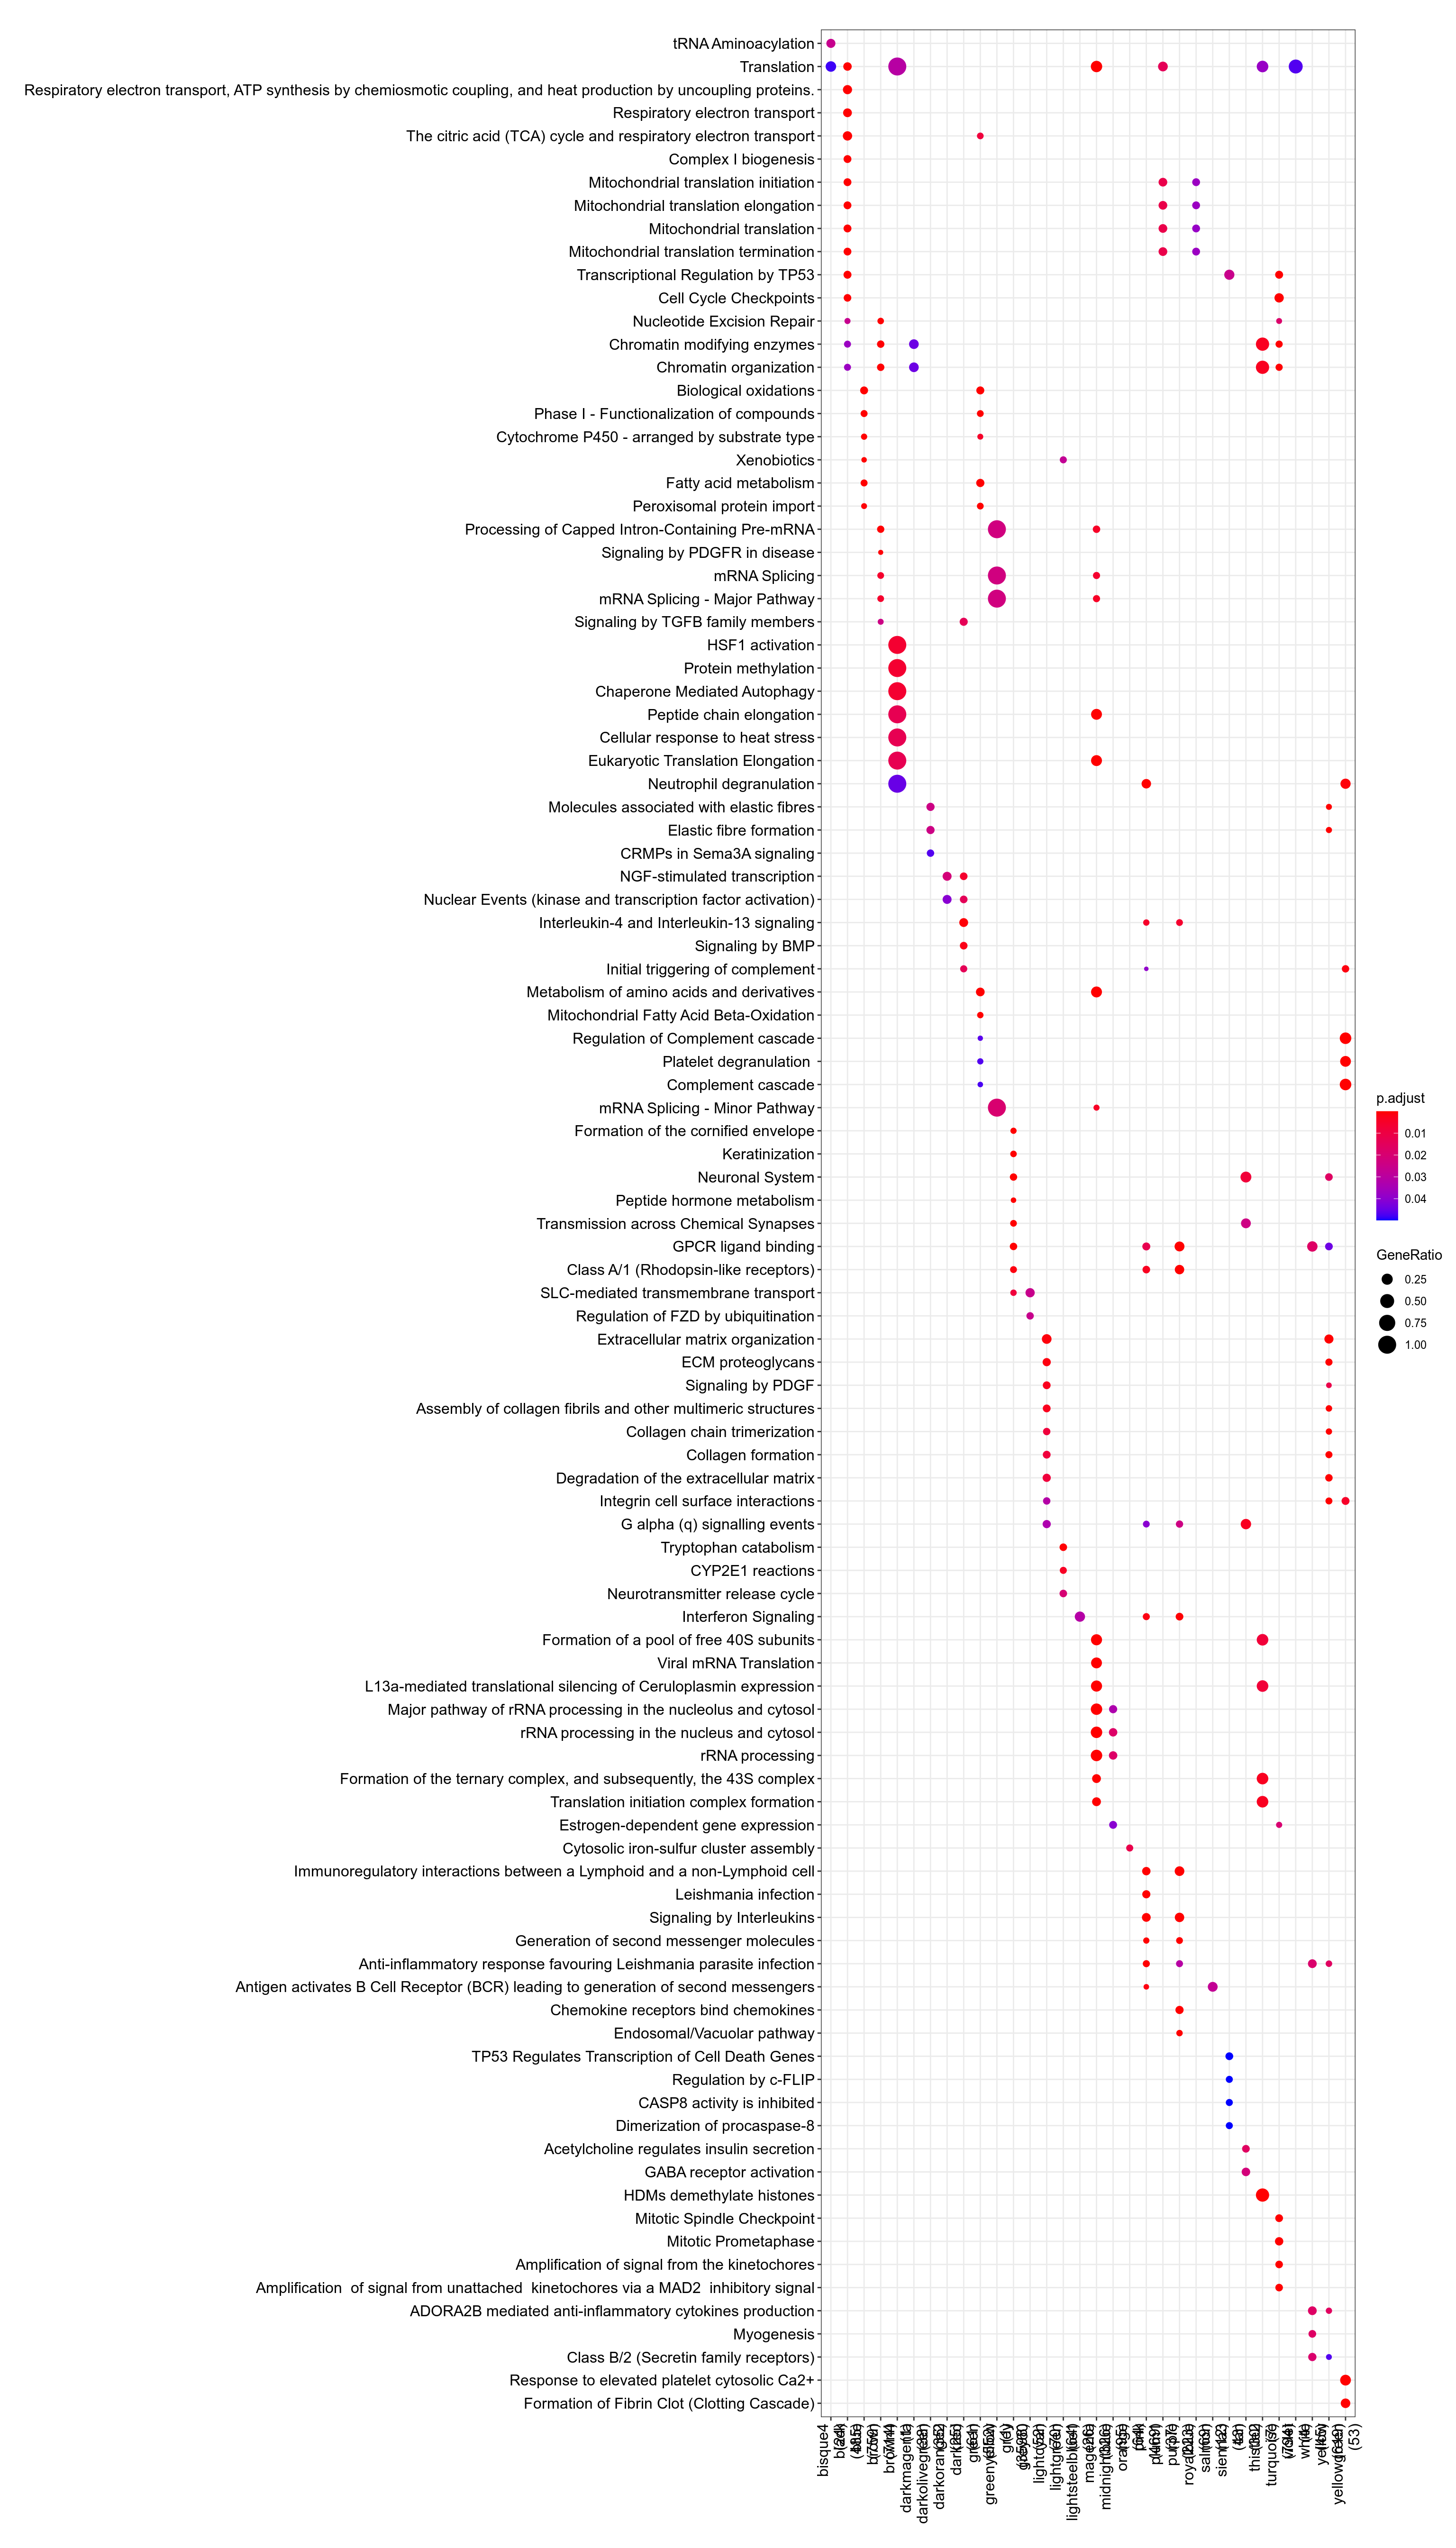
Figure 3.53: Pathway

Figure 3.54: Kegg
.](_main_files/figure-html/resultsWgcnaProjectIdTcgaLihcKnitPlotEnrichHallmarks-1.png)
Figure 3.55: MSigDb Hallmarks. readable pdf version.
## No enriched DO term in these classesTo check that module-to-genes reattribution is working as expected, heatmap of signal for VNN1 module is produced, both as absolute values and as Z-score ones.
## VNN1 module contains more than 2000 genes. Heatmap generation is skippedVNN1 module contains more than 2000 genes. Heatmap generation is skipped
## VNN1 module contains more than 5000 genes. Correlation analysis is skippedMore than 5000 genes in VNN1 module. Analysis skipped. You should try to reduce module size.