3.2.3.2 ULMS
There are 36886 genes and 27 samples in the dataset.
At least some samples or genes look not suitable for the co-expression analysis. After removing them, there remain 36537 genes and 27 samples.
##    Power SFT.R.sq slope truncated.R.sq  mean.k. median.k. max.k.
## 1      1    0.325 -5.51          0.941 6380.000  6.27e+03 9230.0
## 2      3    0.707 -3.73          0.972  576.000  5.34e+02 1580.0
## 3      5    0.874 -3.28          0.992   98.800  8.37e+01  452.0
## 4      7    0.927 -2.84          0.986   24.600  1.86e+01  174.0
## 5      9    0.928 -2.55          0.917    8.110  5.14e+00  105.0
## 6     11    0.444 -3.26          0.355    3.380  1.67e+00   90.3
## 7     13    0.450 -2.86          0.371    1.730  6.16e-01   81.4
## 8     15    0.398 -2.97          0.335    1.060  2.50e-01   75.6
## 9     17    0.389 -2.68          0.340    0.753  1.09e-01   71.5
## 10    19    0.376 -2.79          0.316    0.591  5.06e-02   68.6
## 11    21    0.373 -2.63          0.315    0.499  2.45e-02   66.4
## 12    23    0.383 -2.54          0.318    0.443  1.24e-02   64.7
## 13    25    0.365 -2.41          0.309    0.405  6.43e-03   63.4
## 14    27    0.360 -2.33          0.306    0.379  3.41e-03   62.3
## 15    29    0.348 -2.25          0.303    0.360  1.85e-03   61.4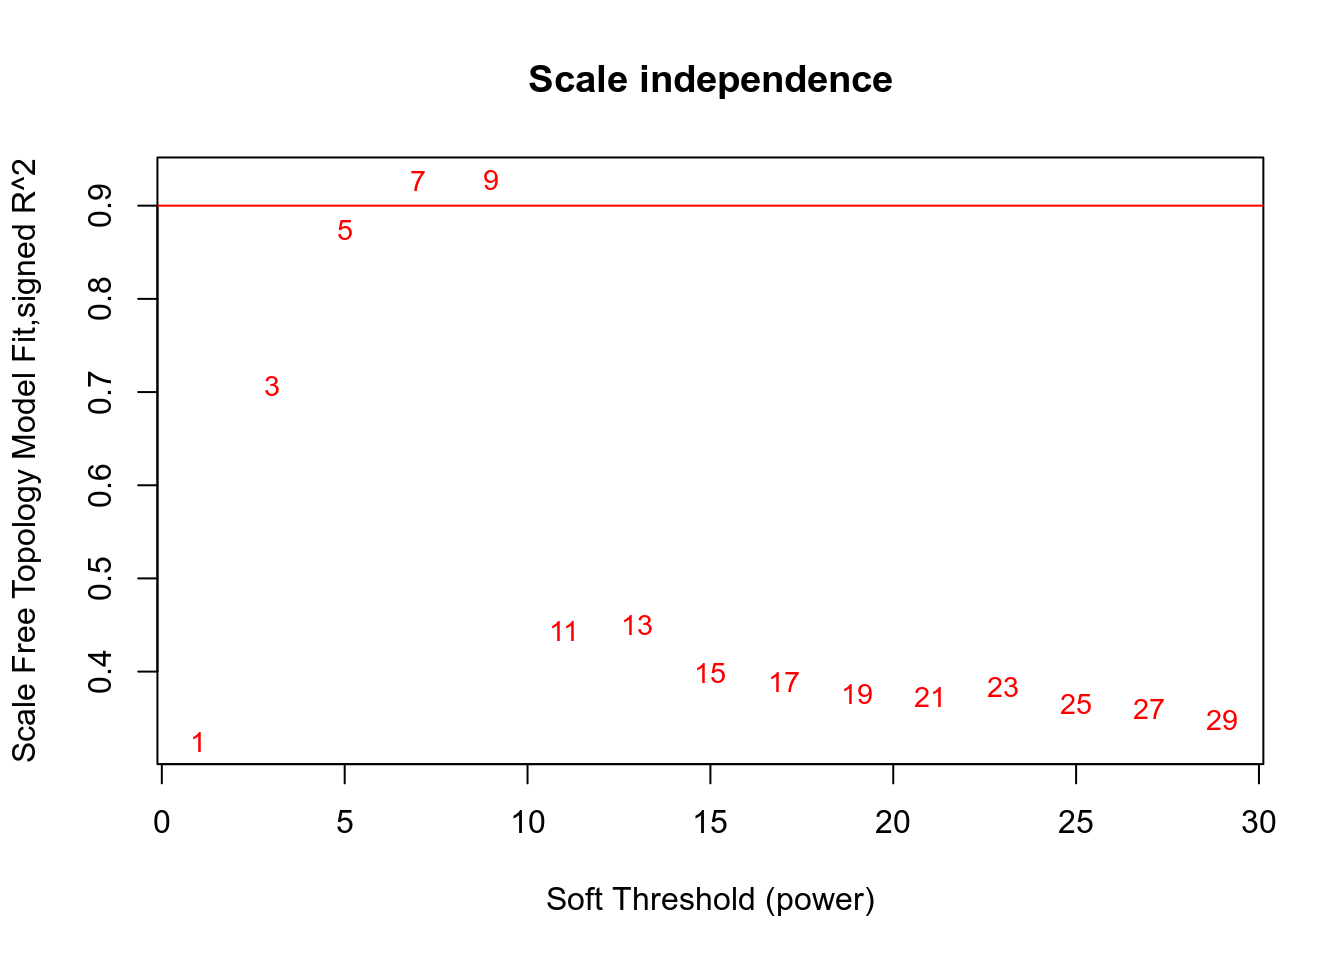
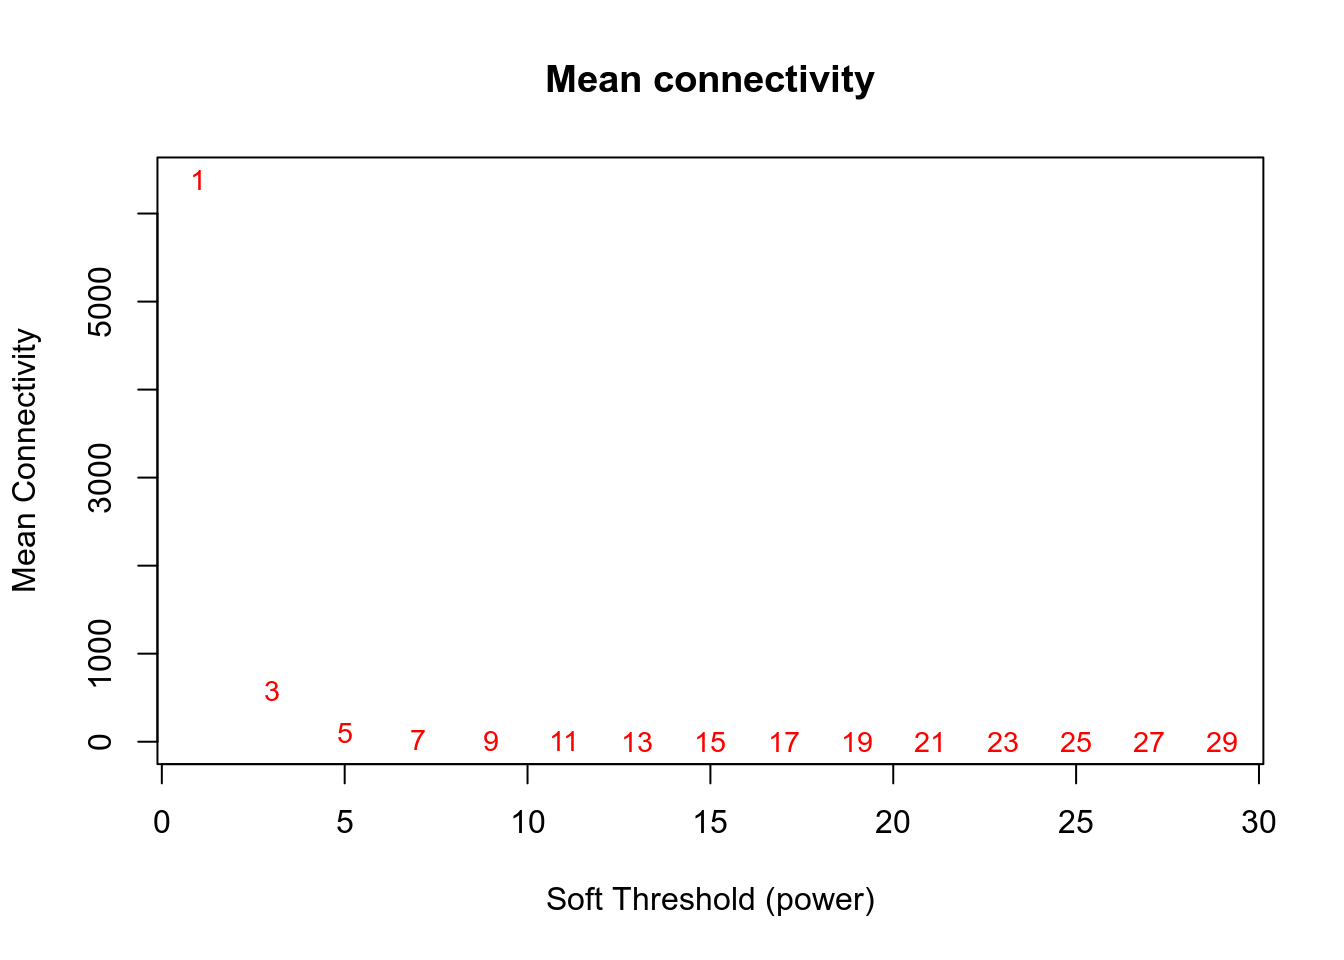
Network is computed using power=5.
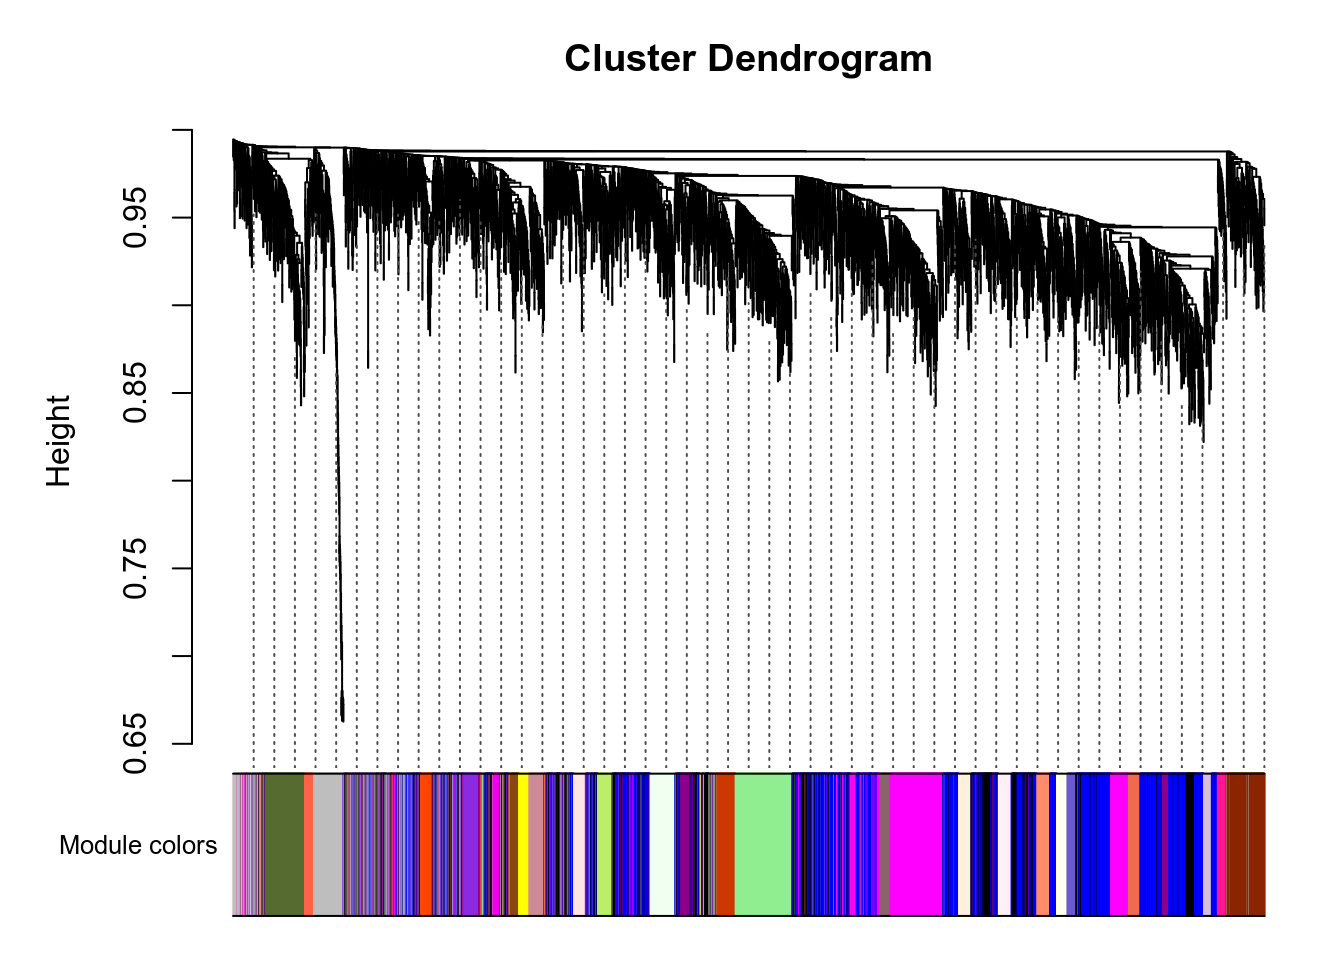
Here are the modules for a few genes of interest:
- VNN1 is in the turquoise module.
- PPARA is in the salmon module.
- PPARD is in the greenyellow module.
- PPARG is in the skyblue2 module.
- PPARGC1A is in the tan module.
- PPARGC1B is in the salmon module.
g:Profiler results for all modules are available here. Since there are many modules, you should expect at least 1 minute computation on the g:Profiler website for this query. Check below for faster queries focused on VNN1 module.
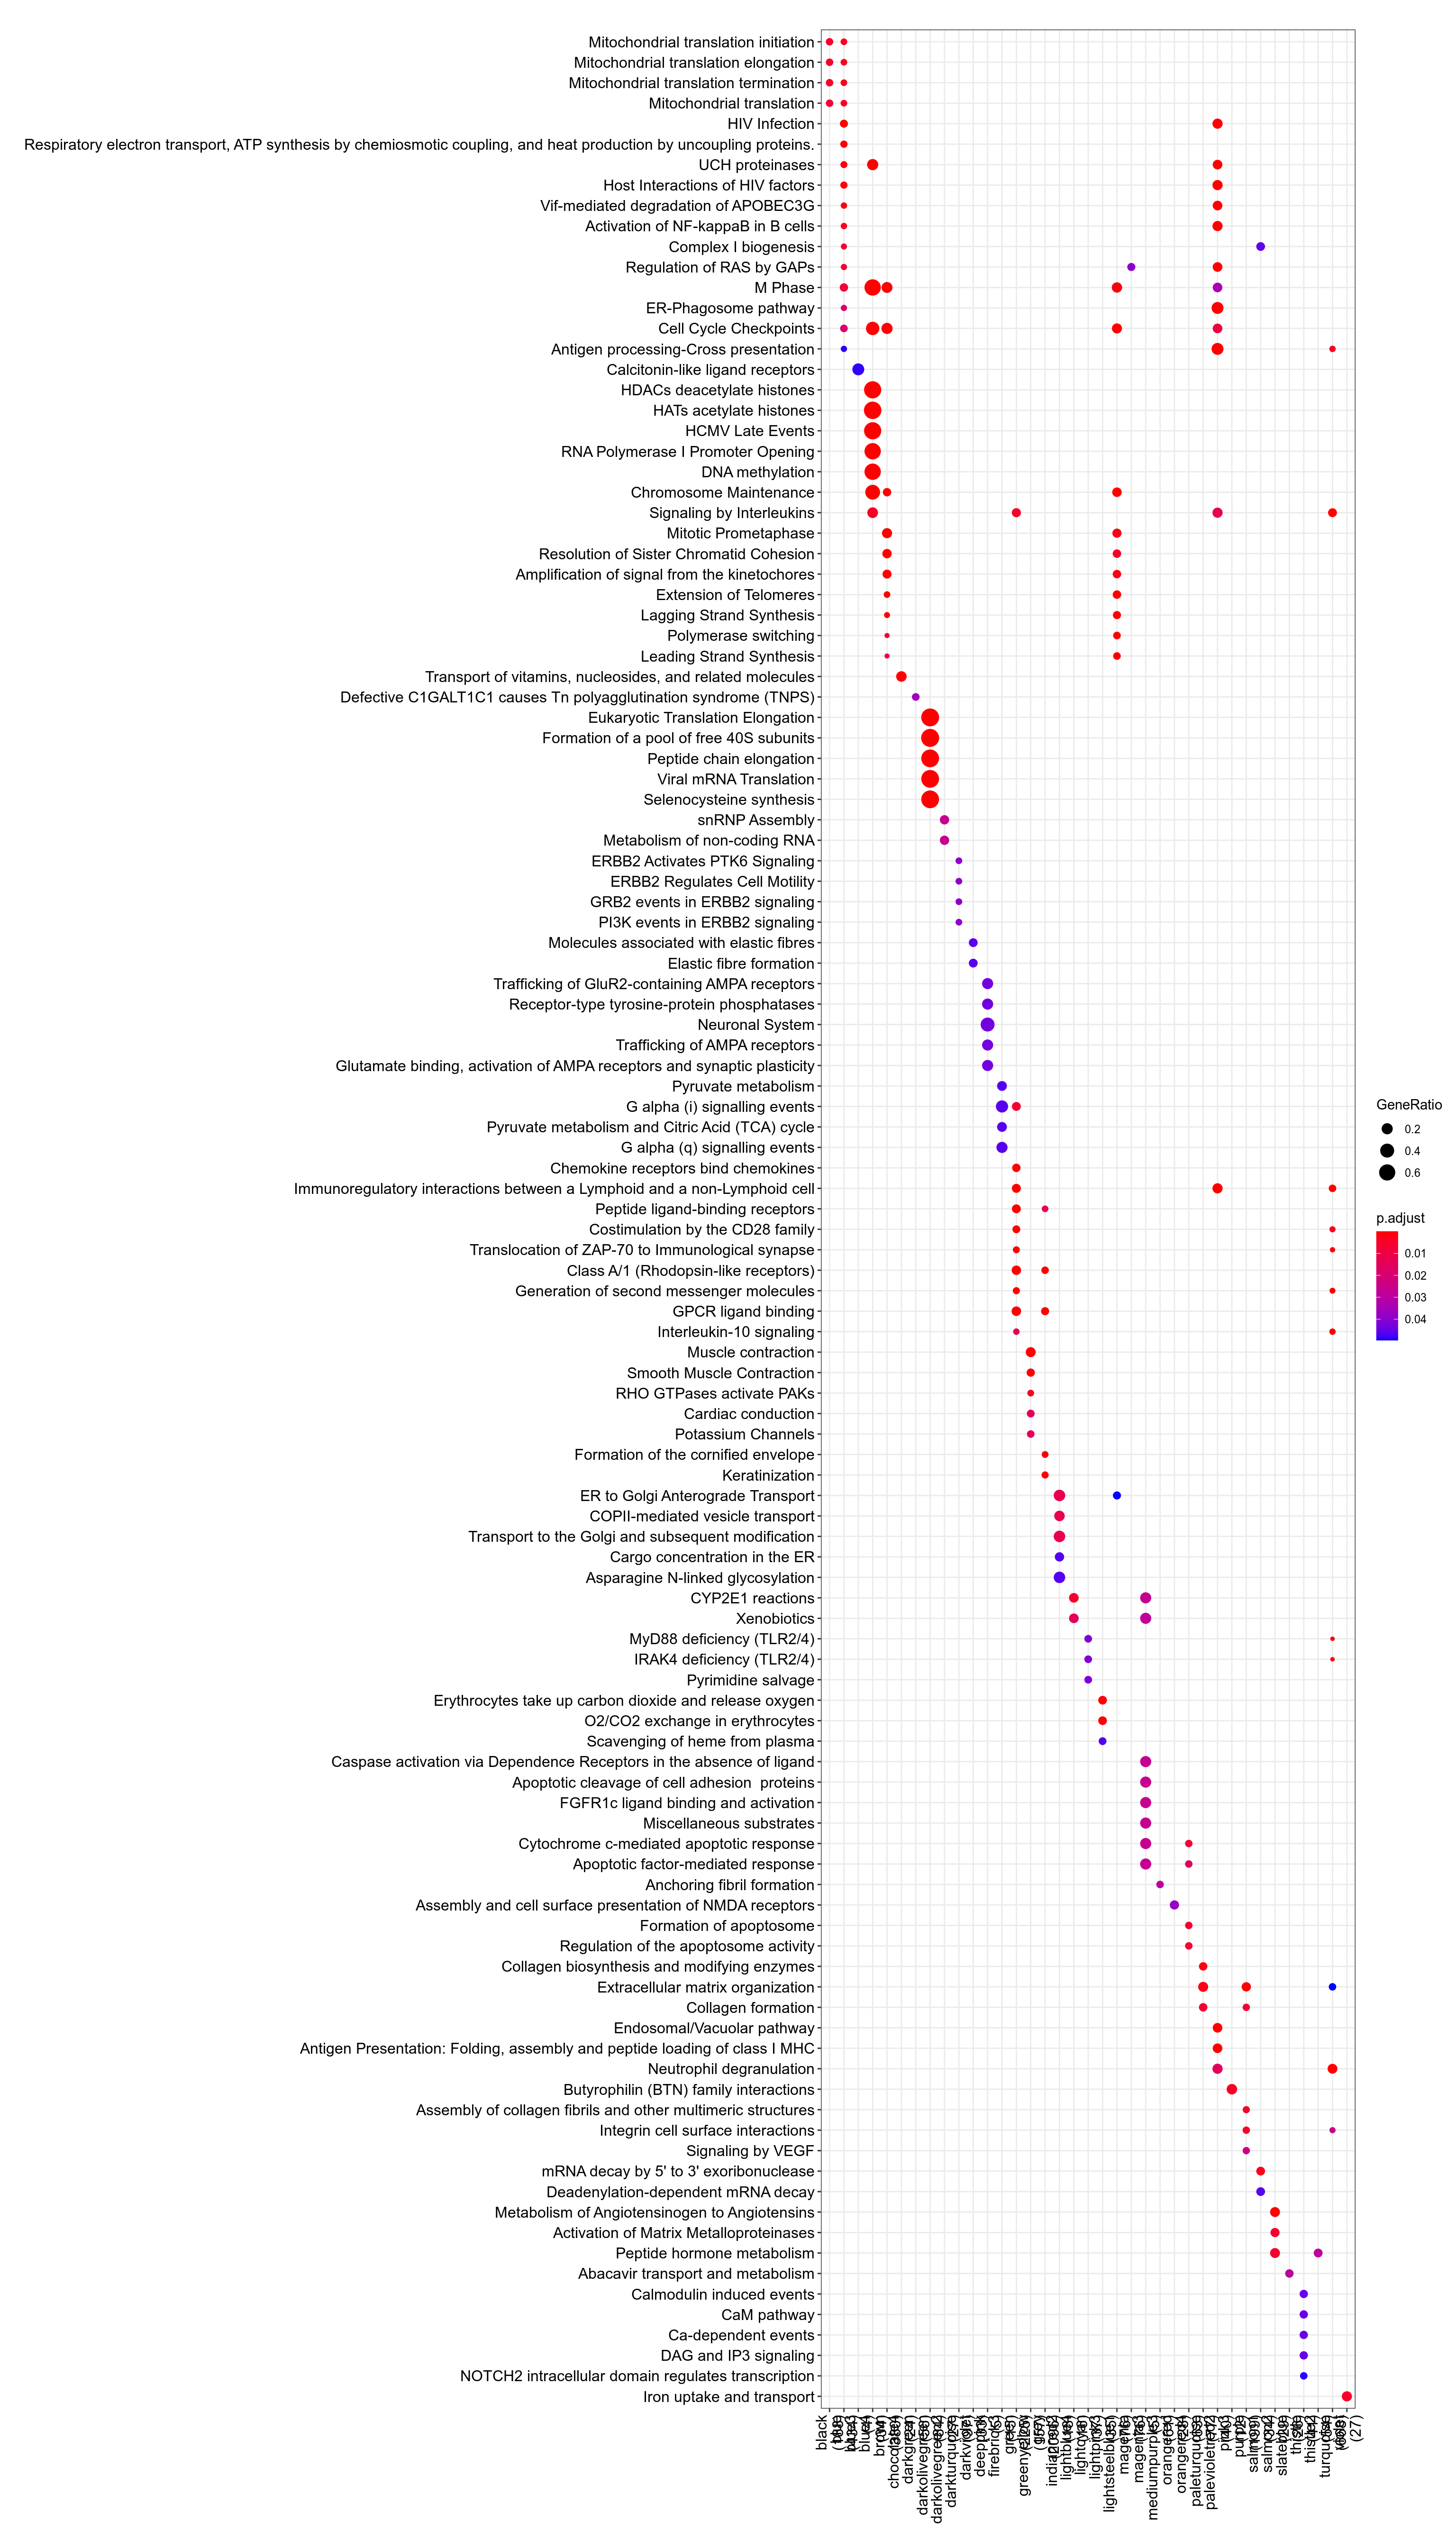
Figure 3.123: Pathway
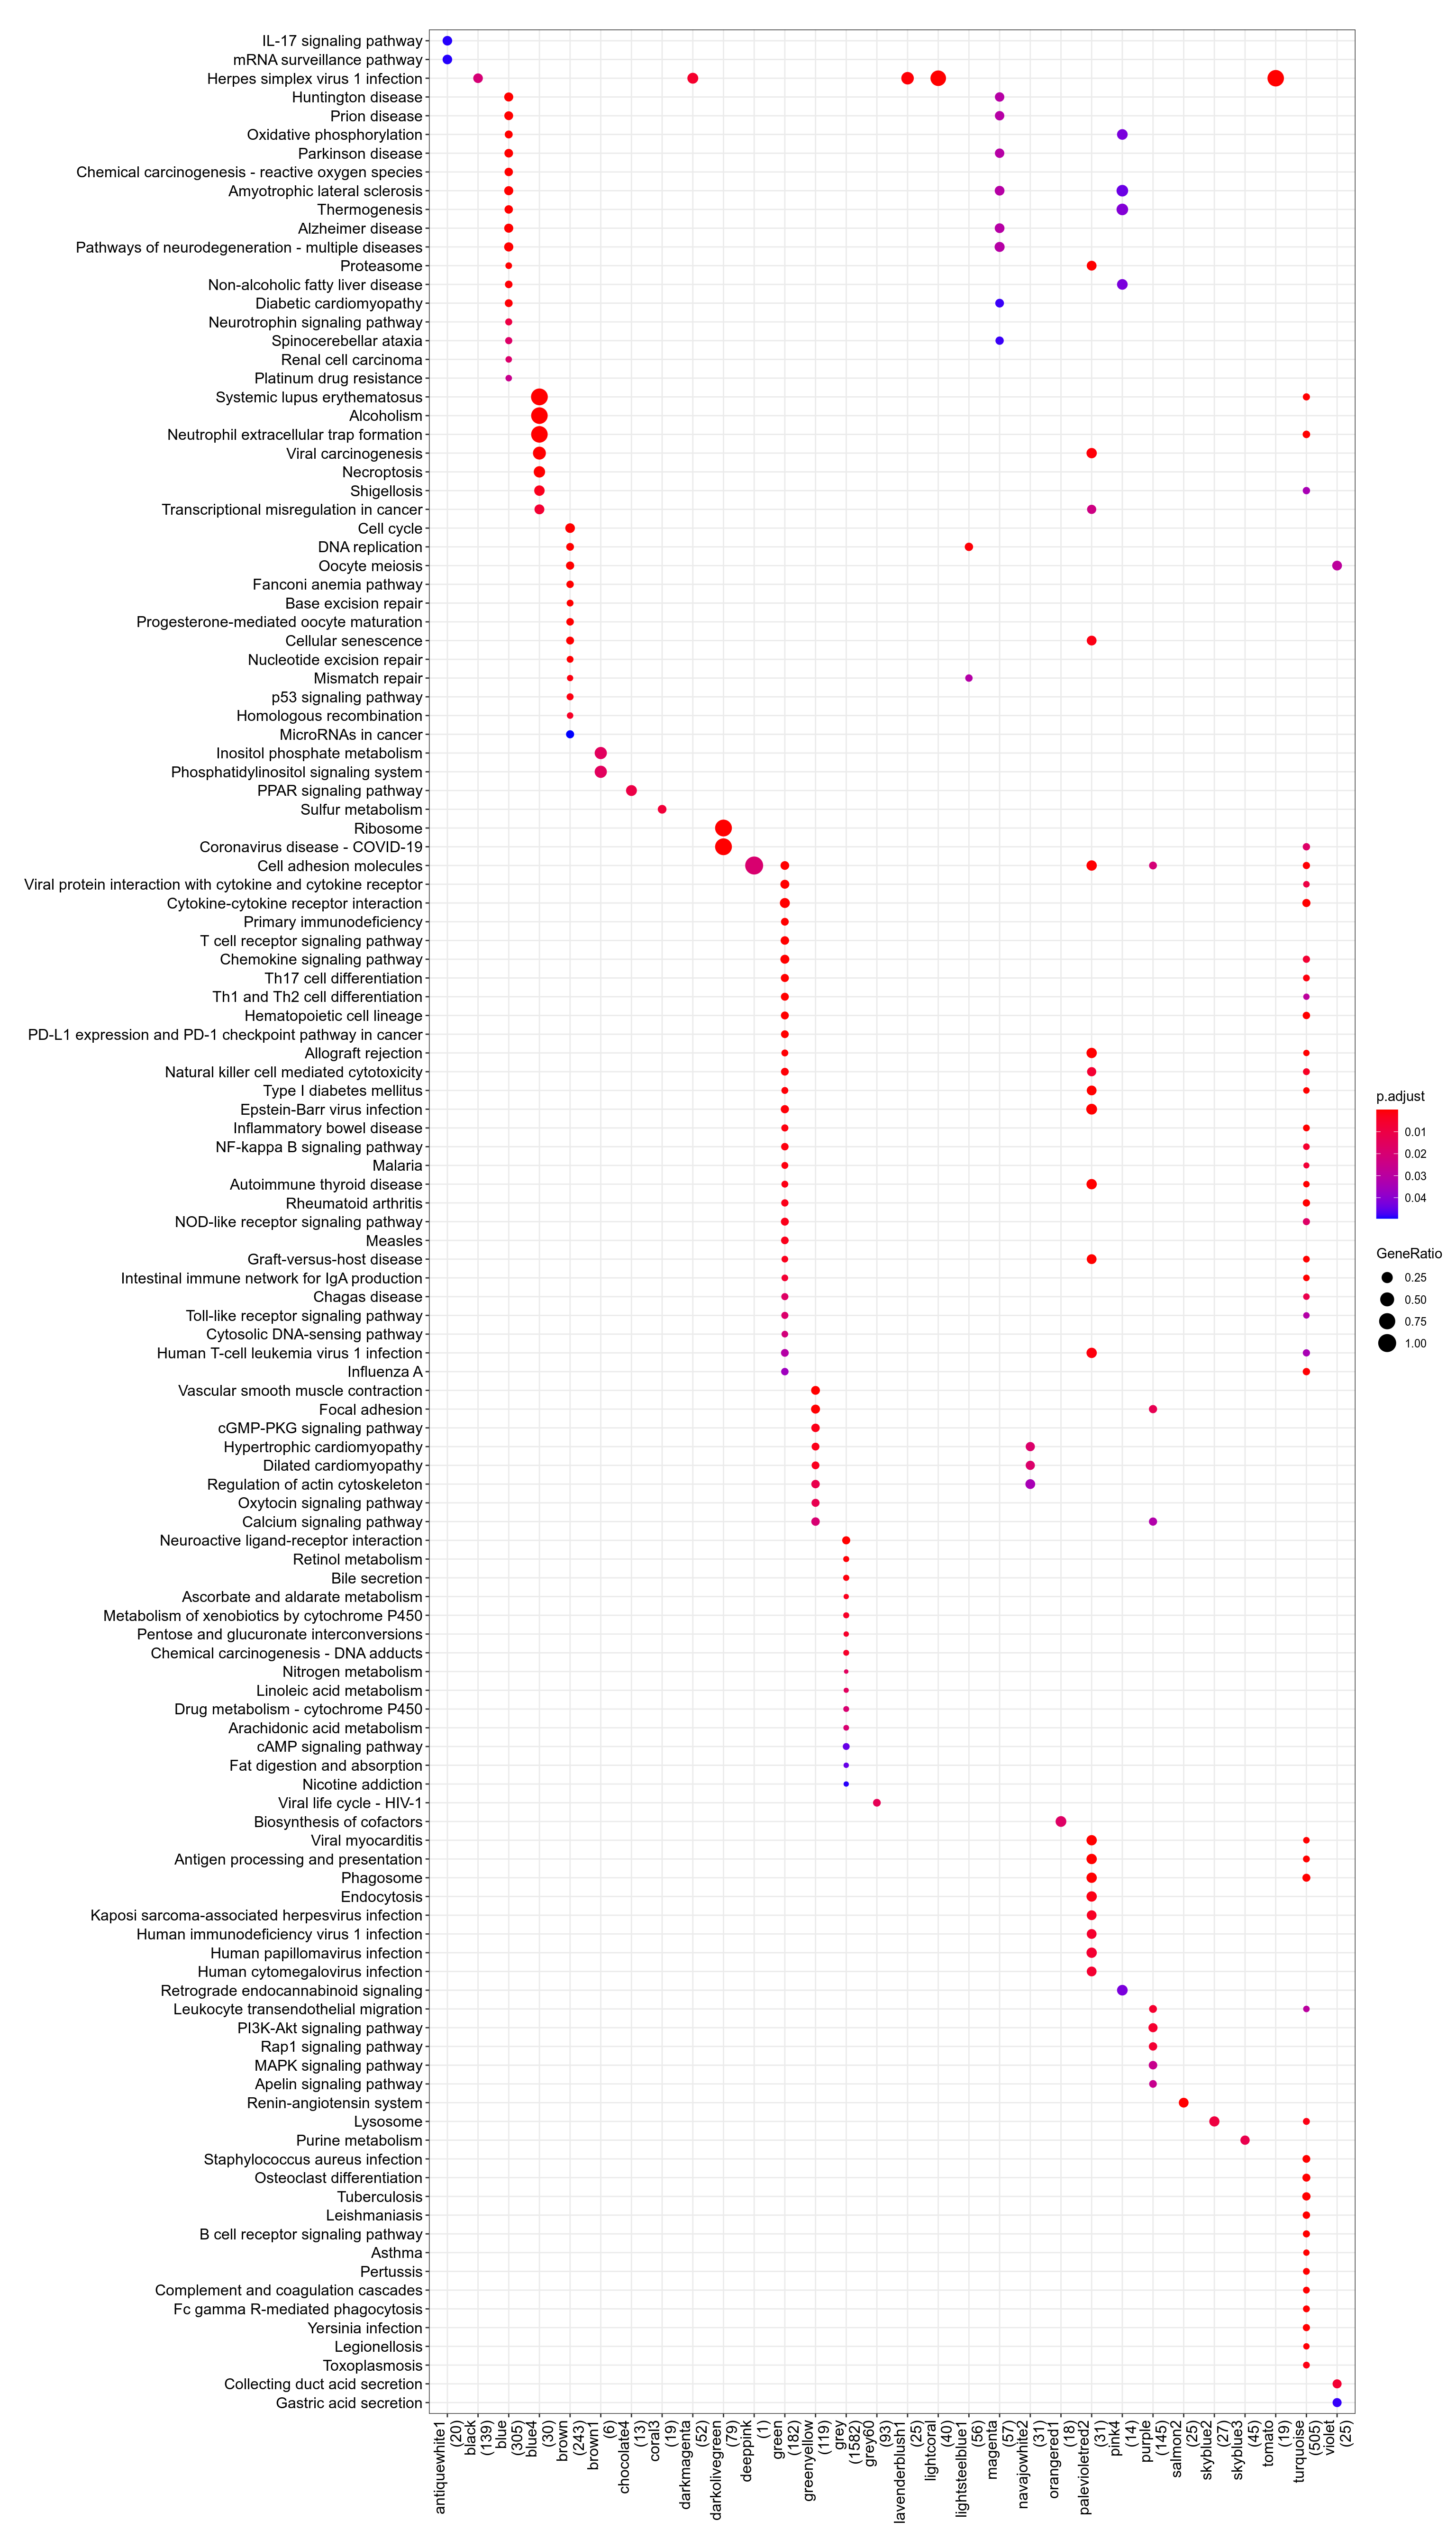
Figure 3.124: Kegg
.](_main_files/figure-html/resultsWgcnaTcgaSarcULMSKnitPlotEnrichHallmarks-1.png)
Figure 3.125: MSigDb Hallmarks. readable pdf version.
## No enriched DO term in these classesTo check that module-to-genes reattribution is working as expected, heatmap of signal for VNN1 module is produced, both as absolute values and as Z-score ones.
.](../../../out/bookdown/VNN1_sarcoma/plots/resultsWgcnaTcgaSarcULMSKnitPlotHeatmapVNN1ModuleAbsoluteValues.png)
Figure 3.126: log2(vst) signal in VNN1 module. Rows were gene name is prefixed with "-" display negative Z-score for these genes, meaning their signal is anticorrelated with other genes in the cluster. pdf version with readable genes and findable VNN1.
.](../../../out/bookdown/VNN1_sarcoma/plots/resultsWgcnaTcgaSarcULMSKnitPlotHeatmapVNN1ModuleZscoreValues.png)
Figure 3.127: Zscore of log2(vst) signal in VNN1 module. Rows were gene name is prefixed with "-" display negative Z-score for these genes, meaning their signal is anticorrelated with other genes in the cluster. pdf version with readable genes and findable VNN1.
.](_main_files/figure-html/resultsWgcnaTcgaSarcULMSKnitPlotGenesInVNN1ModuleCorPearson-1.png)
Figure 3.128: Genes in VNN1 module plotted by Pearson correlation against it. Details are available in this table.
- Enrichr results for all genes in VNN1 module are available here
- Enrichr results for genes in VNN1 module and positively correlated with it are available here
- Enrichr results for genes in VNN1 module and negatively correlated with it are available here
- g:Profiler results for all genes in VNN1 module are available here
- g:Profiler results for genes in VNN1 module and positively correlated with it are available here
- g:Profiler results for genes in VNN1 module and negatively correlated with it are available here
- g:Profiler results for comparison of the three queries above are available here