3.2.1.2 TCGA-BLCA dataset
There are 36886 genes and 433 samples in the dataset.
All samples and genes look good for the analysis.
##    Power SFT.R.sq slope truncated.R.sq  mean.k. median.k. max.k.
## 1      1    0.224 -1.51          0.947 3.74e+03  3.66e+03 7420.0
## 2      3    0.828 -2.10          0.997 1.68e+02  1.22e+02  998.0
## 3      5    0.939 -2.02          0.996 2.11e+01  8.46e+00  329.0
## 4      7    0.970 -1.80          0.997 4.89e+00  9.08e-01  169.0
## 5      9    0.951 -1.65          0.981 1.70e+00  1.40e-01  109.0
## 6     11    0.941 -1.54          0.975 7.66e-01  2.76e-02   76.6
## 7     13    0.949 -1.44          0.981 4.10e-01  6.23e-03   56.5
## 8     15    0.944 -1.39          0.977 2.45e-01  1.51e-03   43.2
## 9     17    0.963 -1.34          0.990 1.58e-01  3.99e-04   33.7
## 10    19    0.961 -1.31          0.985 1.08e-01  1.09e-04   26.9
## 11    21    0.967 -1.29          0.987 7.68e-02  3.07e-05   21.7
## 12    23    0.982 -1.26          0.997 5.64e-02  8.85e-06   17.7
## 13    25    0.987 -1.24          0.997 4.24e-02  2.62e-06   14.6
## 14    27    0.983 -1.23          0.990 3.26e-02  7.91e-07   12.1
## 15    29    0.986 -1.22          0.991 2.54e-02  2.44e-07   10.2

Network is computed using power=5.
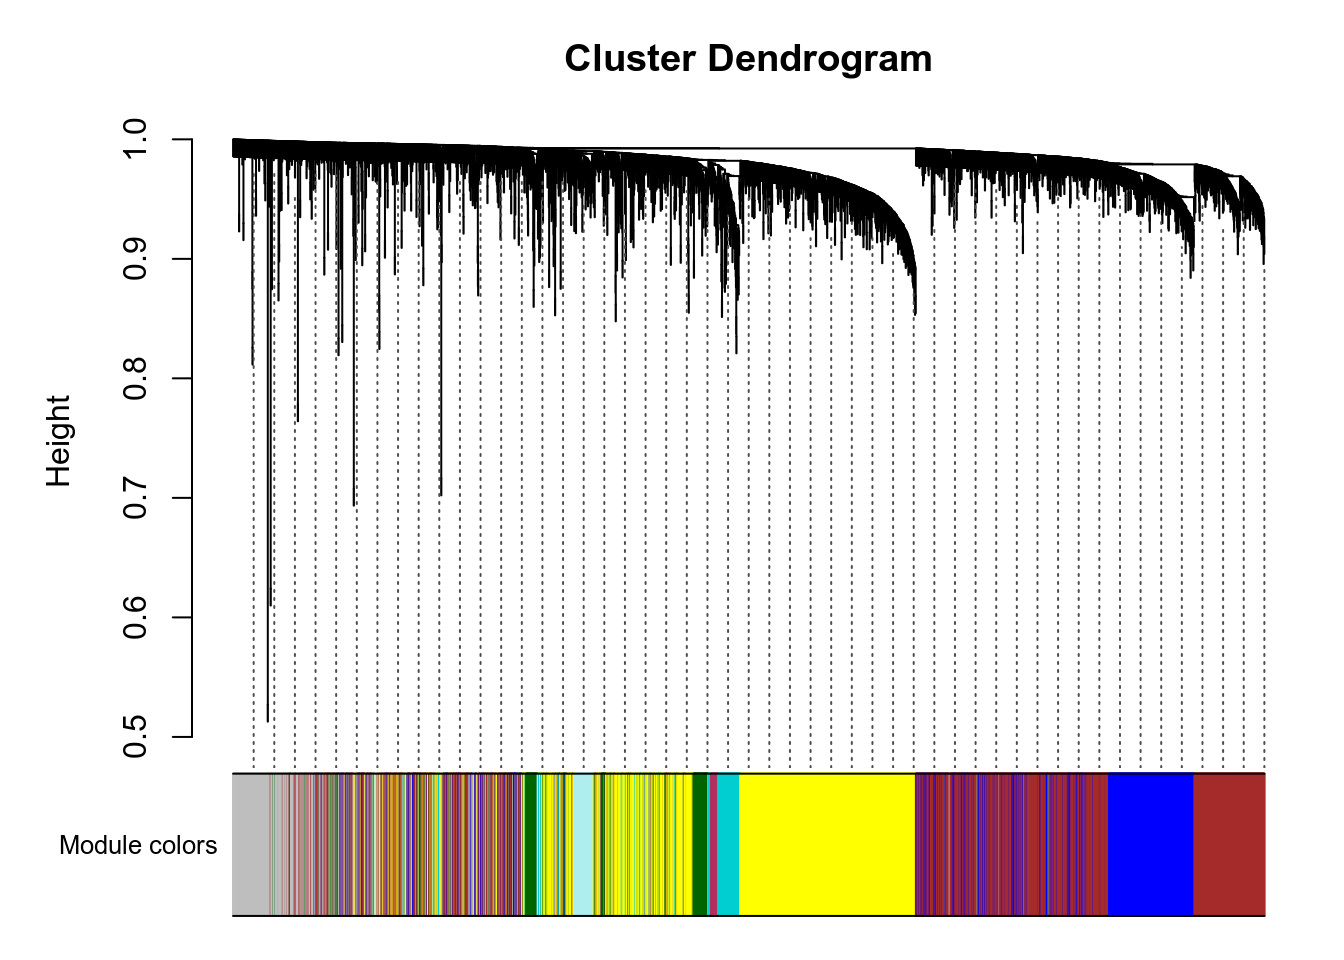
Here are the modules for a few genes of interest:
- VNN1 is in the turquoise module.
- PPARA is in the tan module.
- PPARD is in the grey module.
- PPARG is in the yellow module.
- PPARGC1A is in the royalblue module.
- PPARGC1B is in the tan module.
g:Profiler results for all modules are available here. Since there are many modules, you should expect at least 1 minute computation on the g:Profiler website for this query. Check below for faster queries focused on VNN1 module.
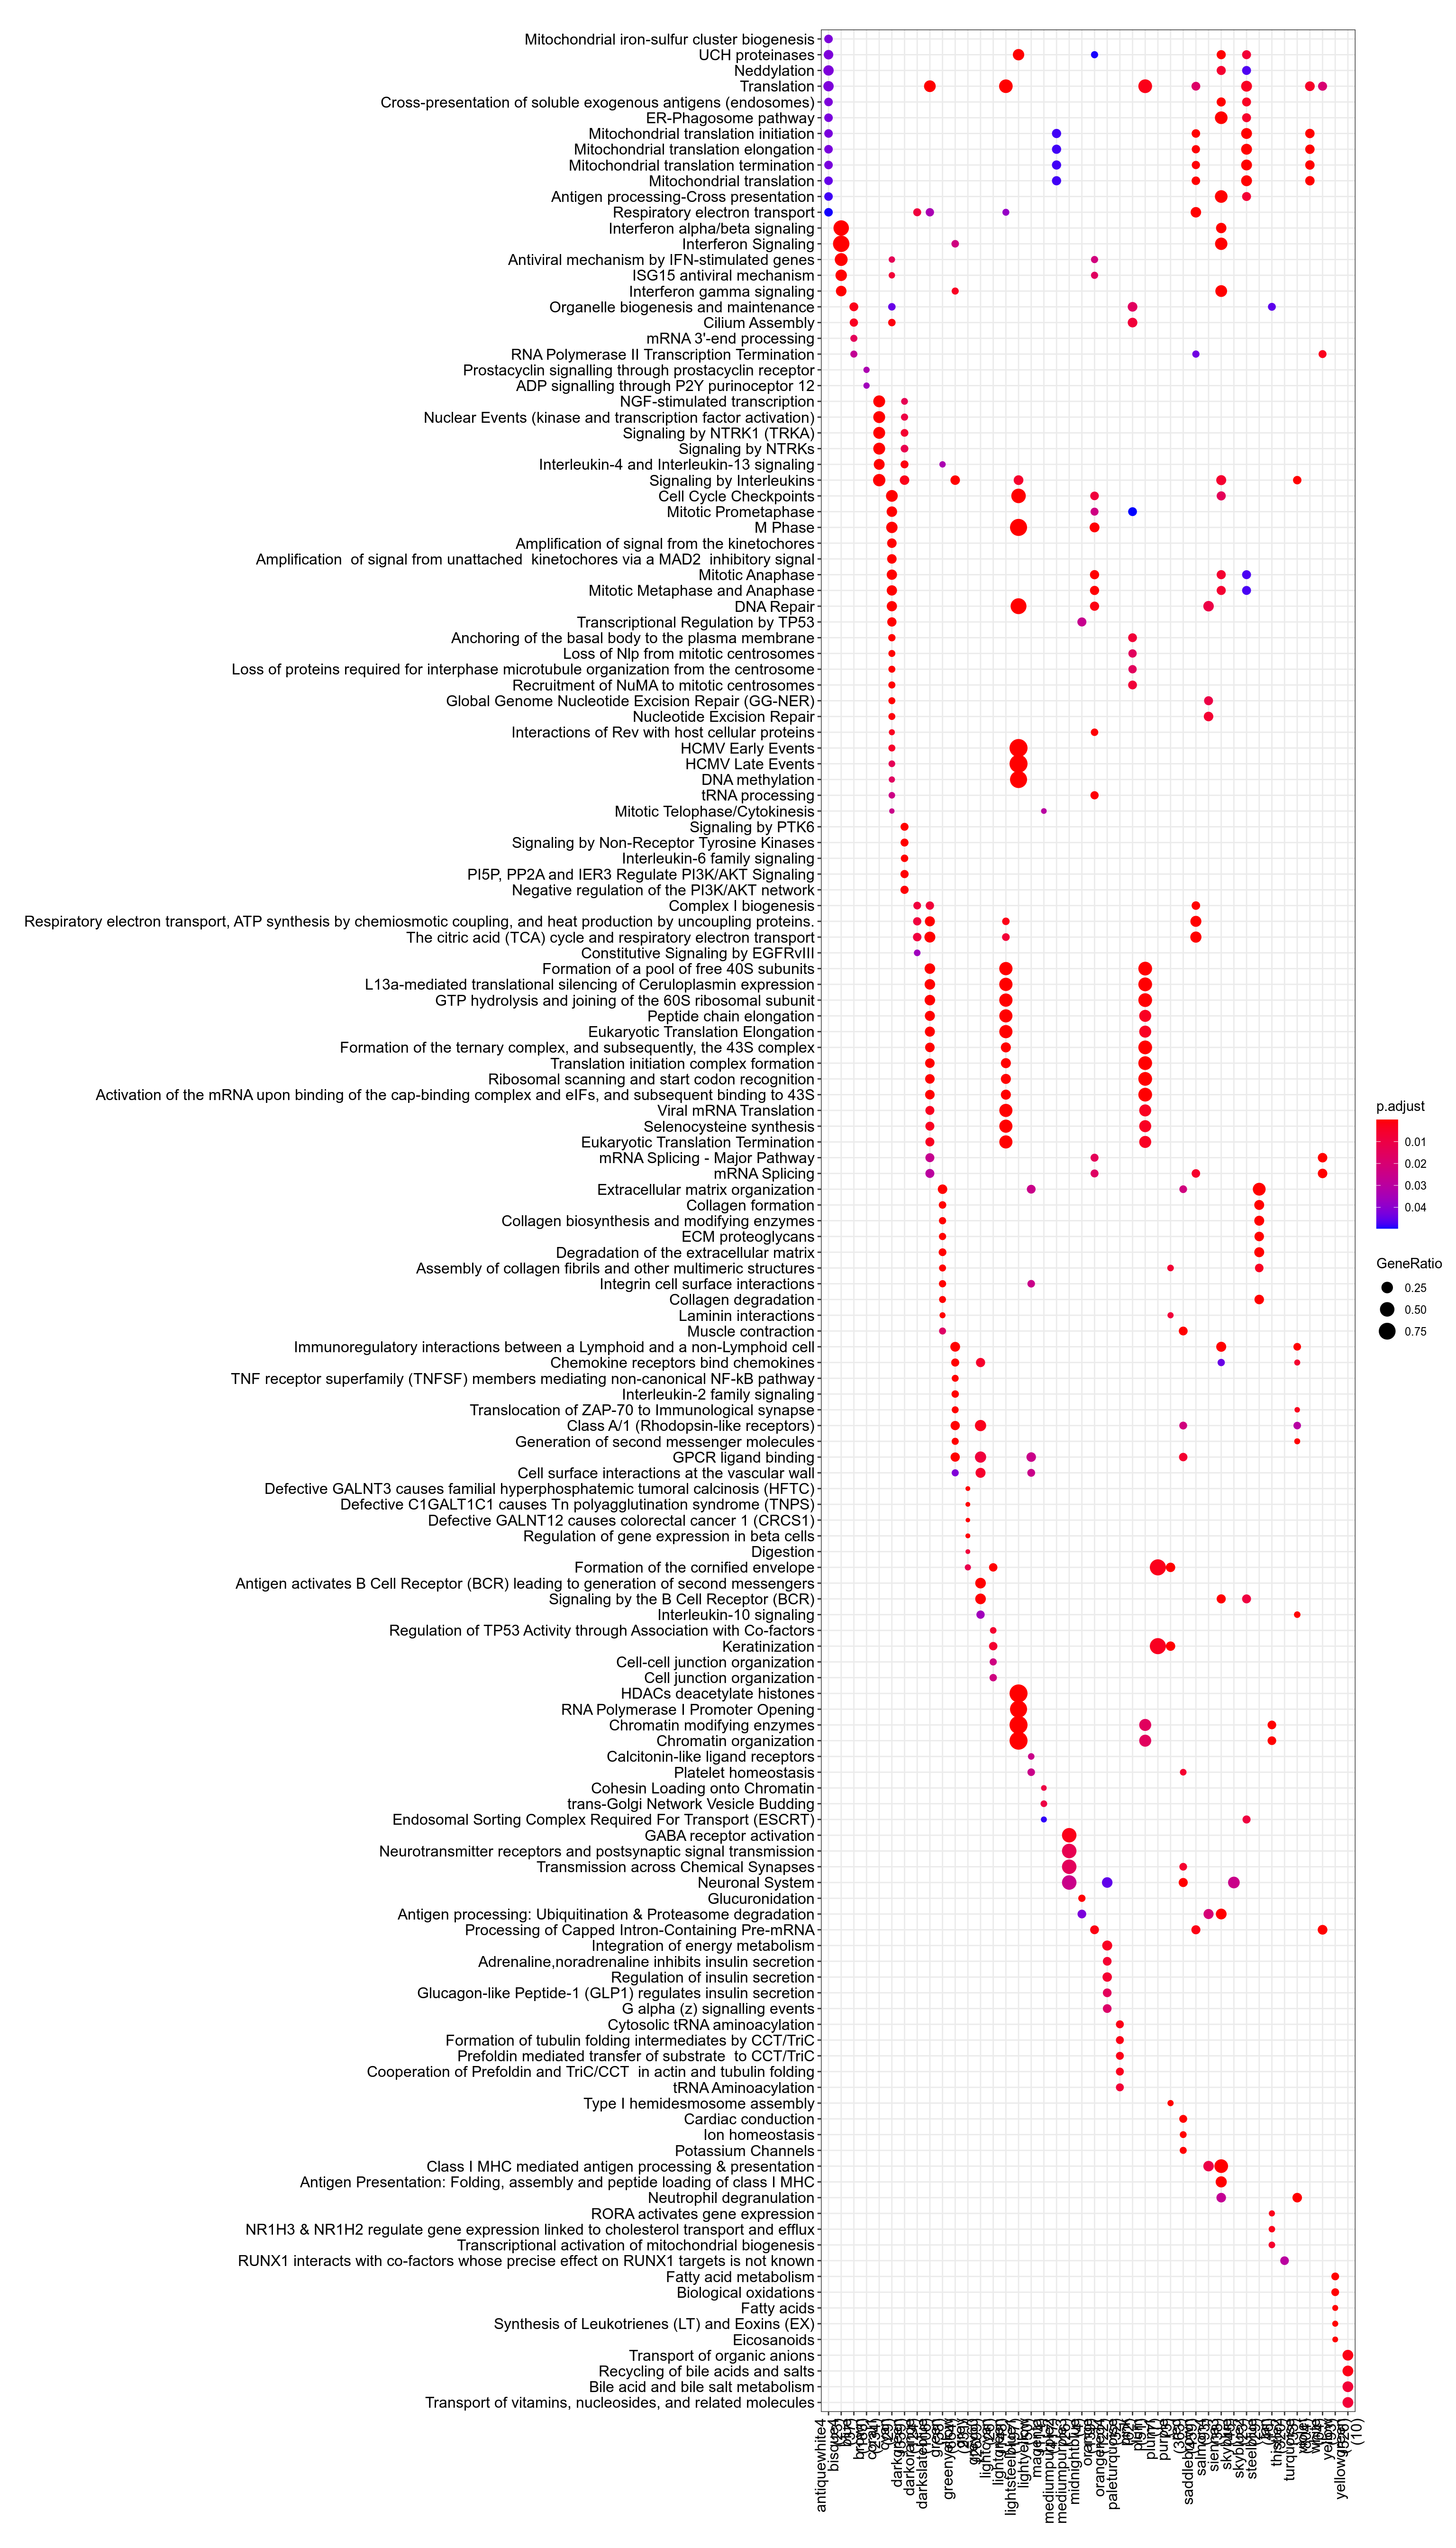
Figure 3.37: Pathway
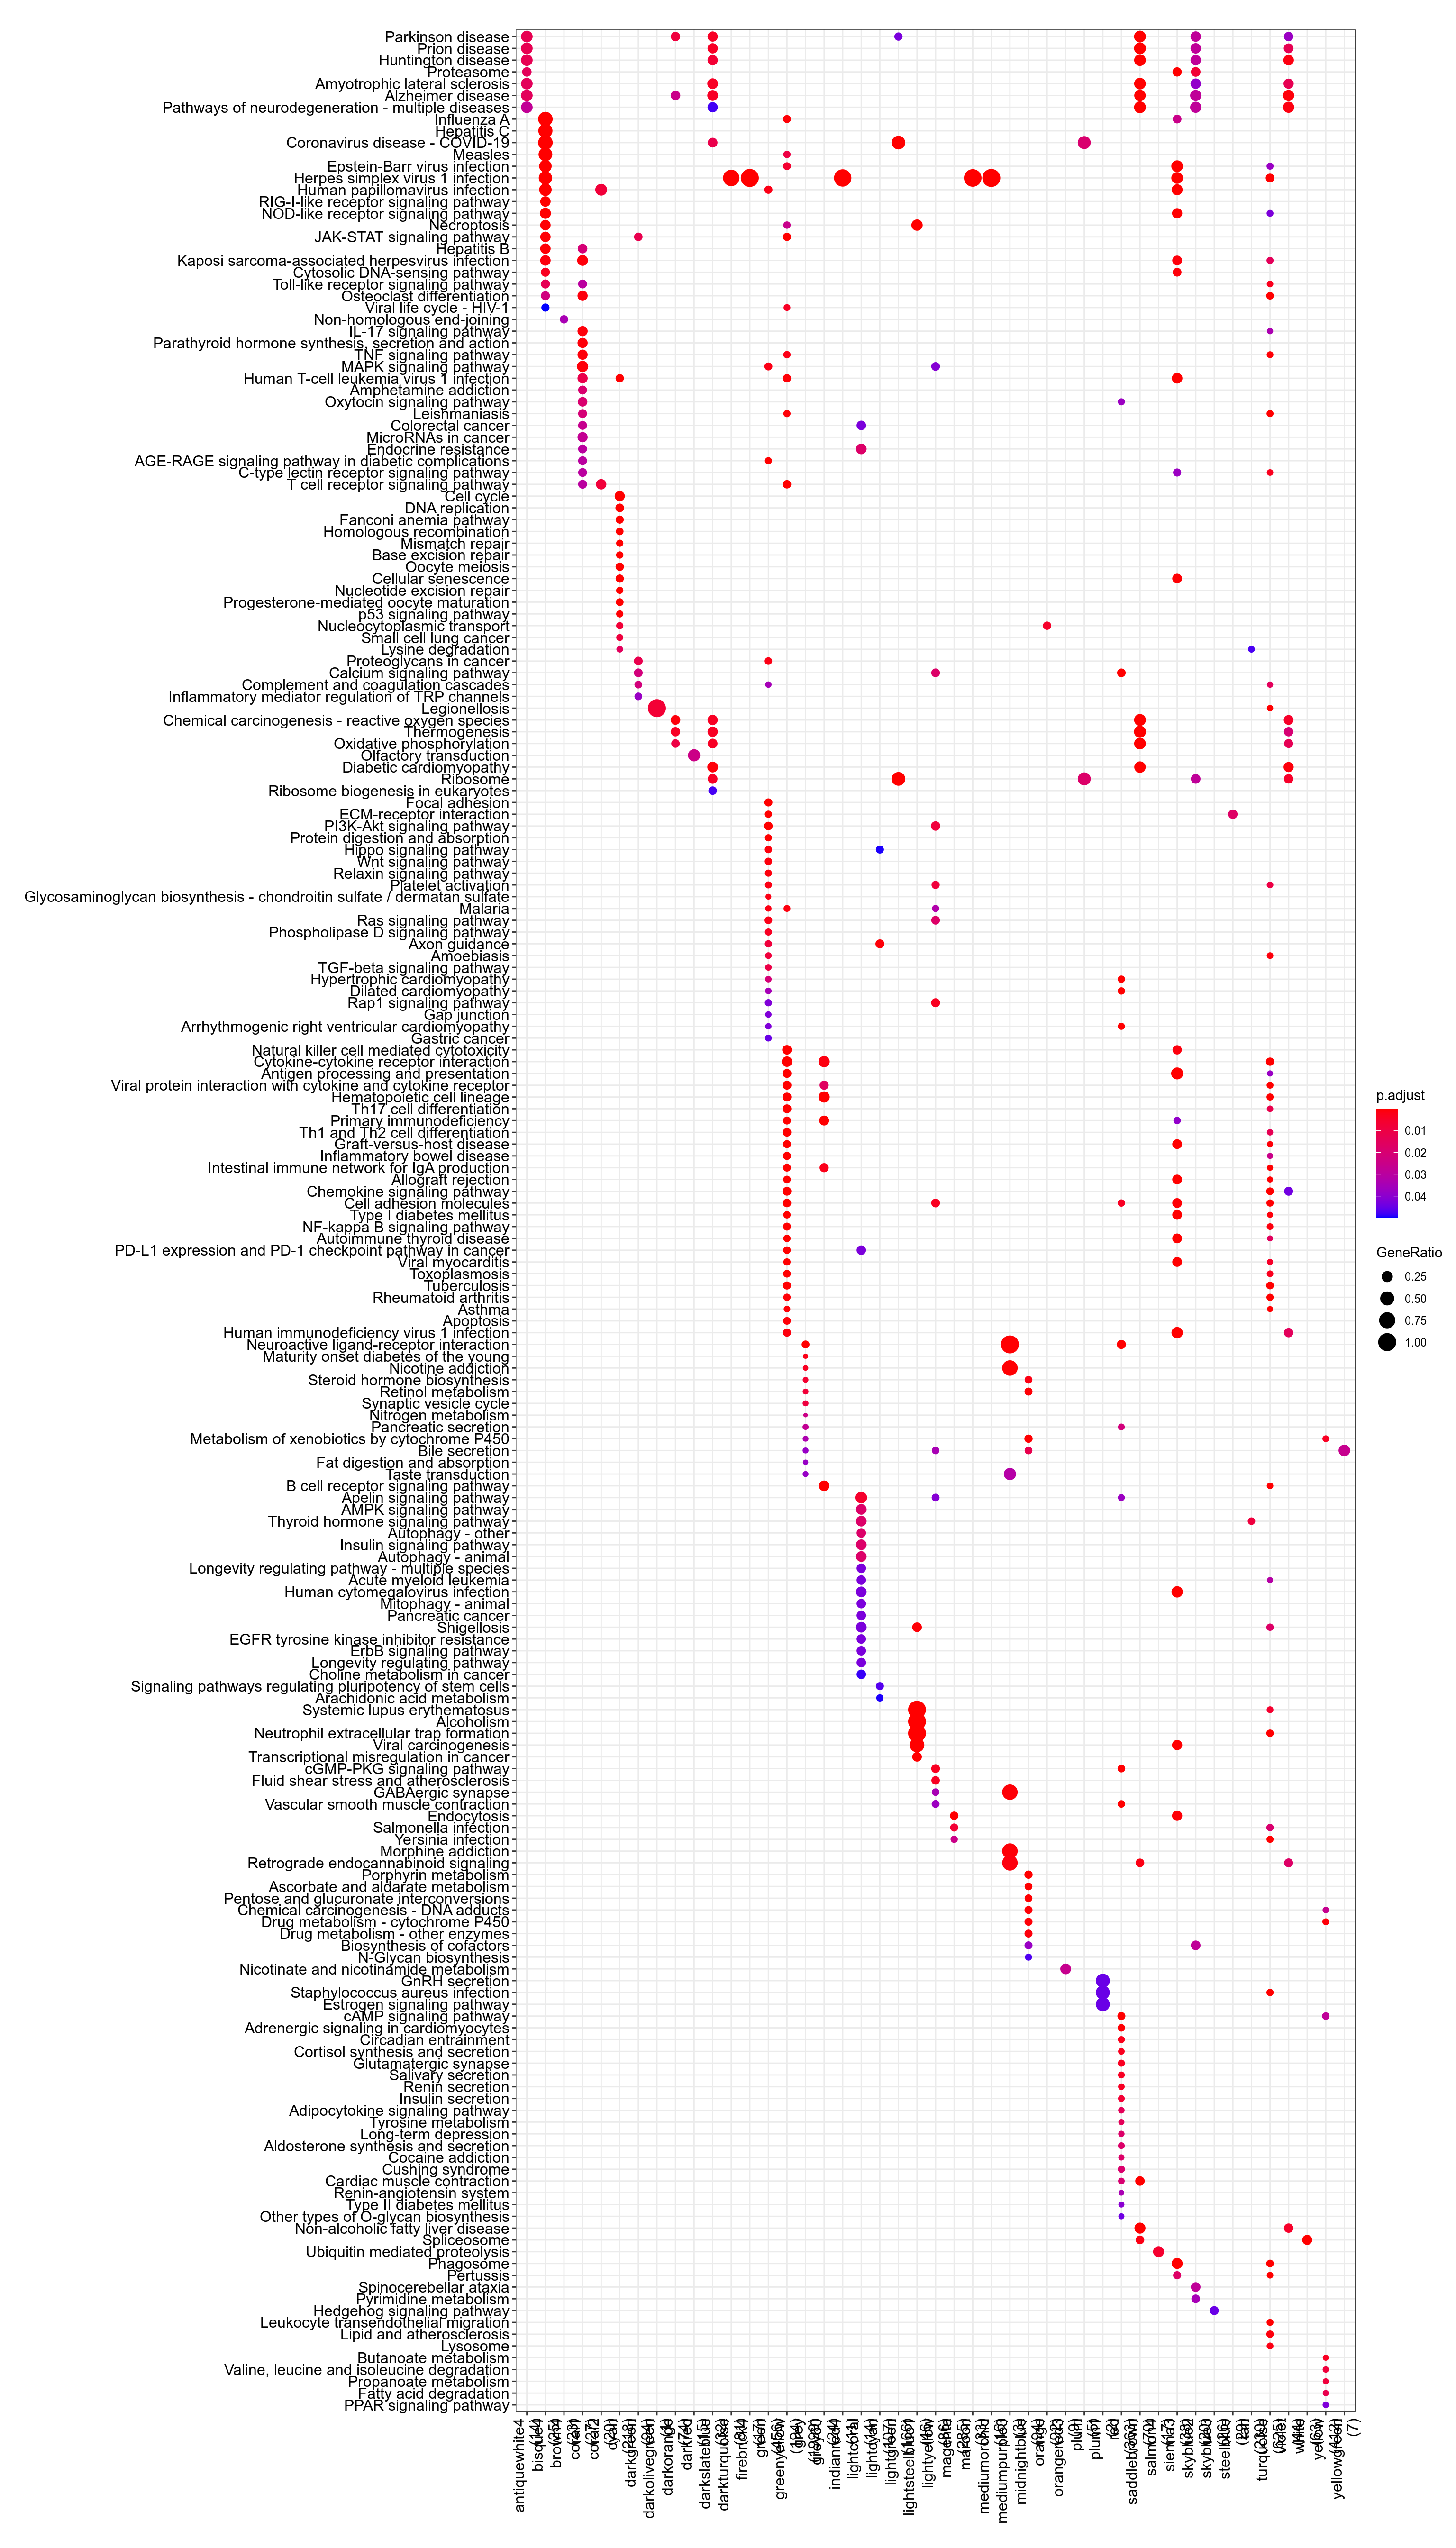
Figure 3.38: Kegg
.](_main_files/figure-html/resultsWgcnaProjectIdTcgaBlcaKnitPlotEnrichHallmarks-1.png)
Figure 3.39: MSigDb Hallmarks. readable pdf version.
## No enriched DO term in these classesTo check that module-to-genes reattribution is working as expected, heatmap of signal for VNN1 module is produced, both as absolute values and as Z-score ones.
.](../../../out/bookdown/VNN1_sarcoma/plots/resultsWgcnaProjectIdTcgaBlcaKnitPlotHeatmapVNN1ModuleAbsoluteValues.png)
Figure 3.40: log2(vst) signal in VNN1 module. Rows were gene name is prefixed with "-" display negative Z-score for these genes, meaning their signal is anticorrelated with other genes in the cluster. pdf version with readable genes and findable VNN1.
.](../../../out/bookdown/VNN1_sarcoma/plots/resultsWgcnaProjectIdTcgaBlcaKnitPlotHeatmapVNN1ModuleZscoreValues.png)
Figure 3.41: Zscore of log2(vst) signal in VNN1 module. Rows were gene name is prefixed with "-" display negative Z-score for these genes, meaning their signal is anticorrelated with other genes in the cluster. pdf version with readable genes and findable VNN1.
.](_main_files/figure-html/resultsWgcnaProjectIdTcgaBlcaKnitPlotGenesInVNN1ModuleCorPearson-1.png)
Figure 3.42: Genes in VNN1 module plotted by Pearson correlation against it. Details are available in this table.
- Enrichr results for all genes in VNN1 module are available here
- Enrichr results for genes in VNN1 module and positively correlated with it are available here
- Enrichr results for genes in VNN1 module and negatively correlated with it are available here
- g:Profiler results for all genes in VNN1 module are available here
- g:Profiler results for genes in VNN1 module and positively correlated with it are available here
- g:Profiler results for genes in VNN1 module and negatively correlated with it are available here
- g:Profiler results for comparison of the three queries above are available here