3.2.1.11 TCGA-STAD dataset
There are 36886 genes and 407 samples in the dataset.
All samples and genes look good for the analysis.
##    Power SFT.R.sq  slope truncated.R.sq  mean.k. median.k.  max.k.
## 1      1   0.0116  0.395          0.960 4.73e+03  4.66e+03 8360.00
## 2      3   0.6960 -2.260          0.978 2.82e+02  2.37e+02 1300.00
## 3      5   0.8970 -2.300          0.994 3.93e+01  2.27e+01  428.00
## 4      7   0.9490 -2.000          0.999 9.15e+00  3.02e+00  190.00
## 5      9   0.9520 -1.800          0.999 3.01e+00  5.18e-01  105.00
## 6     11   0.9480 -1.660          0.997 1.25e+00  1.11e-01   64.30
## 7     13   0.9290 -1.580          0.978 6.14e-01  2.70e-02   42.10
## 8     15   0.9490 -1.490          0.991 3.37e-01  7.22e-03   28.90
## 9     17   0.9420 -1.460          0.990 2.00e-01  2.10e-03   21.60
## 10    19   0.9210 -1.460          0.984 1.26e-01  6.39e-04   16.70
## 11    21   0.9270 -1.450          0.992 8.37e-02  1.98e-04   13.20
## 12    23   0.9240 -1.440          0.990 5.75e-02  6.49e-05   10.60
## 13    25   0.4390 -1.820          0.471 4.08e-02  2.15e-05    8.70
## 14    27   0.8940 -1.460          0.980 2.97e-02  7.21e-06    7.23
## 15    29   0.9010 -1.440          0.979 2.22e-02  2.49e-06    6.07

Network is computed using power=5.

Here are the modules for a few genes of interest:
- VNN1 is in the salmon module.
- PPARA is in the grey module.
- PPARD is in the grey module.
- PPARG is in the lightcyan module.
- PPARGC1A is in the grey module.
- PPARGC1B is in the darkred module.
g:Profiler results for all modules are available here. Since there are many modules, you should expect at least 1 minute computation on the g:Profiler website for this query. Check below for faster queries focused on VNN1 module.

Figure 3.81: Pathway
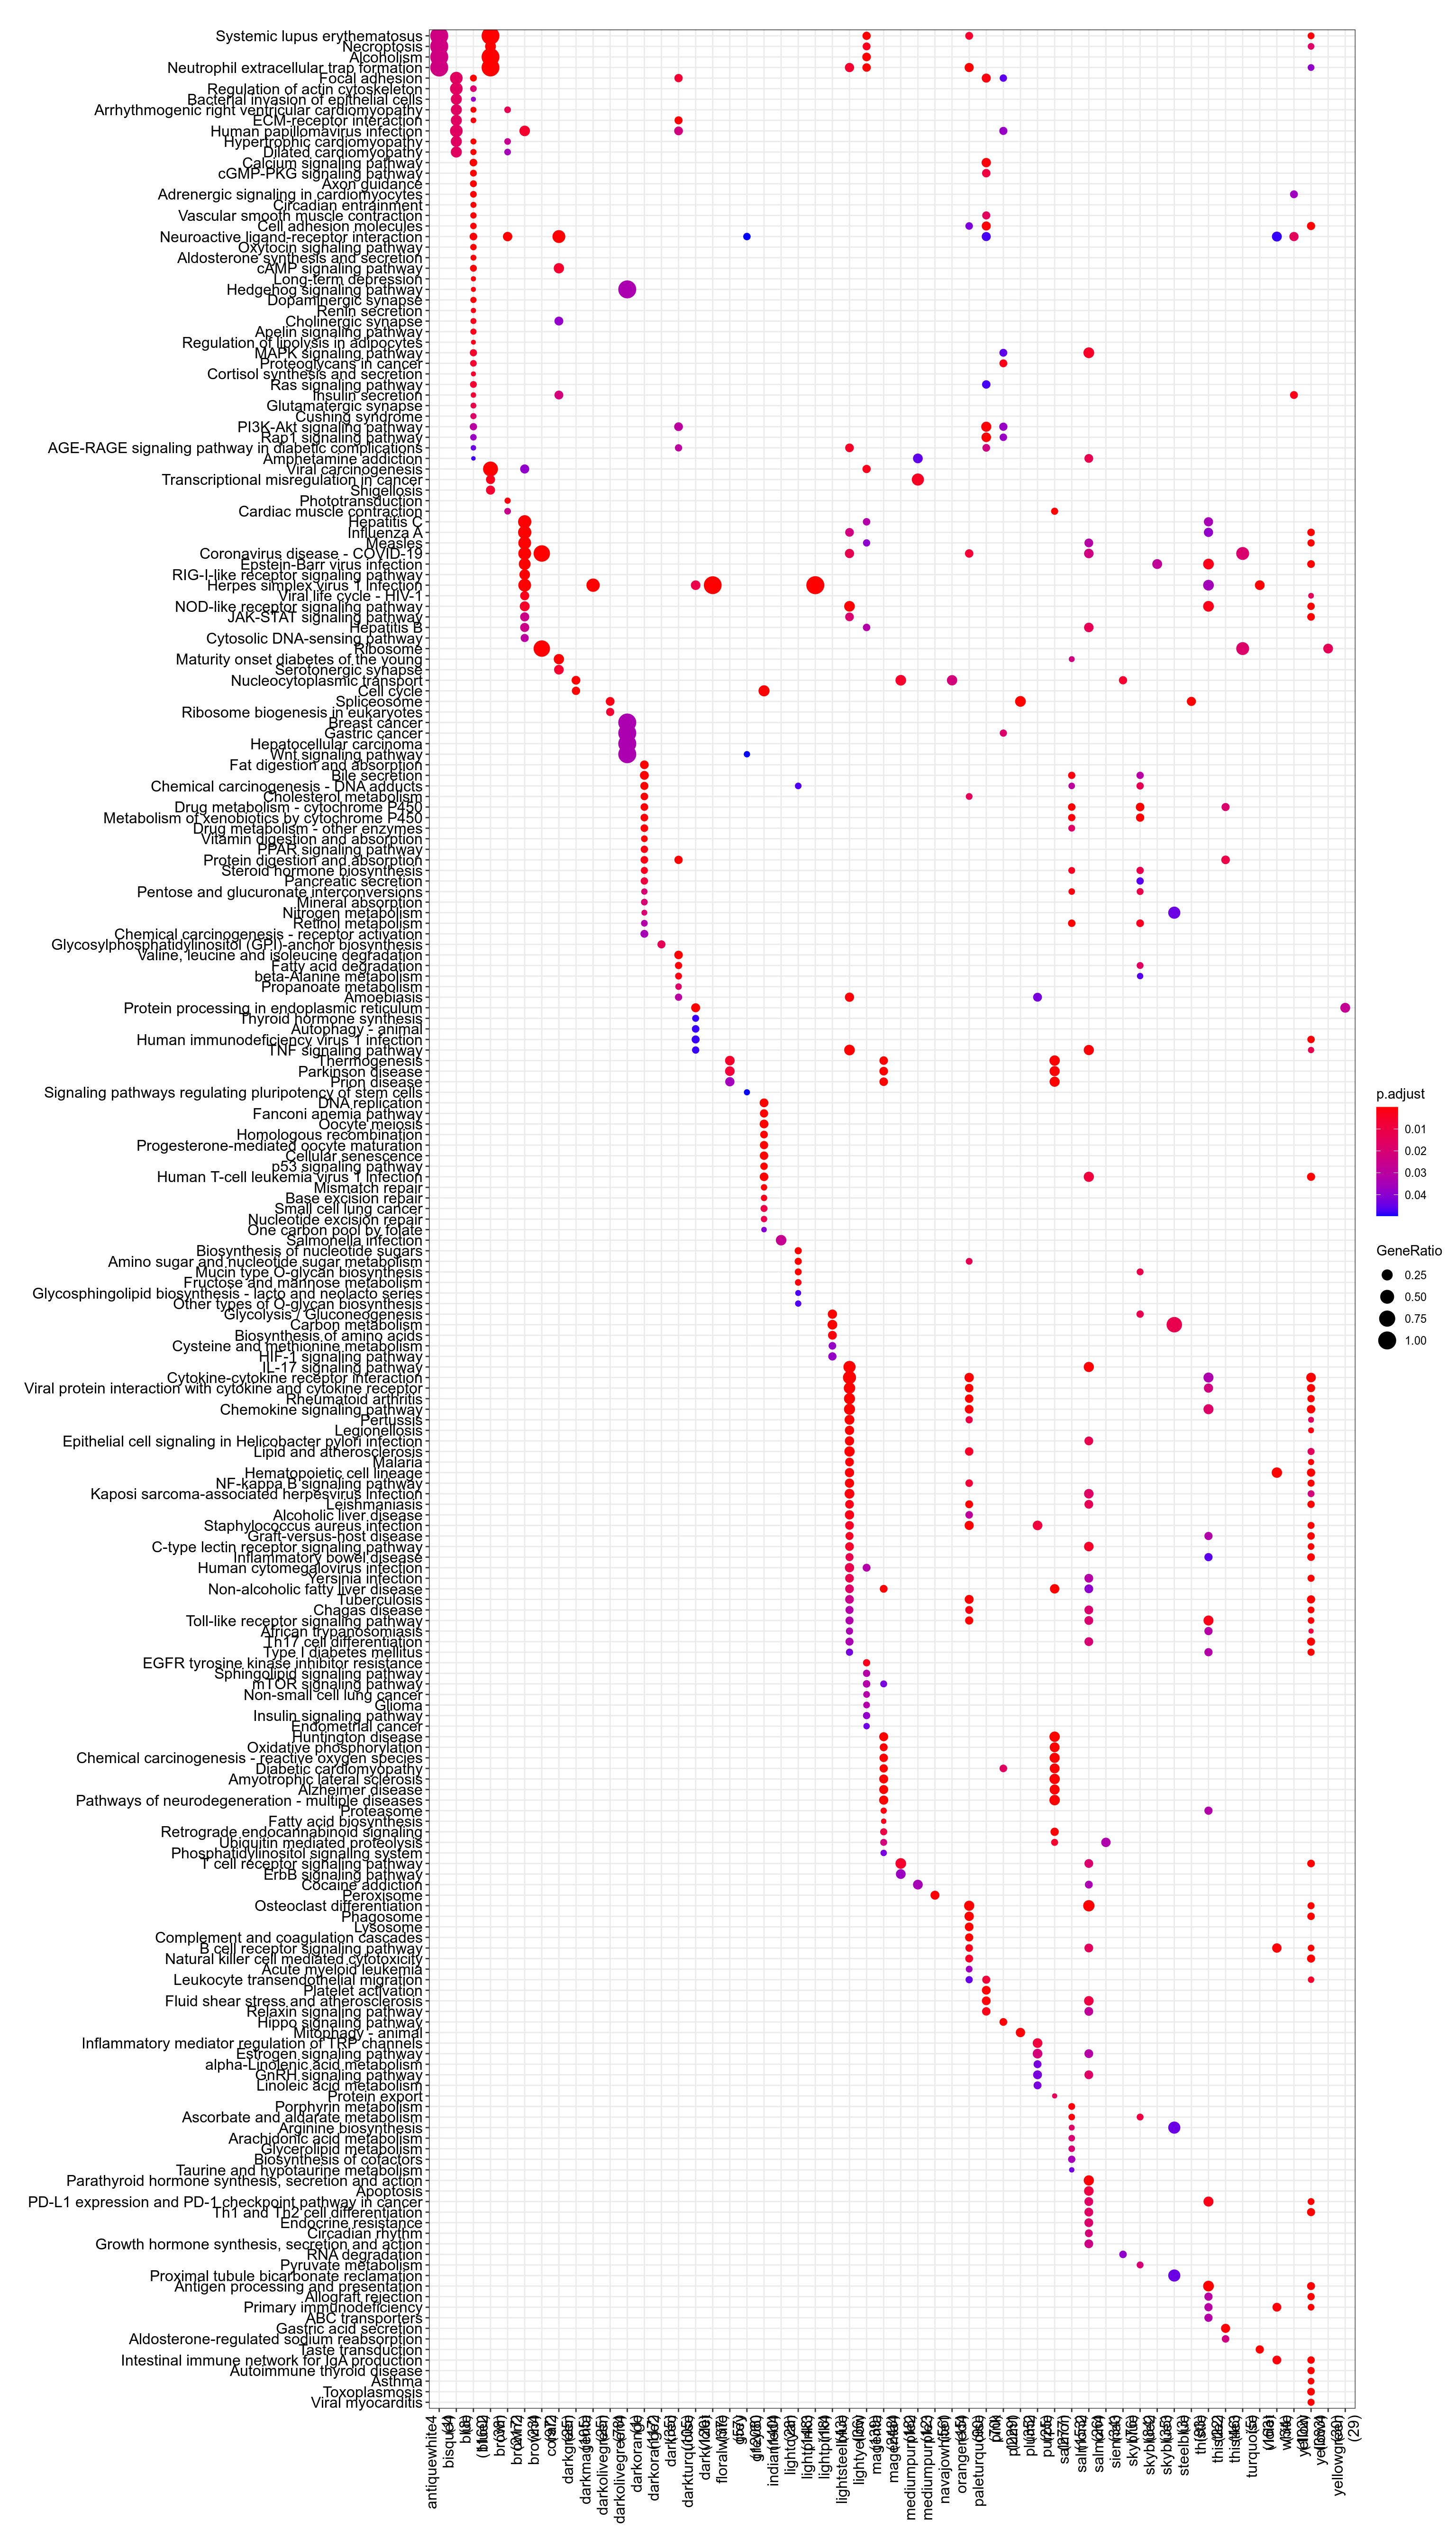
Figure 3.82: Kegg
.](_main_files/figure-html/resultsWgcnaProjectIdTcgaStadKnitPlotEnrichHallmarks-1.png)
Figure 3.83: MSigDb Hallmarks. readable pdf version.
## No enriched DO term in these classesTo check that module-to-genes reattribution is working as expected, heatmap of signal for VNN1 module is produced, both as absolute values and as Z-score ones.
.](../../../out/bookdown/VNN1_sarcoma/plots/resultsWgcnaProjectIdTcgaStadKnitPlotHeatmapVNN1ModuleAbsoluteValues.png)
Figure 3.84: log2(vst) signal in VNN1 module. Rows were gene name is prefixed with "-" display negative Z-score for these genes, meaning their signal is anticorrelated with other genes in the cluster. pdf version with readable genes and findable VNN1.
.](../../../out/bookdown/VNN1_sarcoma/plots/resultsWgcnaProjectIdTcgaStadKnitPlotHeatmapVNN1ModuleZscoreValues.png)
Figure 3.85: Zscore of log2(vst) signal in VNN1 module. Rows were gene name is prefixed with "-" display negative Z-score for these genes, meaning their signal is anticorrelated with other genes in the cluster. pdf version with readable genes and findable VNN1.
.](_main_files/figure-html/resultsWgcnaProjectIdTcgaStadKnitPlotGenesInVNN1ModuleCorPearson-1.png)
Figure 3.86: Genes in VNN1 module plotted by Pearson correlation against it. Details are available in this table.
- Enrichr results for all genes in VNN1 module are available here
- Enrichr results for genes in VNN1 module and positively correlated with it are available here
- Enrichr results for genes in VNN1 module and negatively correlated with it are available here
- g:Profiler results for all genes in VNN1 module are available here
- g:Profiler results for genes in VNN1 module and positively correlated with it are available here
- g:Profiler results for genes in VNN1 module and negatively correlated with it are available here
- g:Profiler results for comparison of the three queries above are available here