3.2.1.9 TCGA-OV dataset
There are 36886 genes and 379 samples in the dataset.
At least some samples or genes look not suitable for the co-expression analysis. After removing them, there remain 36881 genes and 379 samples.
##    Power SFT.R.sq slope truncated.R.sq  mean.k. median.k. max.k.
## 1      1    0.242 -1.65          0.970 3.39e+03  3.28e+03 6720.0
## 2      3    0.793 -2.29          0.966 1.23e+02  8.79e+01  749.0
## 3      5    0.915 -1.98          0.989 1.36e+01  5.30e+00  214.0
## 4      7    0.939 -1.78          0.999 3.10e+00  5.67e-01  122.0
## 5      9    0.946 -1.64          0.991 1.12e+00  9.07e-02   83.1
## 6     11    0.958 -1.54          0.991 5.25e-01  1.83e-02   60.7
## 7     13    0.964 -1.49          0.994 2.89e-01  4.31e-03   46.4
## 8     15    0.960 -1.46          0.989 1.75e-01  1.12e-03   36.5
## 9     17    0.961 -1.43          0.982 1.15e-01  3.06e-04   29.4
## 10    19    0.966 -1.41          0.984 7.87e-02  8.74e-05   24.0
## 11    21    0.971 -1.40          0.990 5.62e-02  2.56e-05   19.9
## 12    23    0.971 -1.39          0.989 4.13e-02  7.76e-06   16.7
## 13    25    0.975 -1.37          0.988 3.12e-02  2.37e-06   14.2
## 14    27    0.976 -1.37          0.986 2.40e-02  7.32e-07   12.1
## 15    29    0.973 -1.37          0.990 1.87e-02  2.33e-07   10.4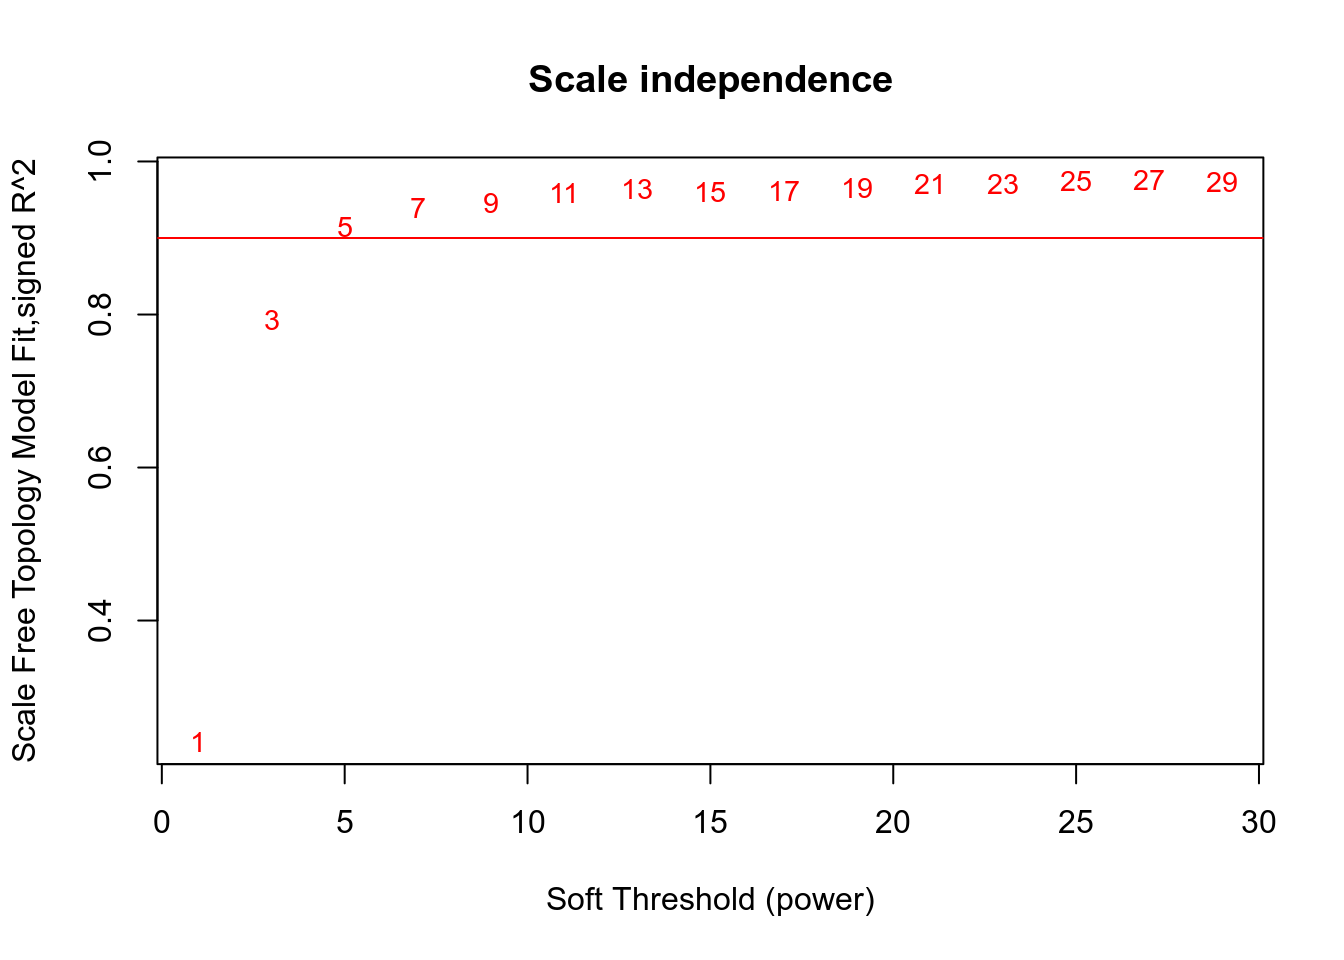
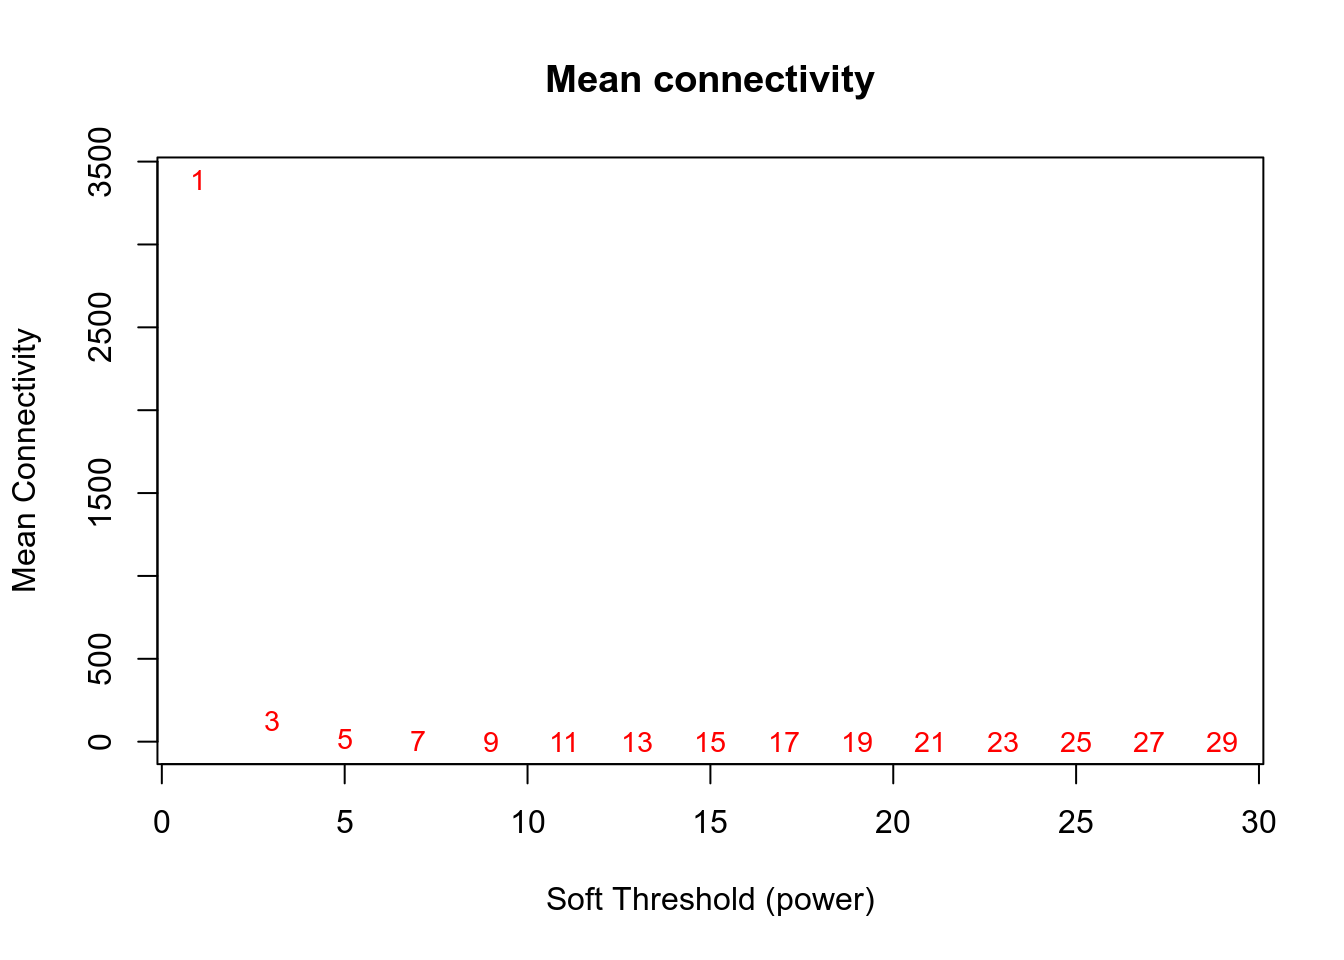
Network is computed using power=5.
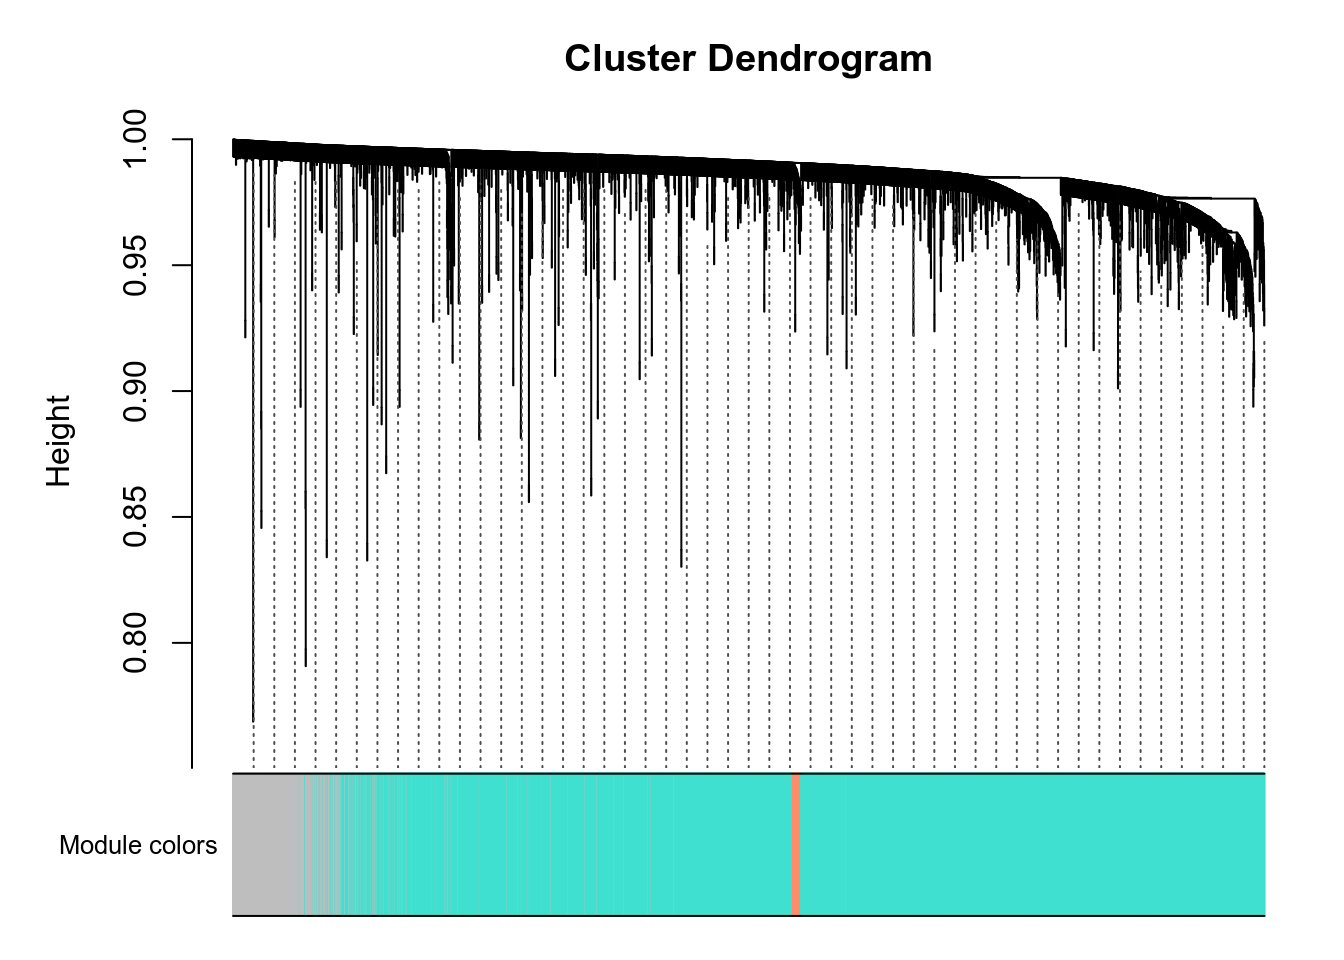
Here are the modules for a few genes of interest:
- VNN1 is in the green module.
- PPARA is in the brown module.
- PPARD is in the skyblue4 module.
- PPARG is in the yellow module.
- PPARGC1A is in the greenyellow module.
- PPARGC1B is in the turquoise module.
g:Profiler results for all modules are available here. Since there are many modules, you should expect at least 1 minute computation on the g:Profiler website for this query. Check below for faster queries focused on VNN1 module.
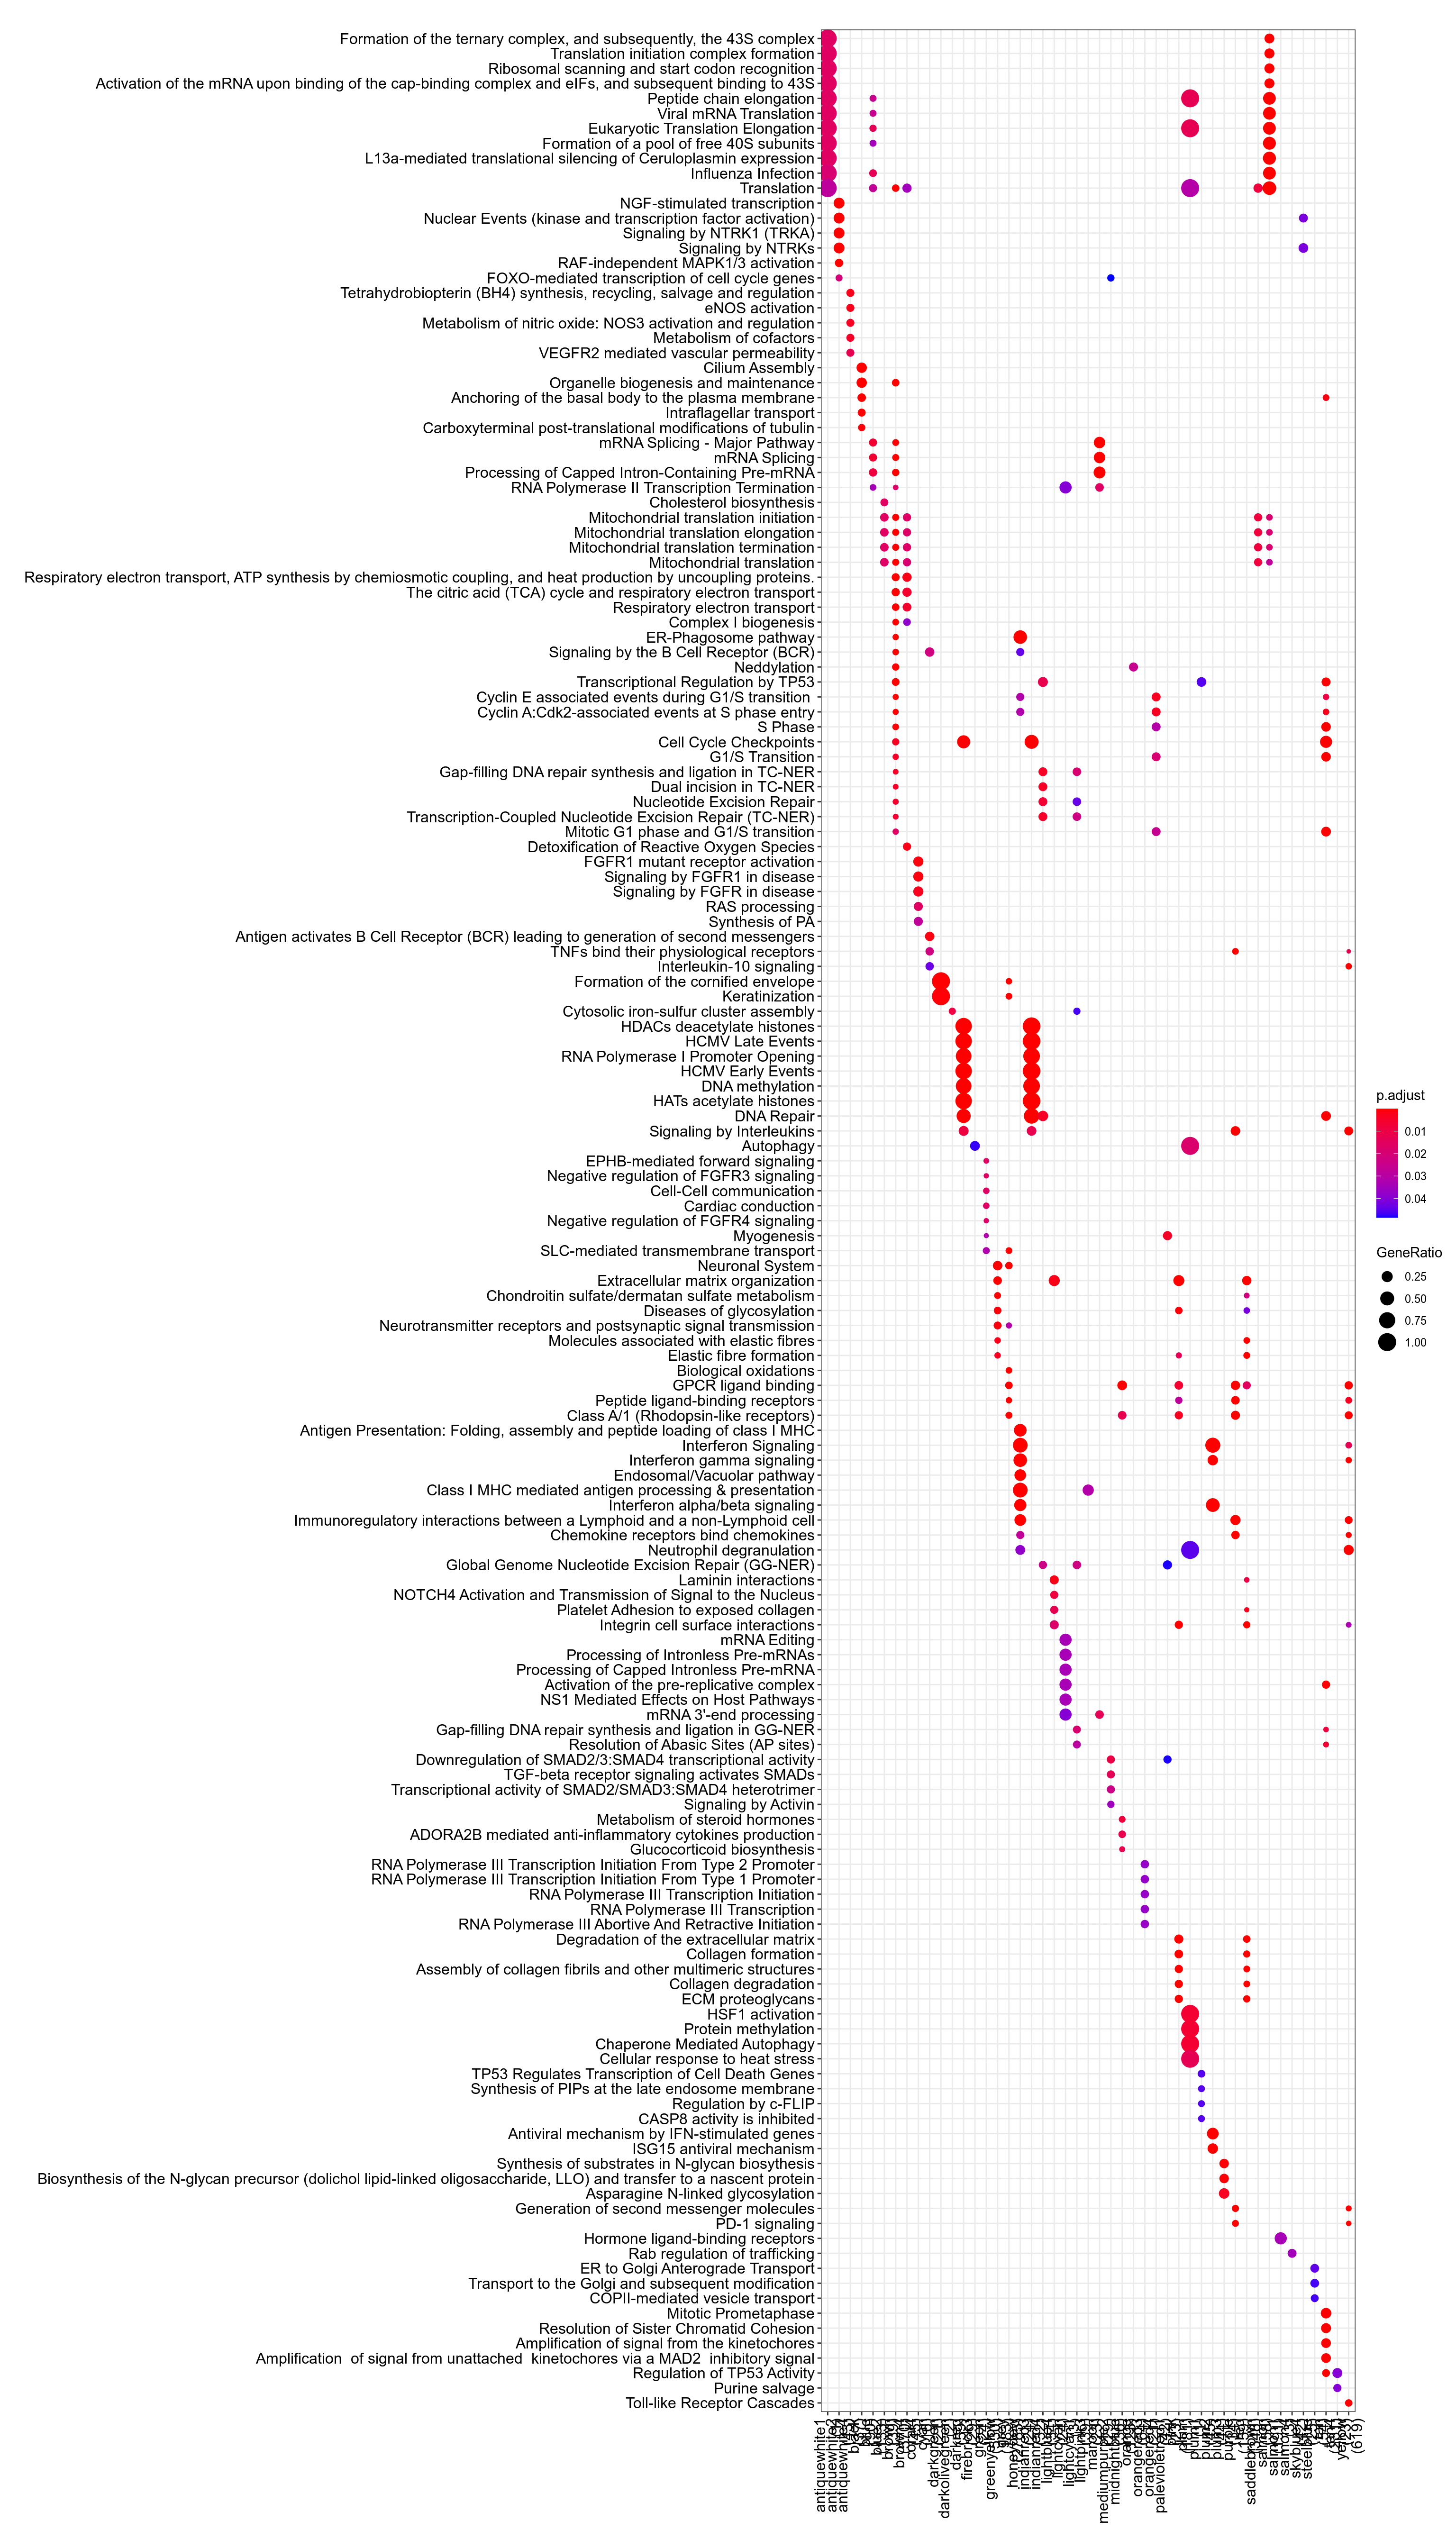
Figure 3.69: Pathway
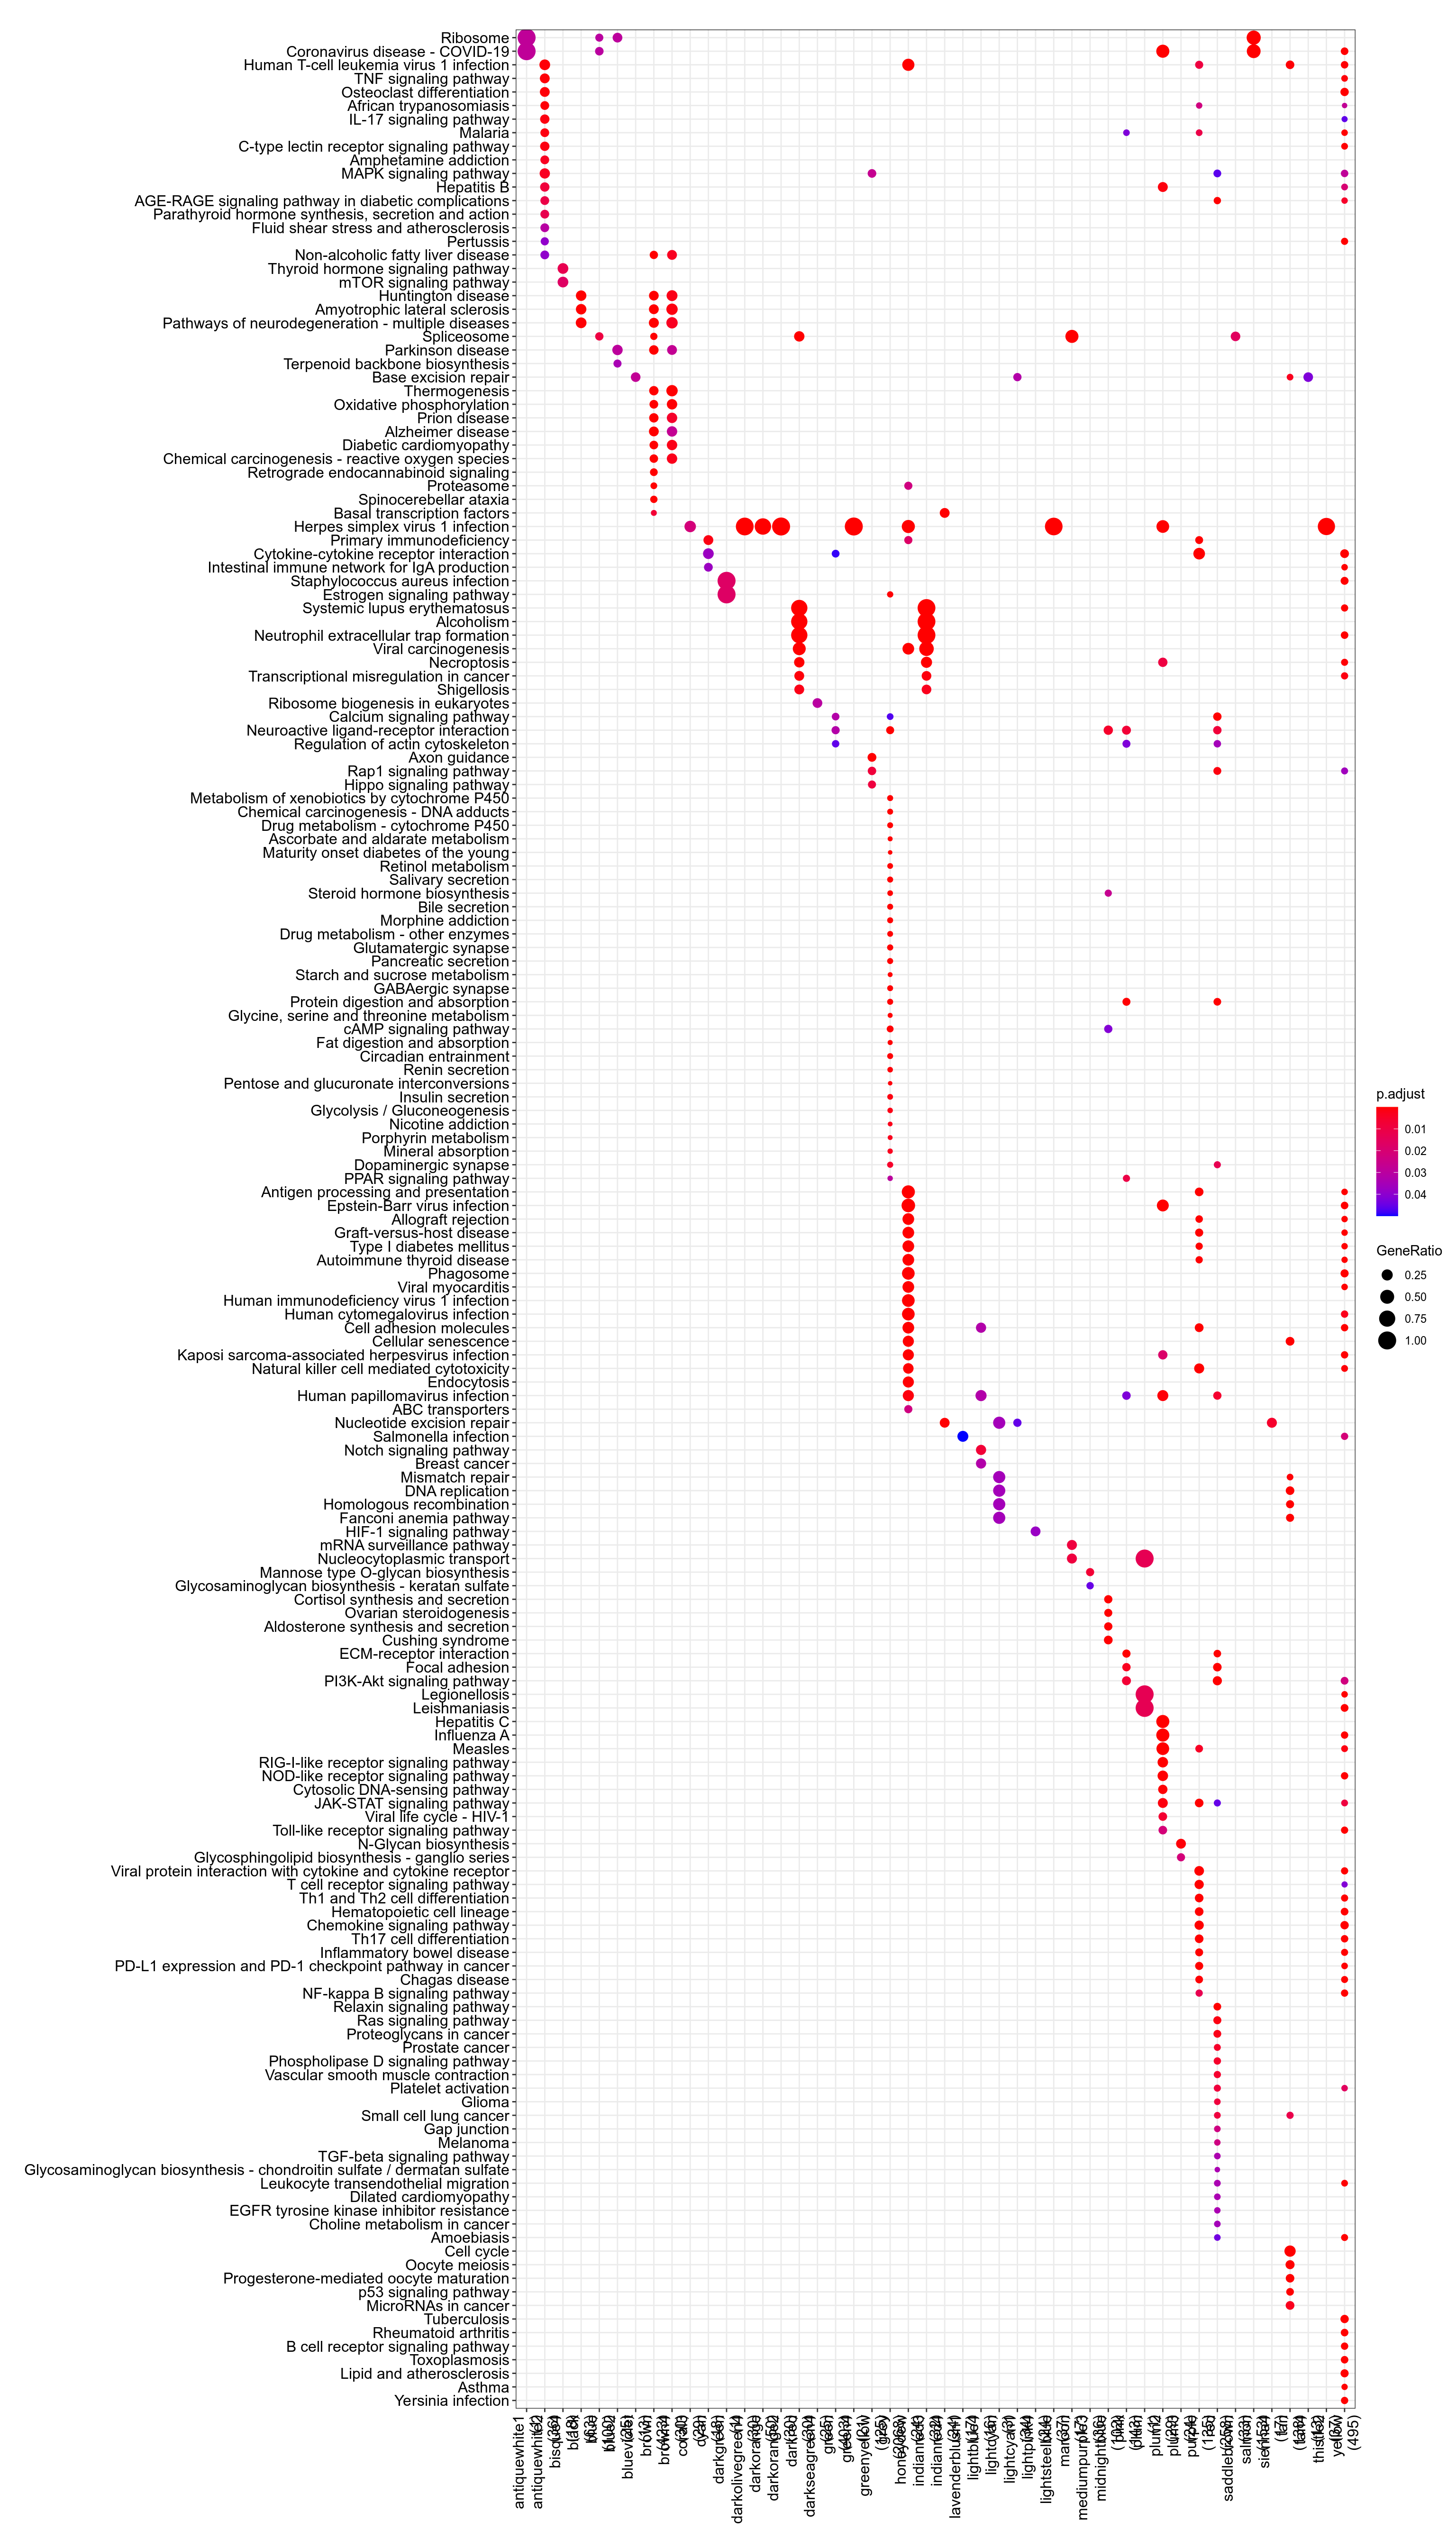
Figure 3.70: Kegg
.](_main_files/figure-html/resultsWgcnaProjectIdTcgaOvKnitPlotEnrichHallmarks-1.png)
Figure 3.71: MSigDb Hallmarks. readable pdf version.
## No enriched DO term in these classesTo check that module-to-genes reattribution is working as expected, heatmap of signal for VNN1 module is produced, both as absolute values and as Z-score ones.
.](../../../out/bookdown/VNN1_sarcoma/plots/resultsWgcnaProjectIdTcgaOvKnitPlotHeatmapVNN1ModuleAbsoluteValues.png)
Figure 3.72: log2(vst) signal in VNN1 module. Rows were gene name is prefixed with "-" display negative Z-score for these genes, meaning their signal is anticorrelated with other genes in the cluster. pdf version with readable genes and findable VNN1.
.](../../../out/bookdown/VNN1_sarcoma/plots/resultsWgcnaProjectIdTcgaOvKnitPlotHeatmapVNN1ModuleZscoreValues.png)
Figure 3.73: Zscore of log2(vst) signal in VNN1 module. Rows were gene name is prefixed with "-" display negative Z-score for these genes, meaning their signal is anticorrelated with other genes in the cluster. pdf version with readable genes and findable VNN1.
.](_main_files/figure-html/resultsWgcnaProjectIdTcgaOvKnitPlotGenesInVNN1ModuleCorPearson-1.png)
Figure 3.74: Genes in VNN1 module plotted by Pearson correlation against it. Details are available in this table.
- Enrichr results for all genes in VNN1 module are available here
- Enrichr results for genes in VNN1 module and positively correlated with it are available here
- Enrichr results for genes in VNN1 module and negatively correlated with it are available here
- g:Profiler results for all genes in VNN1 module are available here
- g:Profiler results for genes in VNN1 module and positively correlated with it are available here
- g:Profiler results for genes in VNN1 module and negatively correlated with it are available here
- g:Profiler results for comparison of the three queries above are available here