4.3.2 Using original specie Gene.name
In this section, integration analysis are done without conversion to human ortholog. Conversion from mouse to rat or vice-versa is irrelevant because Gene.name are mostly shared, and when they are not, there is no ortholog available for conversion.
4.3.2.1 Mouse Fluoxetine VS Control for Stressed in Dentate Gyrus
This section corresponds to the first meta-analysis requested by El Chérif.
| id | design |
|---|---|
| 1-GSE43261 | GSE43261-FluoxetineResponderVsControl |
| 2-GSE84185 | GSE84185-FluoxetineVsControlForStressedResponderInDentateGyrus |
| 3-SRP057486 | SRP057486-FluoxetineVsVehicleForBrainCA1StressedSubset |
| 4-Surget2009 | Surget2009-FluoxetineVsSalineForStressedInDentateGyrus |
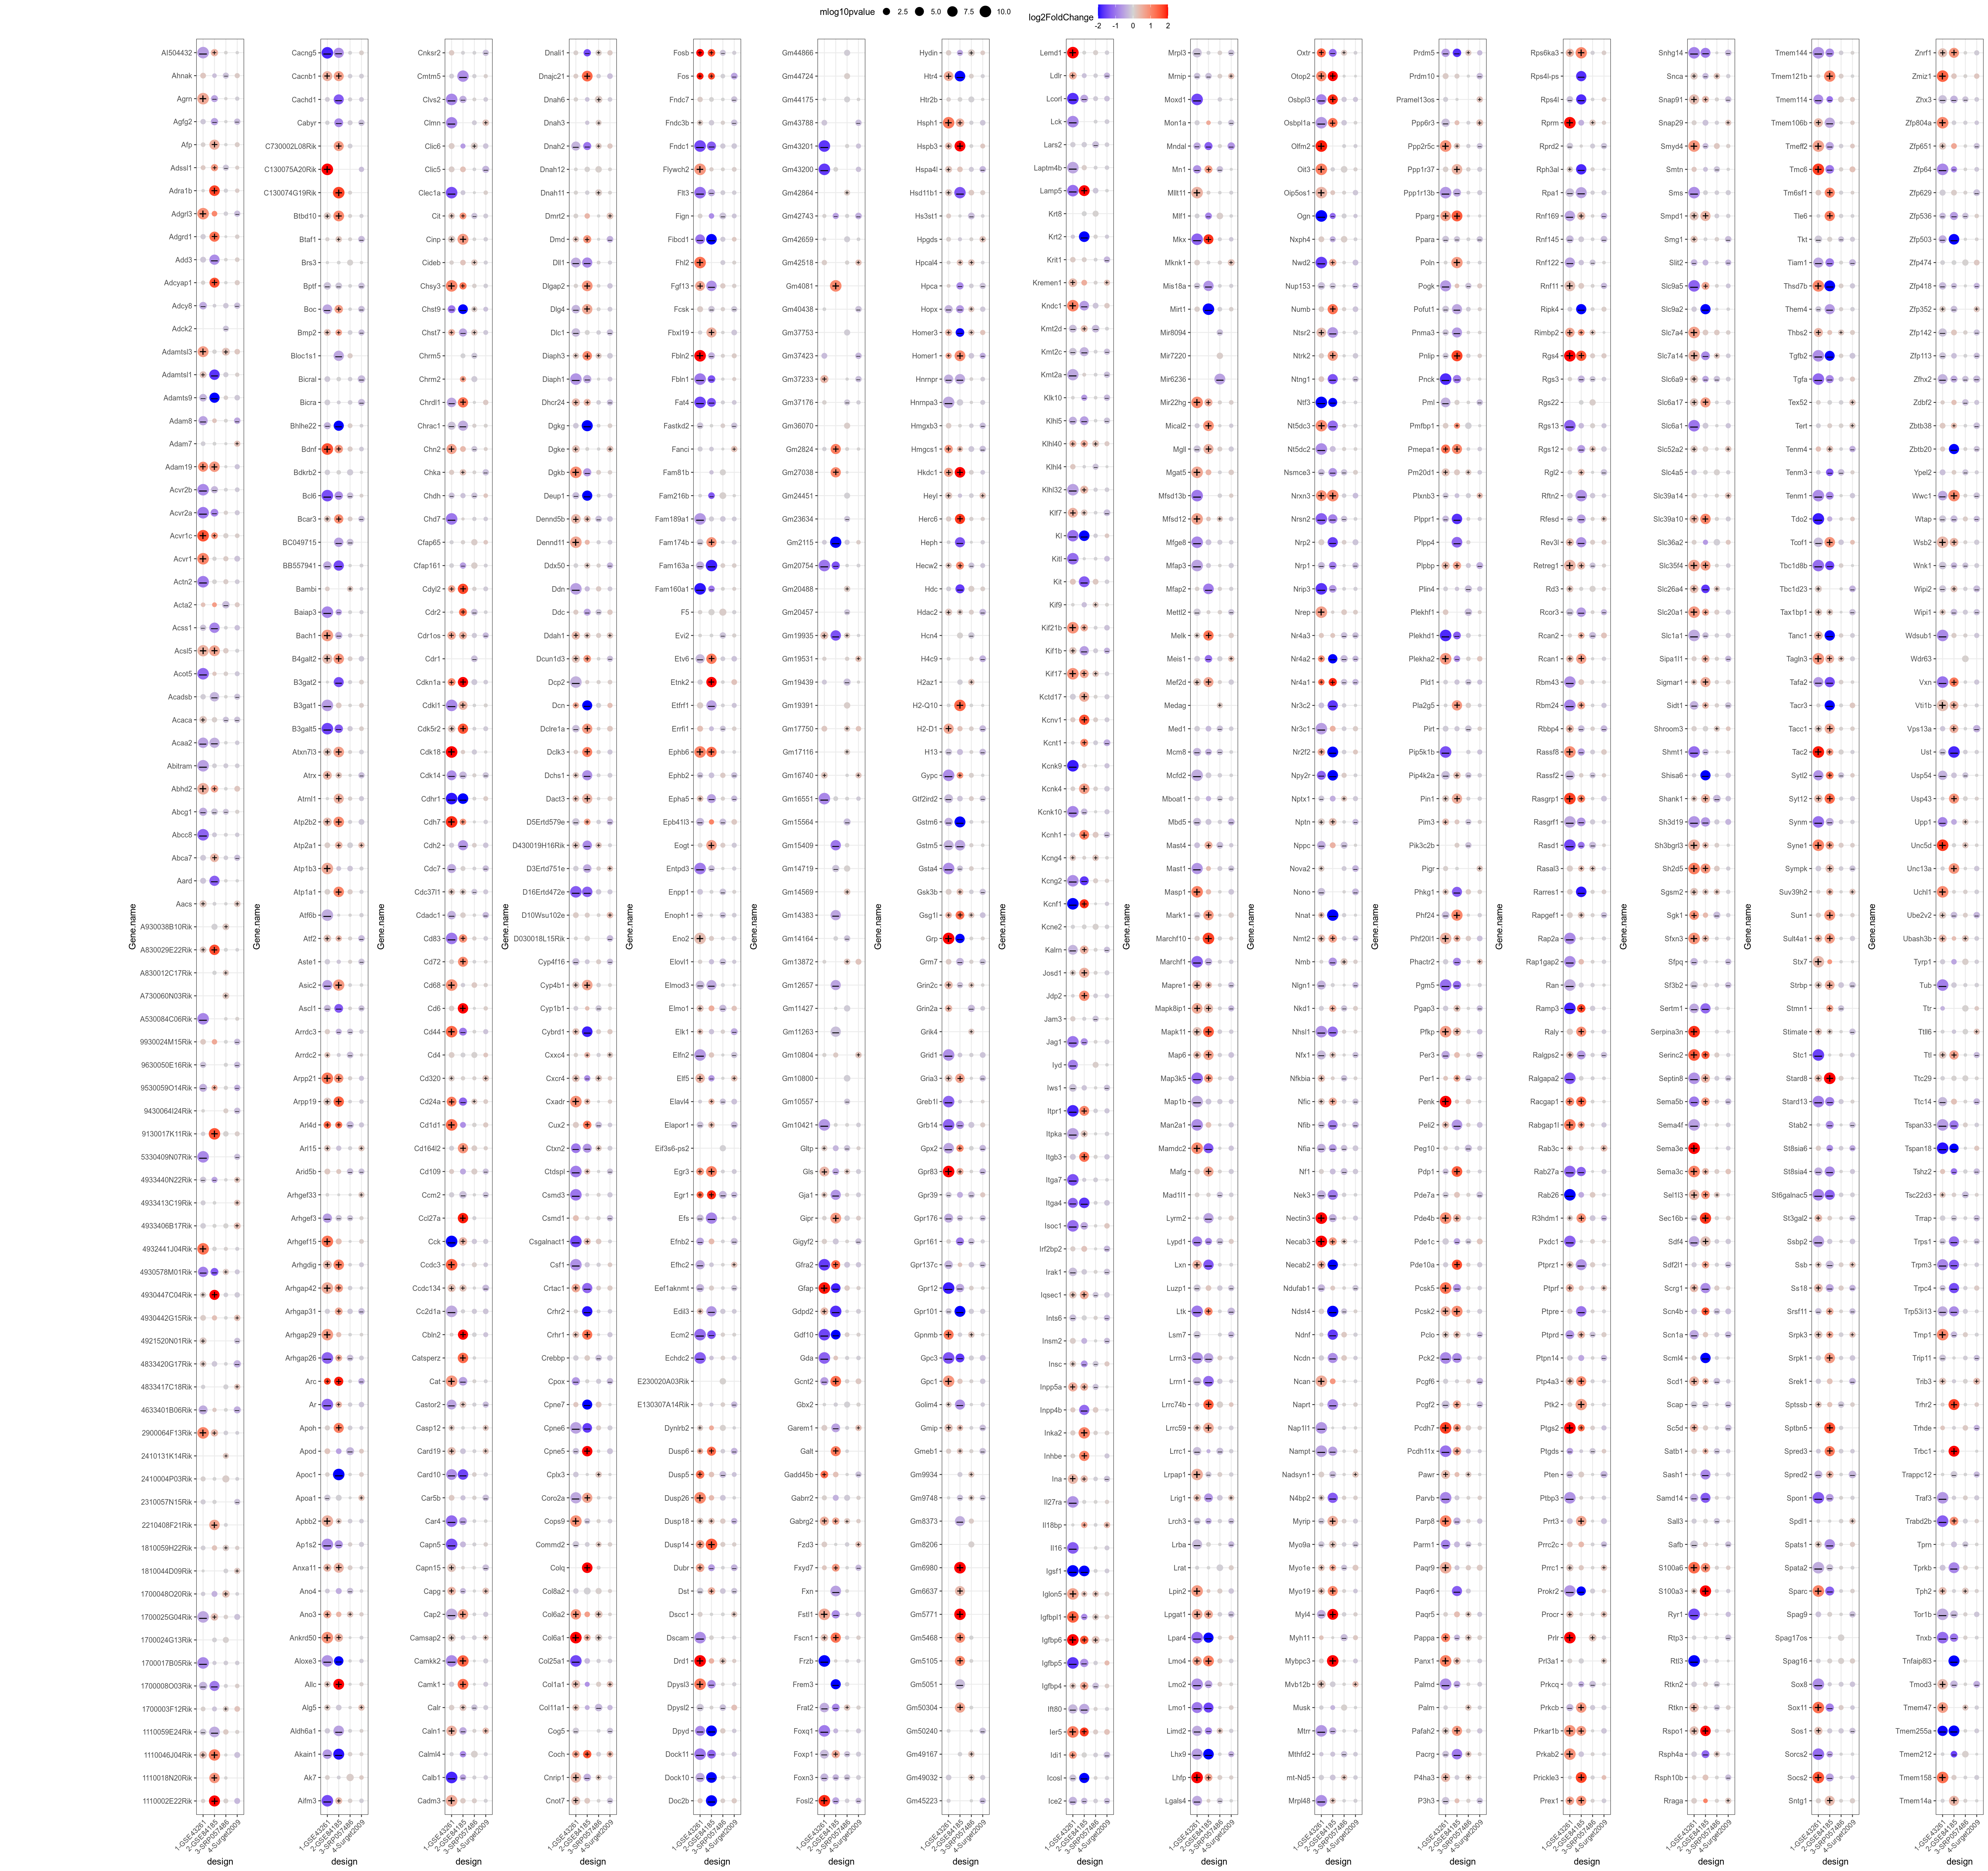
Figure 4.96: Alphabetically-sorted genes significant in at least one comparison (p-value < 0.05 and pvalue rank < 301). + and – signs highlight respectively upregulated and downregulated genes (|logFoldChange| > 0.1 and raw pvalue < 0.05).
The xlsx table with all genes is available here
](_main_files/figure-html/resultsIntegrationOriginalSpecieMouseFluoxetineVsControlForStressedConsensus-1.png)
Figure 4.97: Consensus-sorted genes significant in at least one comparison (p-value < 0.05 and p-value rank < 301). + and – signs highlight respectively upregulated and downregulated genes (|logFoldChange| > 0.1 and raw pvalue < 0.05). Underlying table is available here