4.3.1.2 Rat Stress Alone VS Stress Fluoxetine in Dentate Gyrus
This section corresponds to the second meta-analysis requested by El Chérif.
| id | design |
|---|---|
| 1-GSE56028 | GSE56028-FluoxetineVsUntreatedForStressed |
| 2-SRP084288 | SRP084288-FluoxetineVsModelOfDepressionWithTissueAsCovariate |
| 3-SRP131063 | SRP131063-FluoxetineVsSalineForStressed |
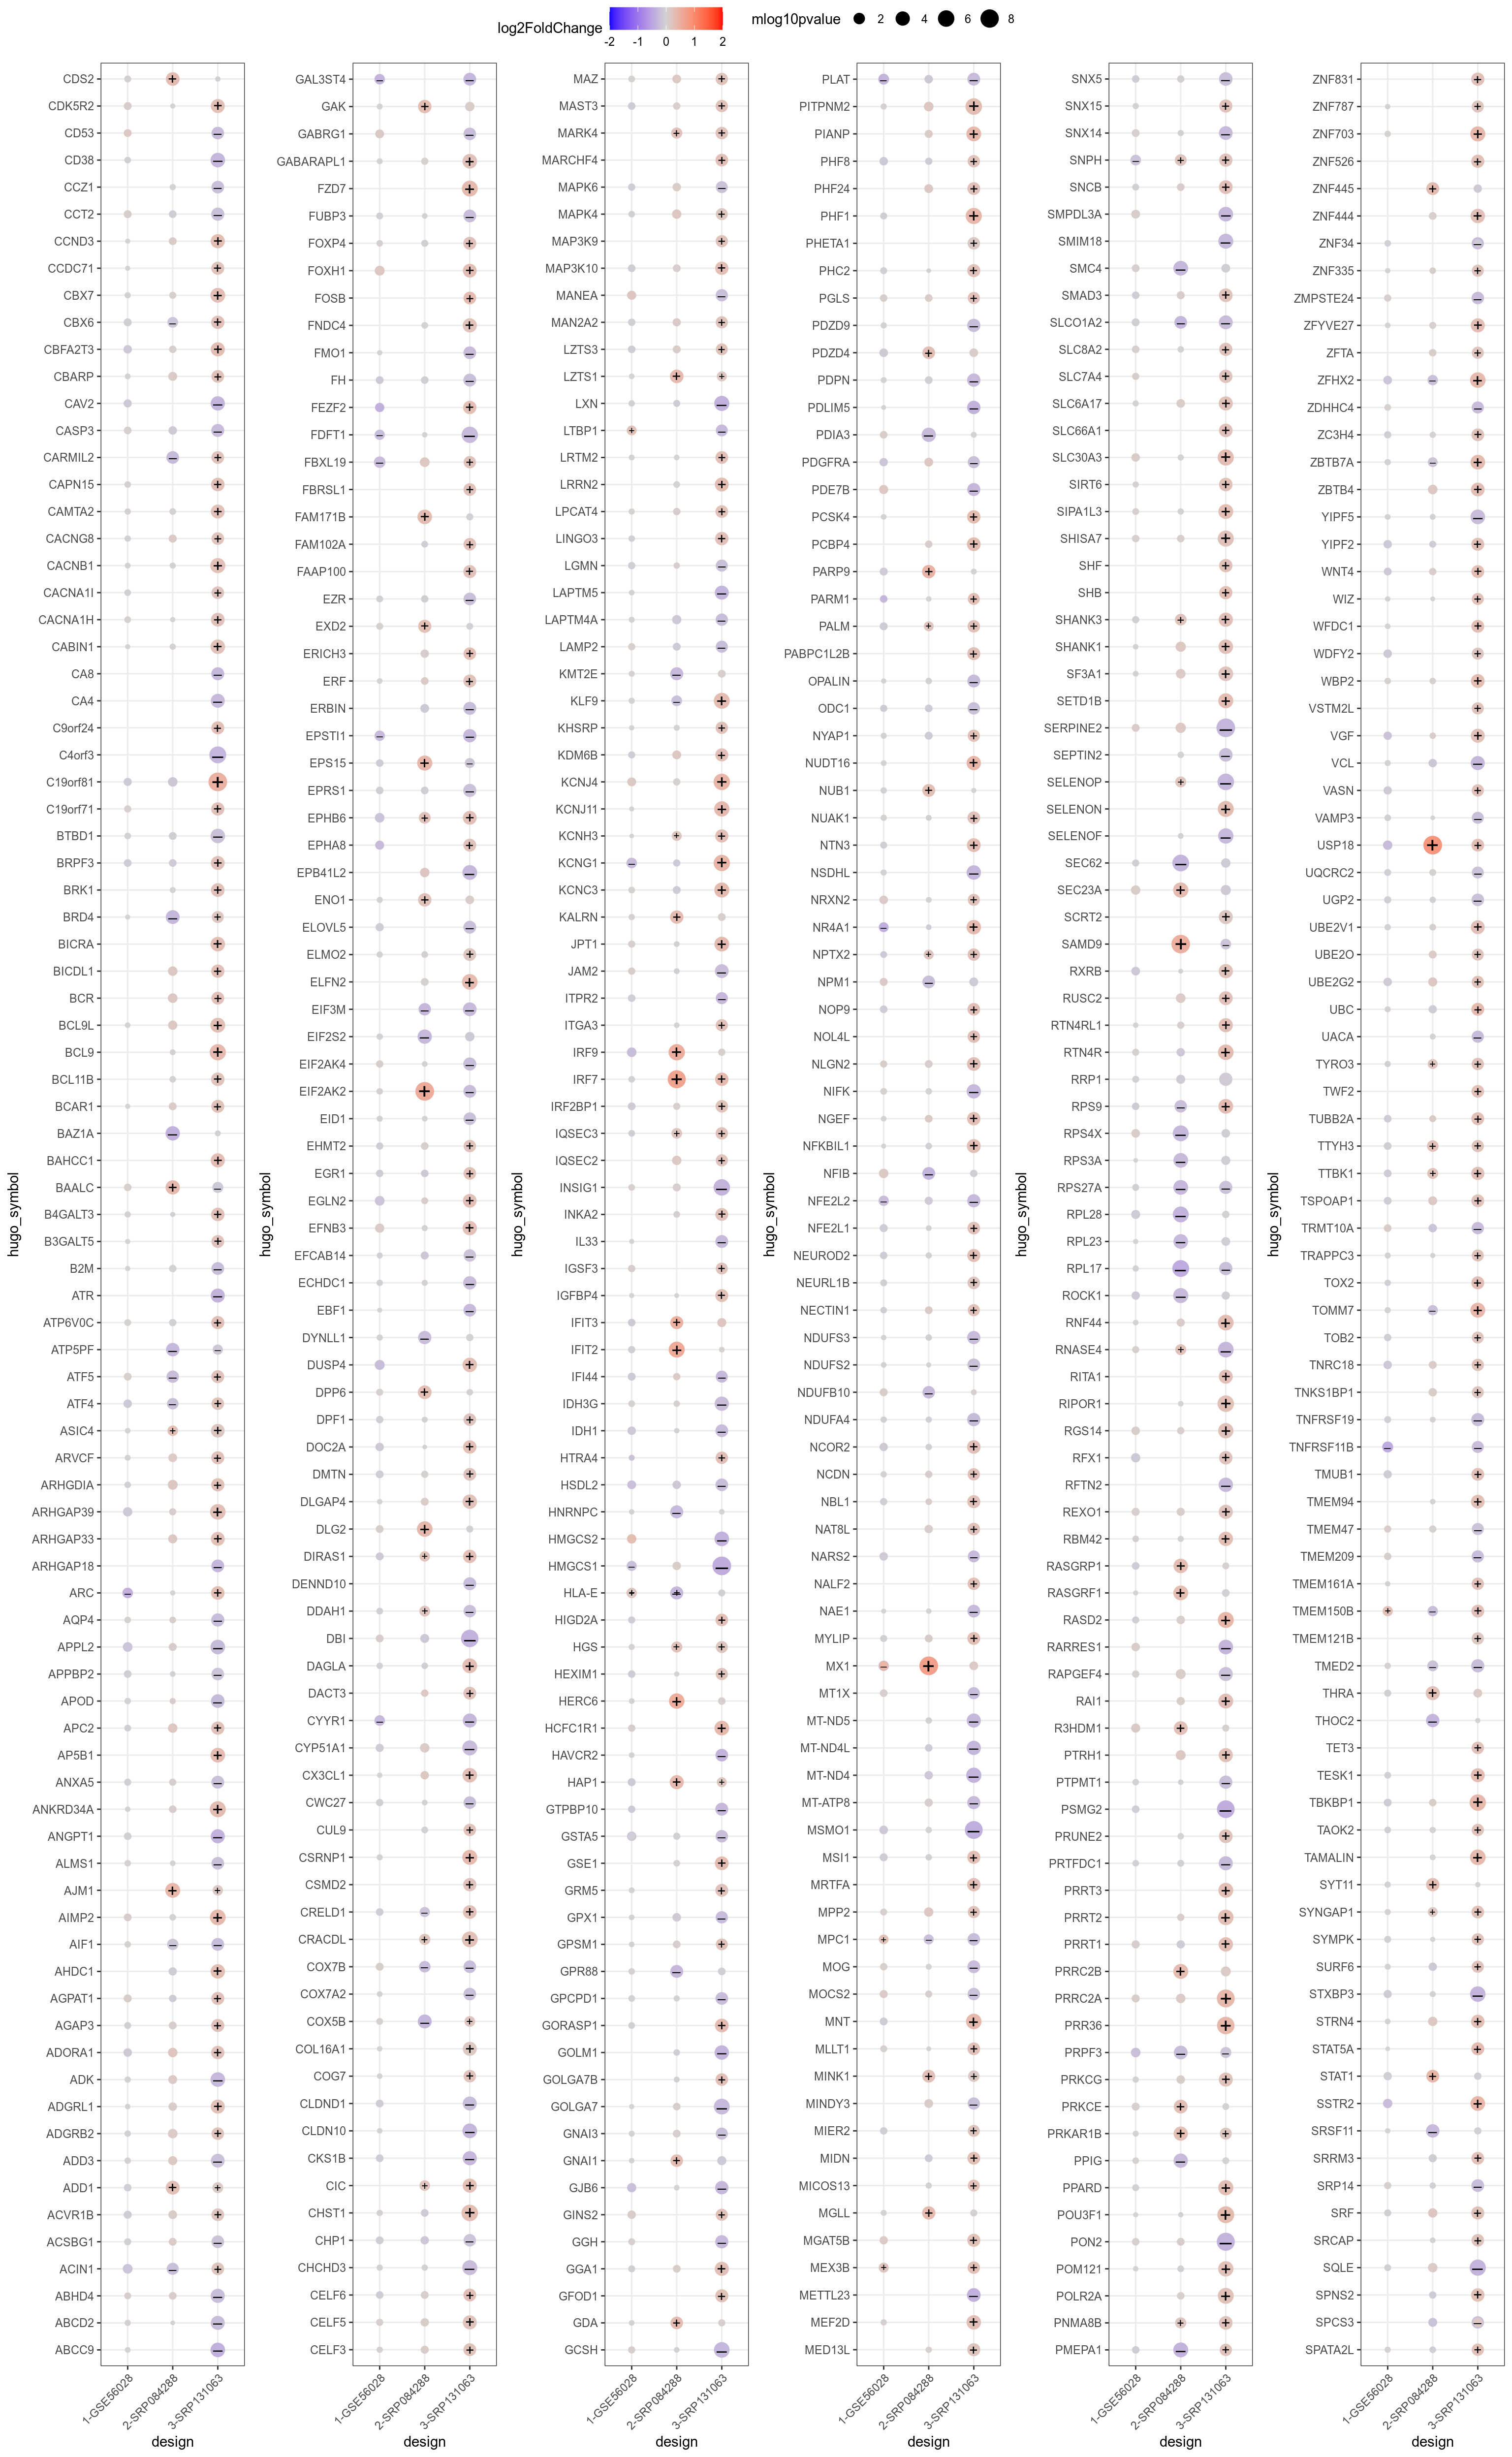
Figure 4.78: Alphabetically-sorted genes significant in at least one comparison (padj < 0.05). + and – signs highlight respectively upregulated and downregulated genes (|logFoldChange| > 0.1 and raw pvalue < 0.05).
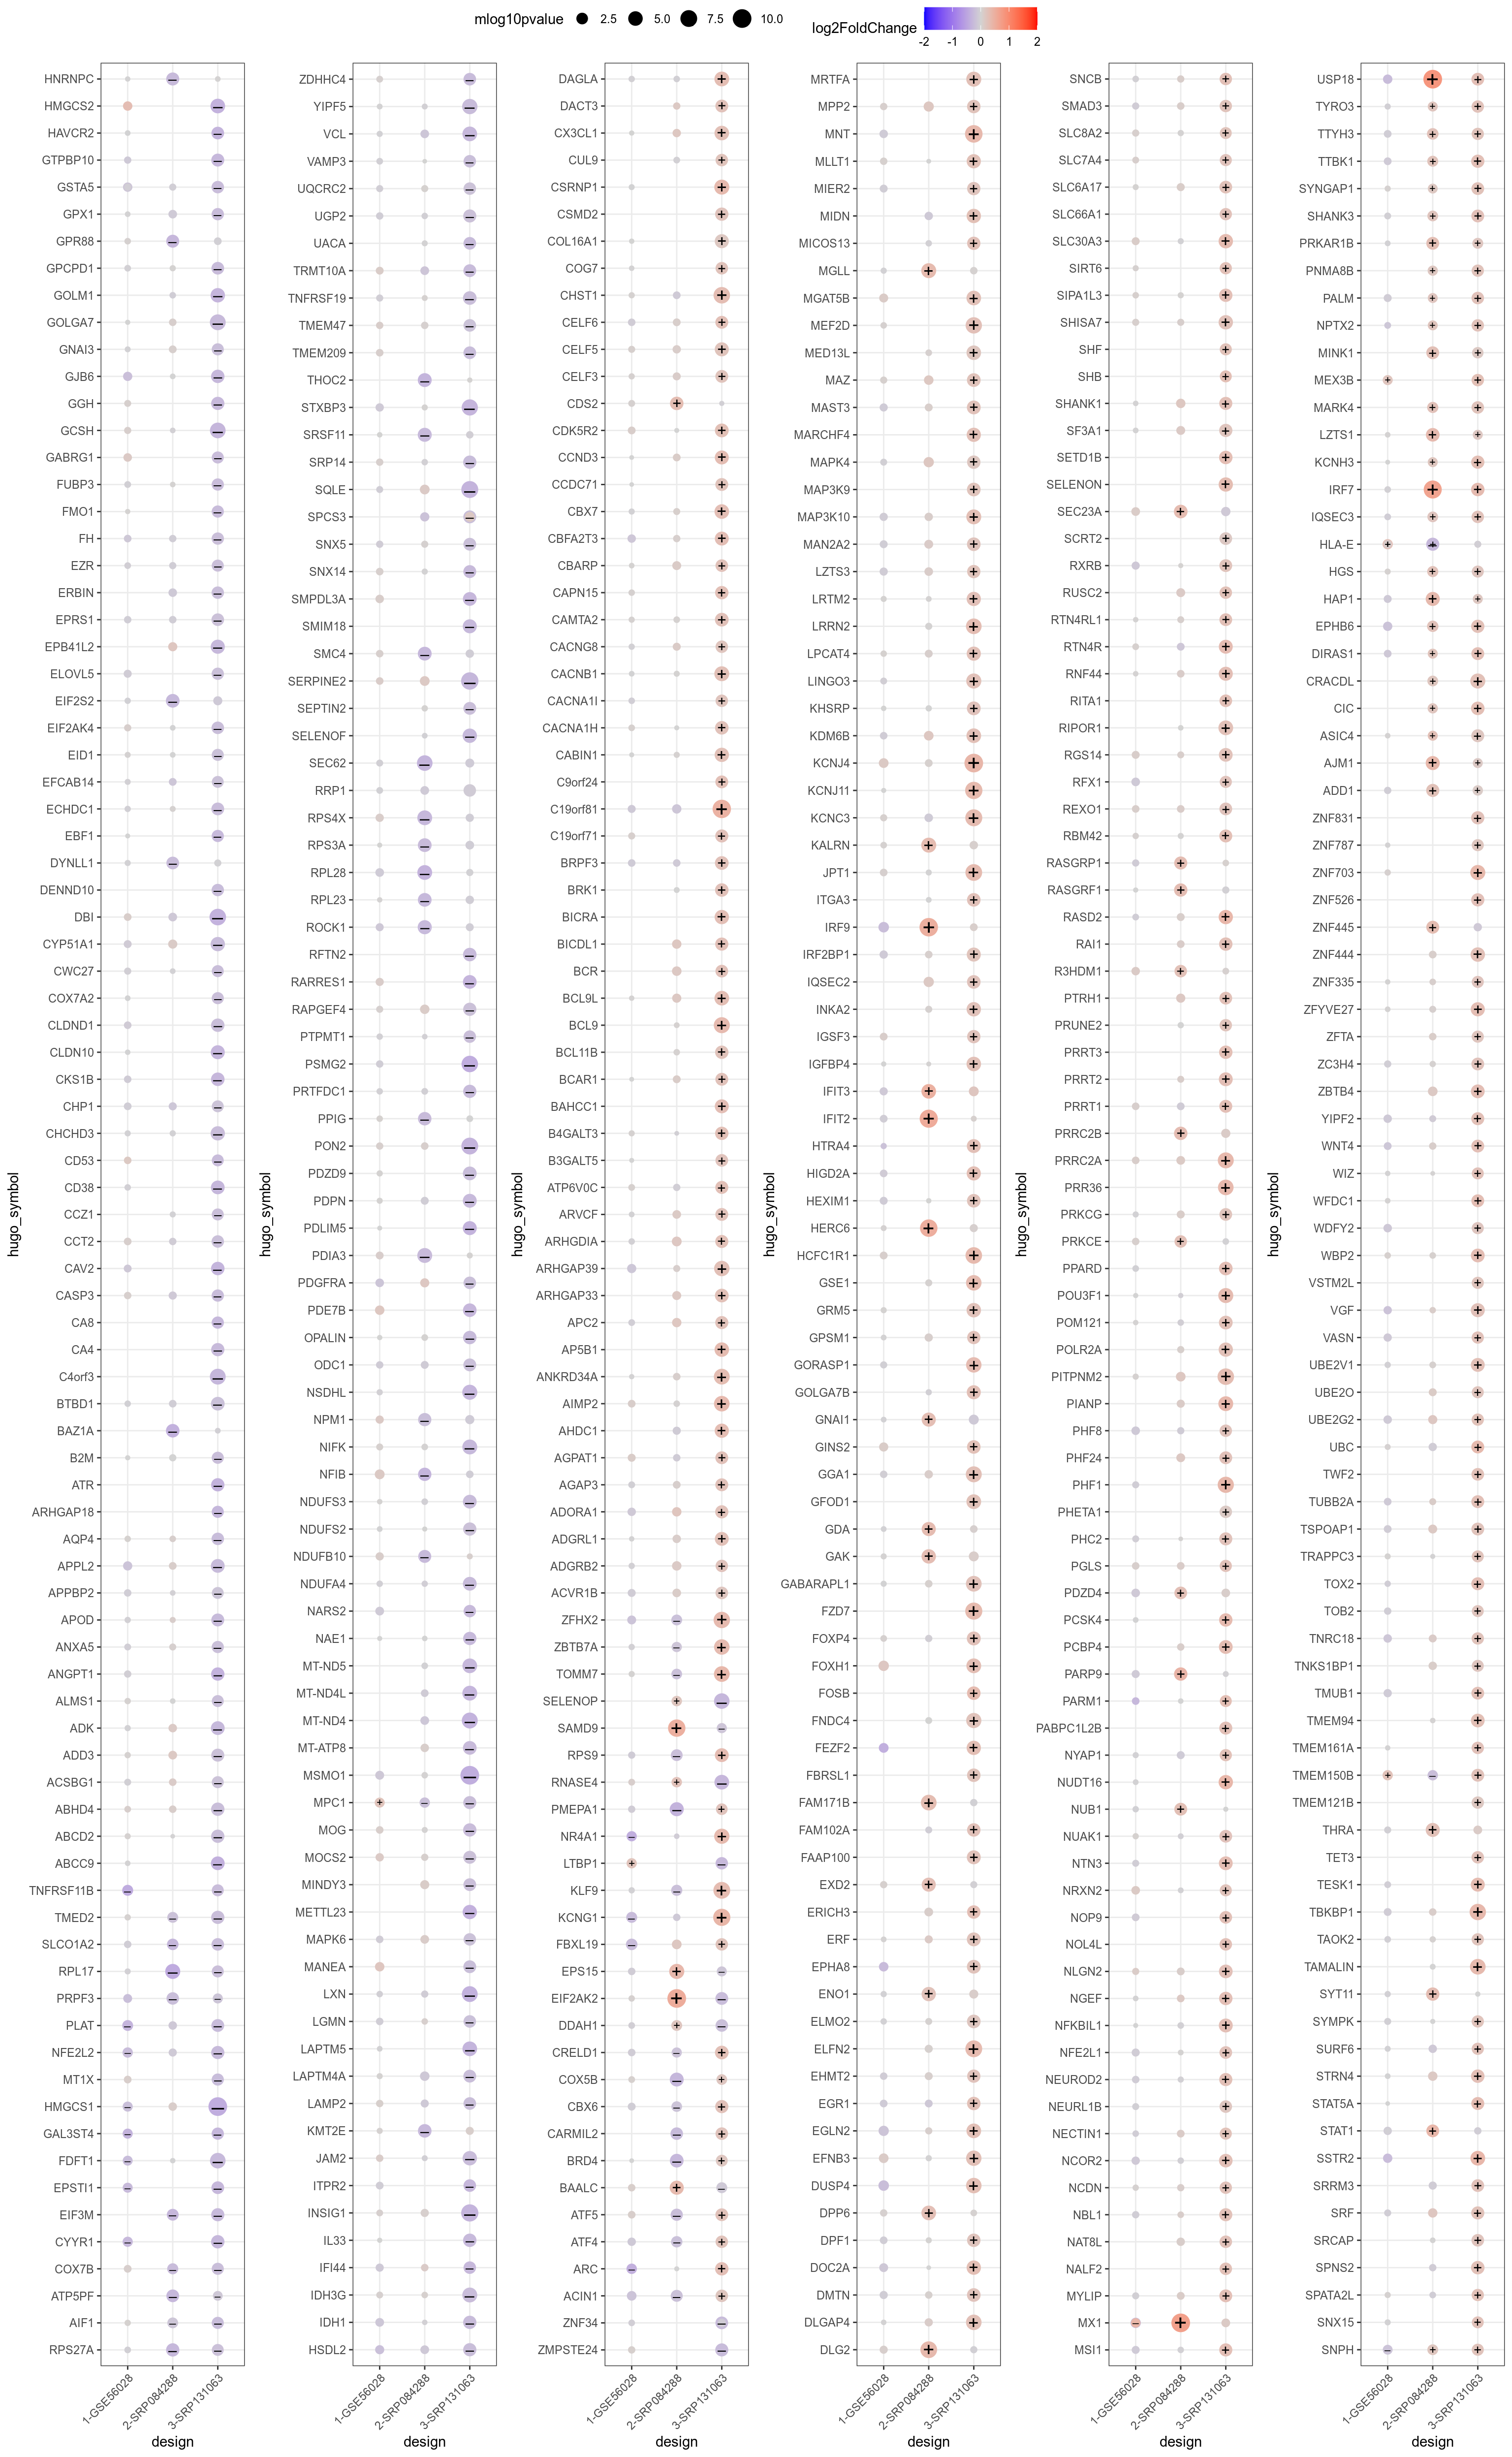
Figure 4.79: Consensus-sorted genes significant in at least one comparison (padj < 0.05). + and – signs highlight respectively upregulated and downregulated genes (|logFoldChange| > 0.1 and raw pvalue < 0.05).
](_main_files/figure-html/resultsIntegrationRatStressAloneVsStressFluoxetineConsensusPadj0p0001-1.png)
Figure 4.80: Consensus-sorted genes significant in at least one comparison (padj < 0.0001). + and – signs highlight respectively upregulated and downregulated genes (|logFoldChange| > 0.1 and raw pvalue < 0.05). Underlying table is available here