4.2.3.2.1.2 Normal shrinkage
## [1] "Intercept"
## [2] "tissue_region_Hippocampus_vs_Frontal.cortex"
## [3] "tissue_region_Pituitary.gland_vs_Frontal.cortex"
## [4] "group_Fluoxetine_vs_Control"
## [5] "group_Acupuncture_vs_Control"
## [6] "group_model.of.depression_vs_Control".](_main_files/figure-html/resultsRnaseqSRP084288FluoxetineVsControlWithTissueAsCovariateNormalKnitPostDeseq2PlotVolcanoDeseq2-1.png)
Figure 4.49: Volcano plot. 13 significant genes according to Pvalue < 0.05 and |log2FoldChange| > 0.5 are highlighted in red and available in this table.
- Enrichr results for all deregulated genes are available here
- Enrichr results for upregulated genes are available here
- Enrichr results for downregulated genes are available here
- g:Profiler results for all deregulated genes are available here
- g:Profiler results for all upregulated genes are available here
- g:Profiler results for all downregulated genes are available here
- g:Profiler results for comparison of the three queries above are available here
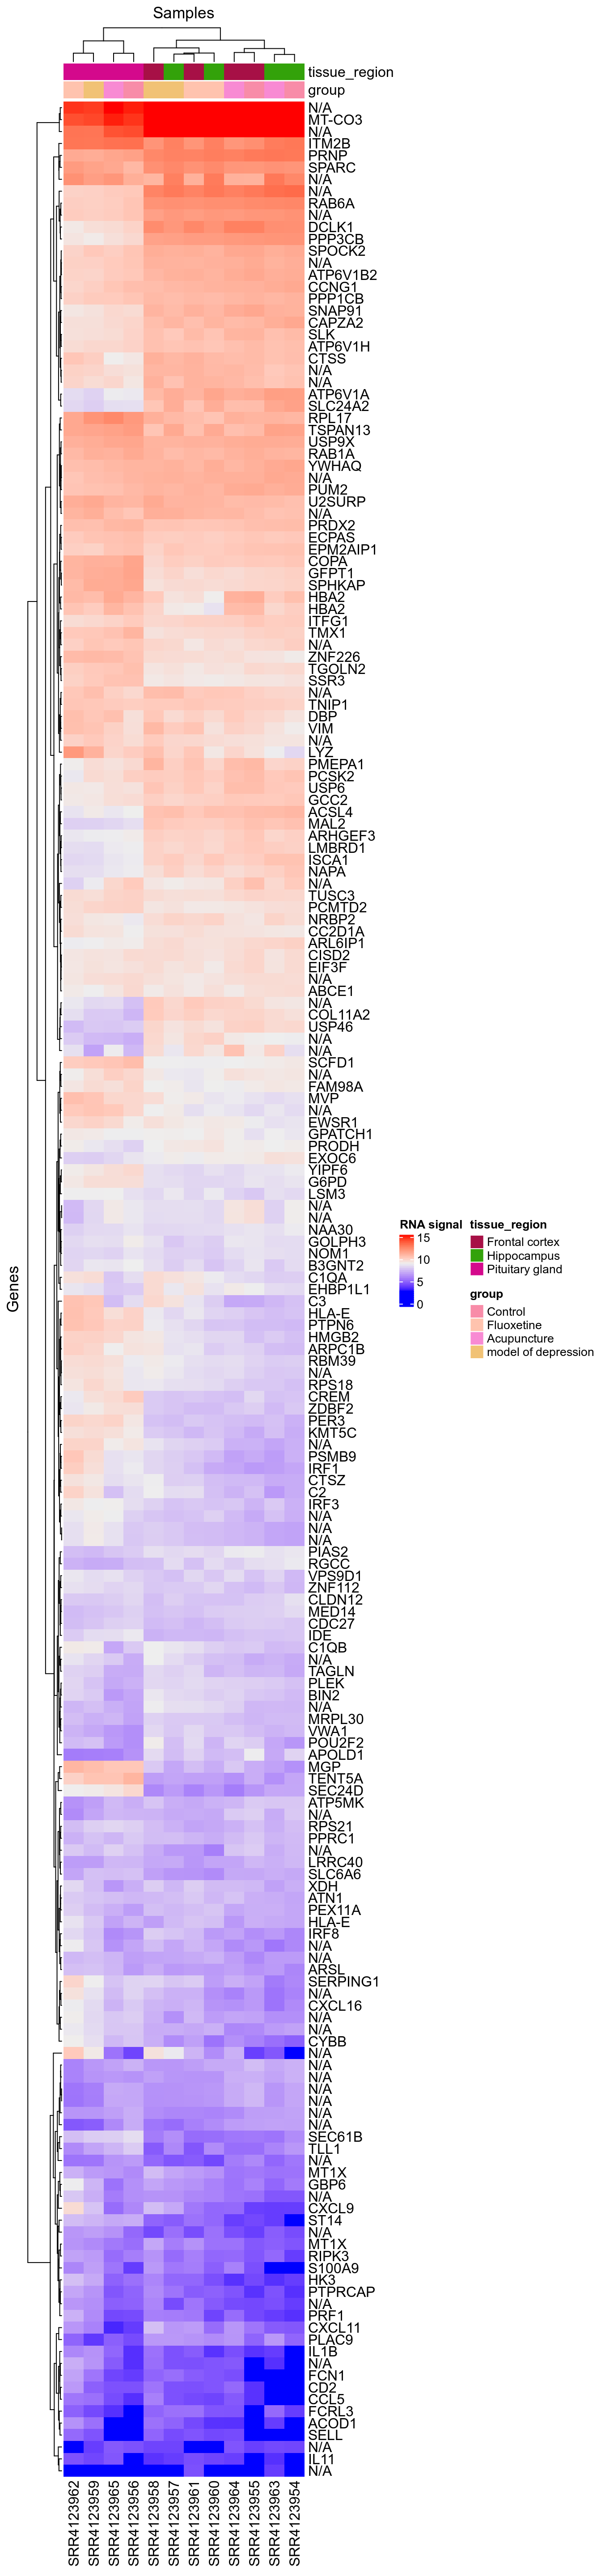
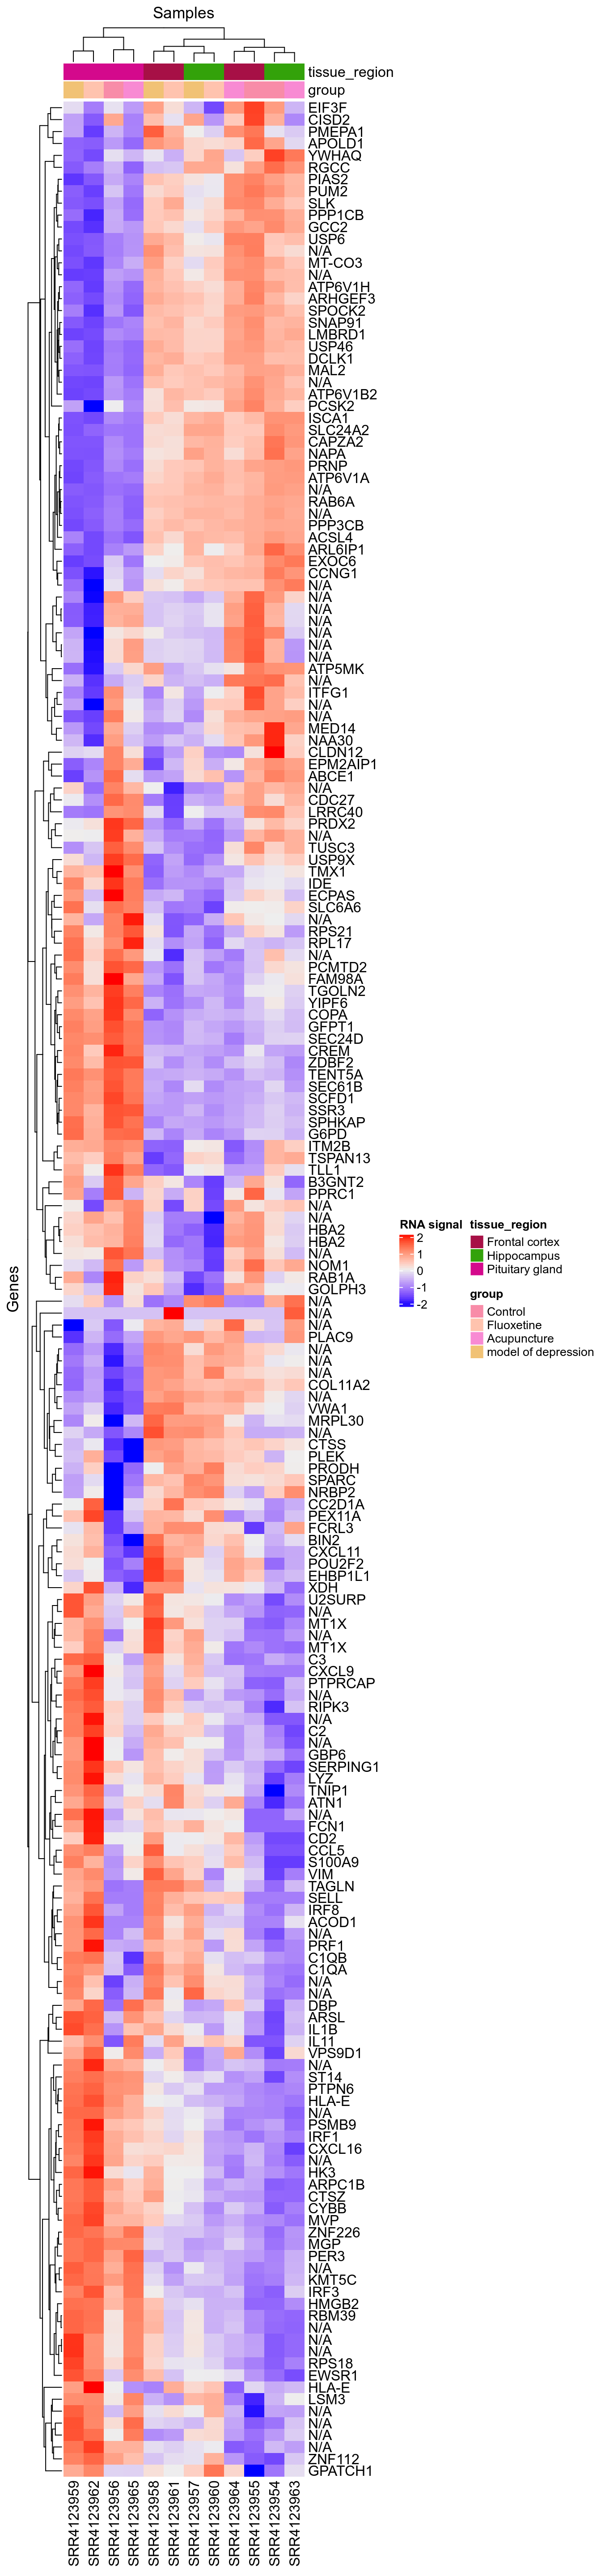
This heatmap was used to check fold change sign is correct for this design: We can see ASAP1 is overexpressed with Fluoxetine, which can be consistently seen on integration dotplots for the design GSE84185-FluoxetineVsControlForNoStressedInDentateGyrus.