4.2.3.4 DTU
4.2.3.4.1 Fluoxetine VS Control
Note that contrary to DEA, it is not possible to use the tissue_region covariate in the differential design. Hence the sample from the three tissue regions are considered as biological replicate in this section.
## Progress: 1 on 100 Progress: 2 on 100 Progress: 3 on 100 Progress: 4 on 100 Progress: 5 on 100 Progress: 6 on 100 Progress: 7 on 100 Progress: 8 on 100 Progress: 9 on 100 Progress: 10 on 100 Progress: 11 on 100 Progress: 12 on 100 Progress: 13 on 100 Progress: 14 on 100 Progress: 15 on 100 Progress: 16 on 100 Progress: 17 on 100 Progress: 18 on 100 Progress: 19 on 100 Progress: 20 on 100 Progress: 21 on 100 Progress: 22 on 100 Progress: 23 on 100 Progress: 24 on 100 Progress: 25 on 100 Progress: 26 on 100 Progress: 27 on 100 Progress: 28 on 100 Progress: 29 on 100 Progress: 30 on 100 Progress: 31 on 100 Progress: 32 on 100 Progress: 33 on 100 Progress: 34 on 100 Progress: 35 on 100 Progress: 36 on 100 Progress: 37 on 100 Progress: 38 on 100 Progress: 39 on 100 Progress: 40 on 100 Progress: 41 on 100 Progress: 42 on 100 Progress: 43 on 100 Progress: 44 on 100 Progress: 45 on 100 Progress: 46 on 100 Progress: 47 on 100 Progress: 48 on 100 Progress: 49 on 100 Progress: 50 on 100 Progress: 51 on 100 Progress: 52 on 100 Progress: 53 on 100 Progress: 54 on 100 Progress: 55 on 100 Progress: 56 on 100 Progress: 57 on 100 Progress: 58 on 100 Progress: 59 on 100 Progress: 60 on 100 Progress: 61 on 100 Progress: 62 on 100 Progress: 63 on 100 Progress: 64 on 100 Progress: 65 on 100 Progress: 66 on 100 Progress: 67 on 100 Progress: 68 on 100 Progress: 69 on 100 Progress: 70 on 100 Progress: 71 on 100 Progress: 72 on 100 Progress: 73 on 100 Progress: 74 on 100 Progress: 75 on 100 Progress: 76 on 100 Progress: 77 on 100 Progress: 78 on 100 Progress: 79 on 100 Progress: 80 on 100 Progress: 81 on 100 Progress: 82 on 100 Progress: 83 on 100 Progress: 84 on 100 Progress: 85 on 100 Progress: 86 on 100 Progress: 87 on 100 Progress: 88 on 100 Progress: 89 on 100 Progress: 90 on 100 Progress: 91 on 100 Progress: 92 on 100 Progress: 93 on 100 Progress: 94 on 100 Progress: 95 on 100 Progress: 96 on 100 Progress: 97 on 100 Progress: 98 on 100 Progress: 99 on 100 Progress: 100 on 100##
## FALSE
## 6070## DataFrame with 6 rows and 2 columns
## log2FC qvalue
## <numeric> <numeric>
## ENSRNOT00000082627 -0.1225261 0.465
## ENSRNOT00000016083 0.1212046 0.465
## ENSRNOT00000091574 0.0452601 0.465
## ENSRNOT00000041891 -0.0391653 0.465
## ENSRNOT00000063787 -0.0313036 0.698
## ENSRNOT00000012022 0.0509958 0.790
##        sign.lfc
## sig       -1    0    1
##   FALSE 3022   14 3034
Figure 4.52: Top upregulated isoforms
Figure 4.53: Top downregulated isoforms
The complete table for all transcripts passing the labelKeep default filter is available here.
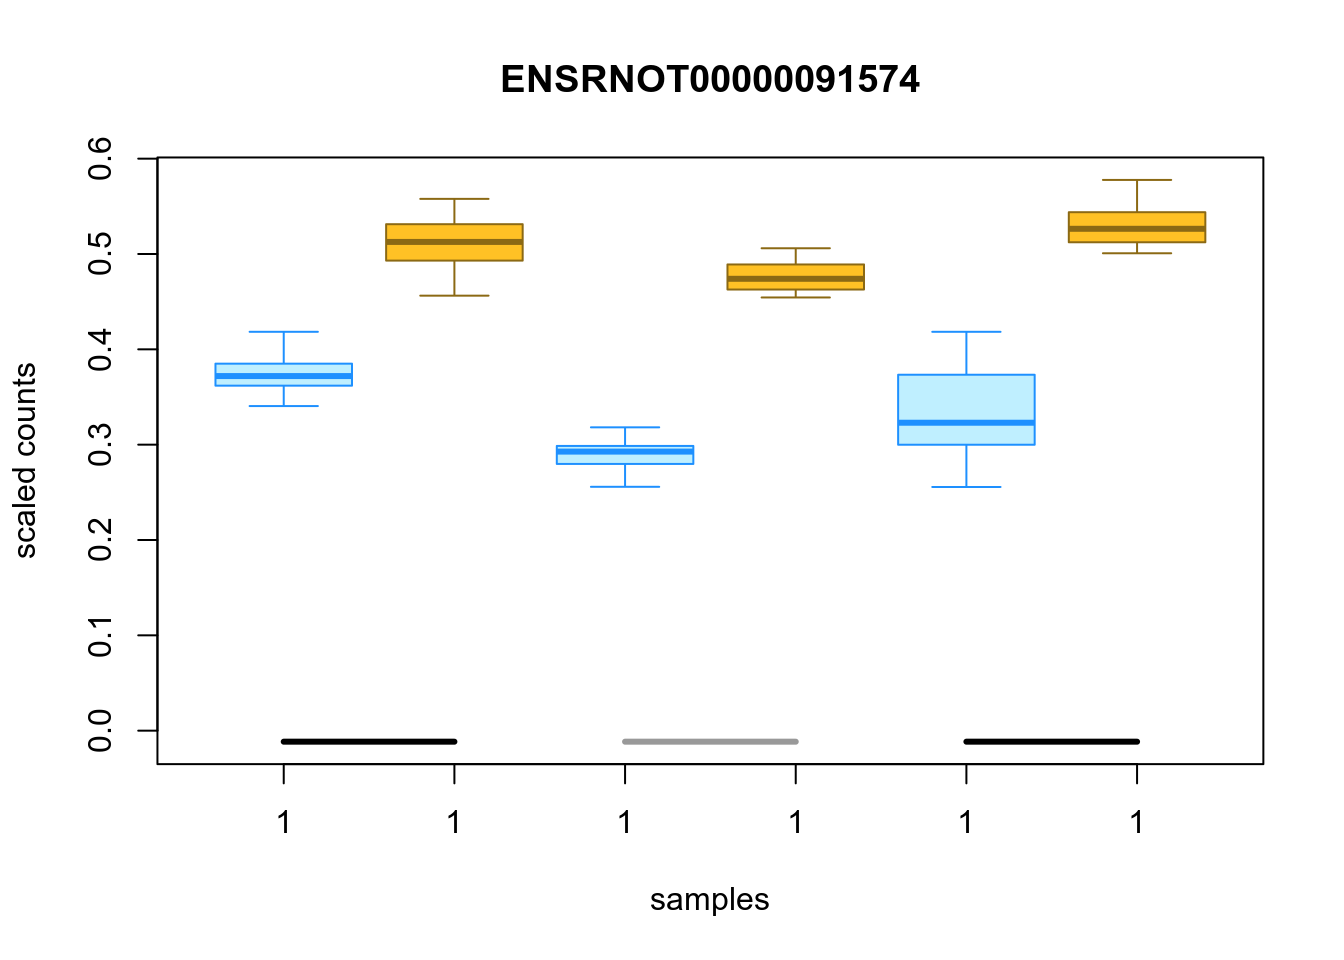
Figure 4.54: Distribution of inferential replicates for the top upregulated isoform, for each sample, splitted by condition
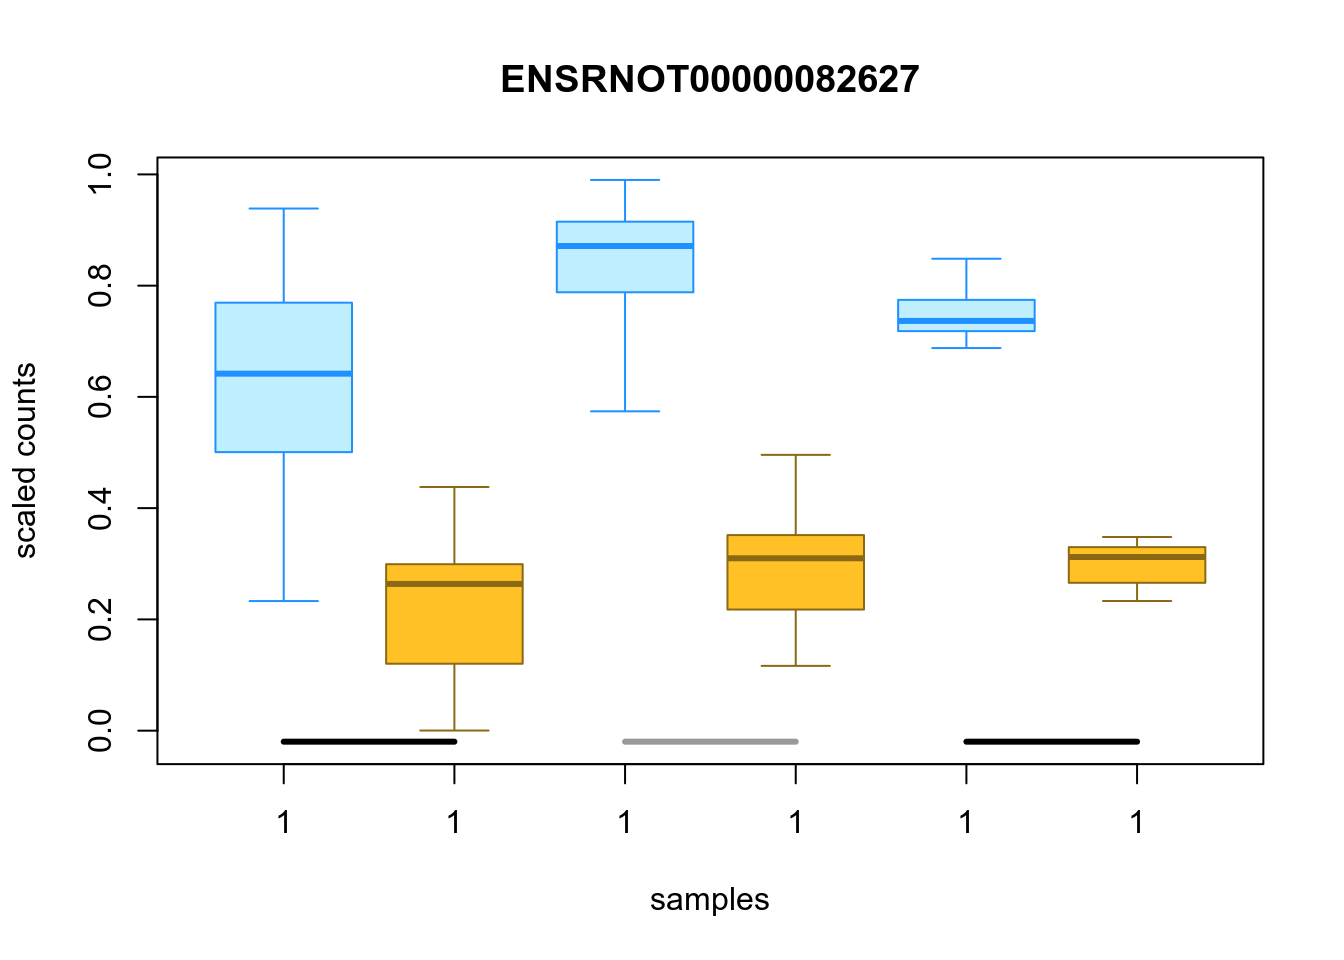
Figure 4.55: Distribution of inferential replicates for the top downregulated isoform, for each sample, splitted by condition
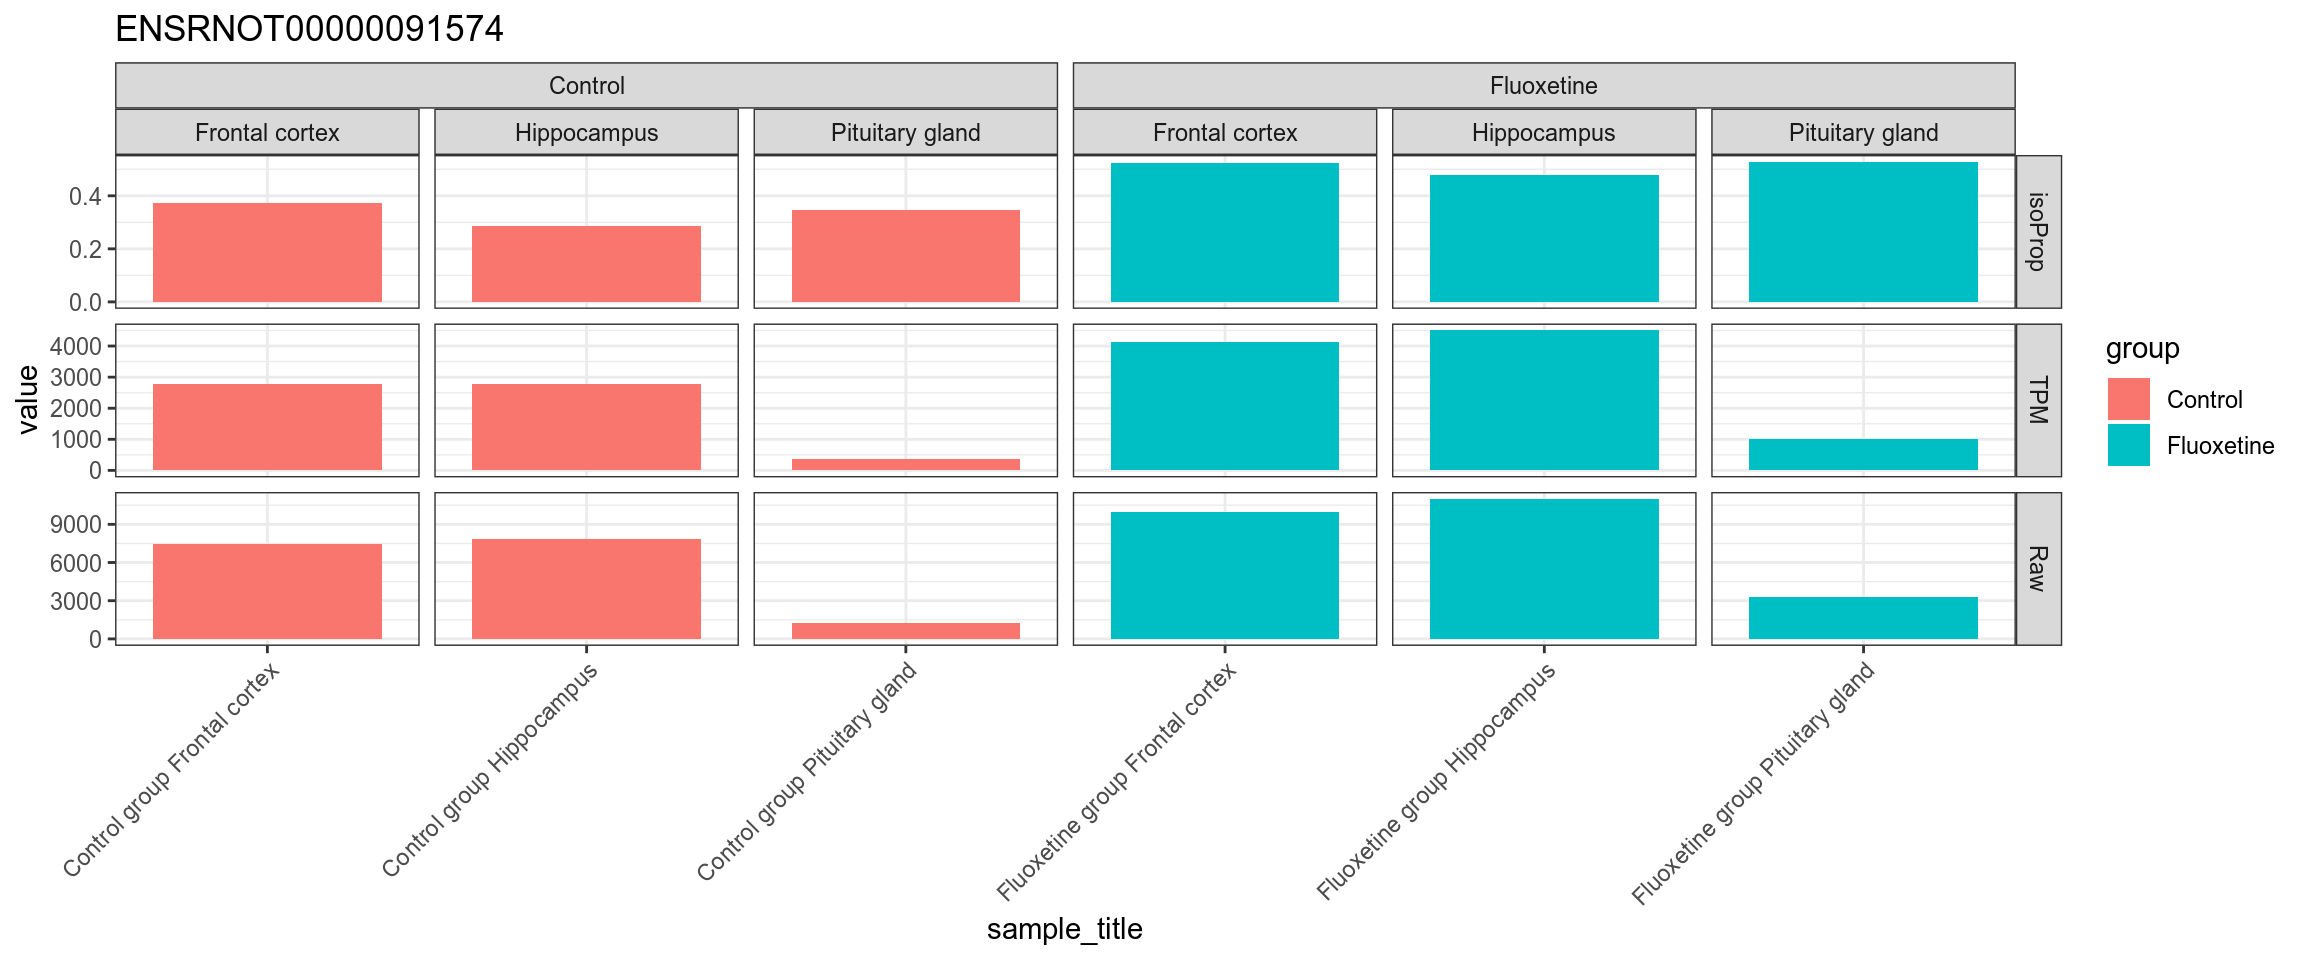
Figure 4.56: TPM, isoform proportion and raw counts for the top upregulated isoform, for each sample, splitted by condition
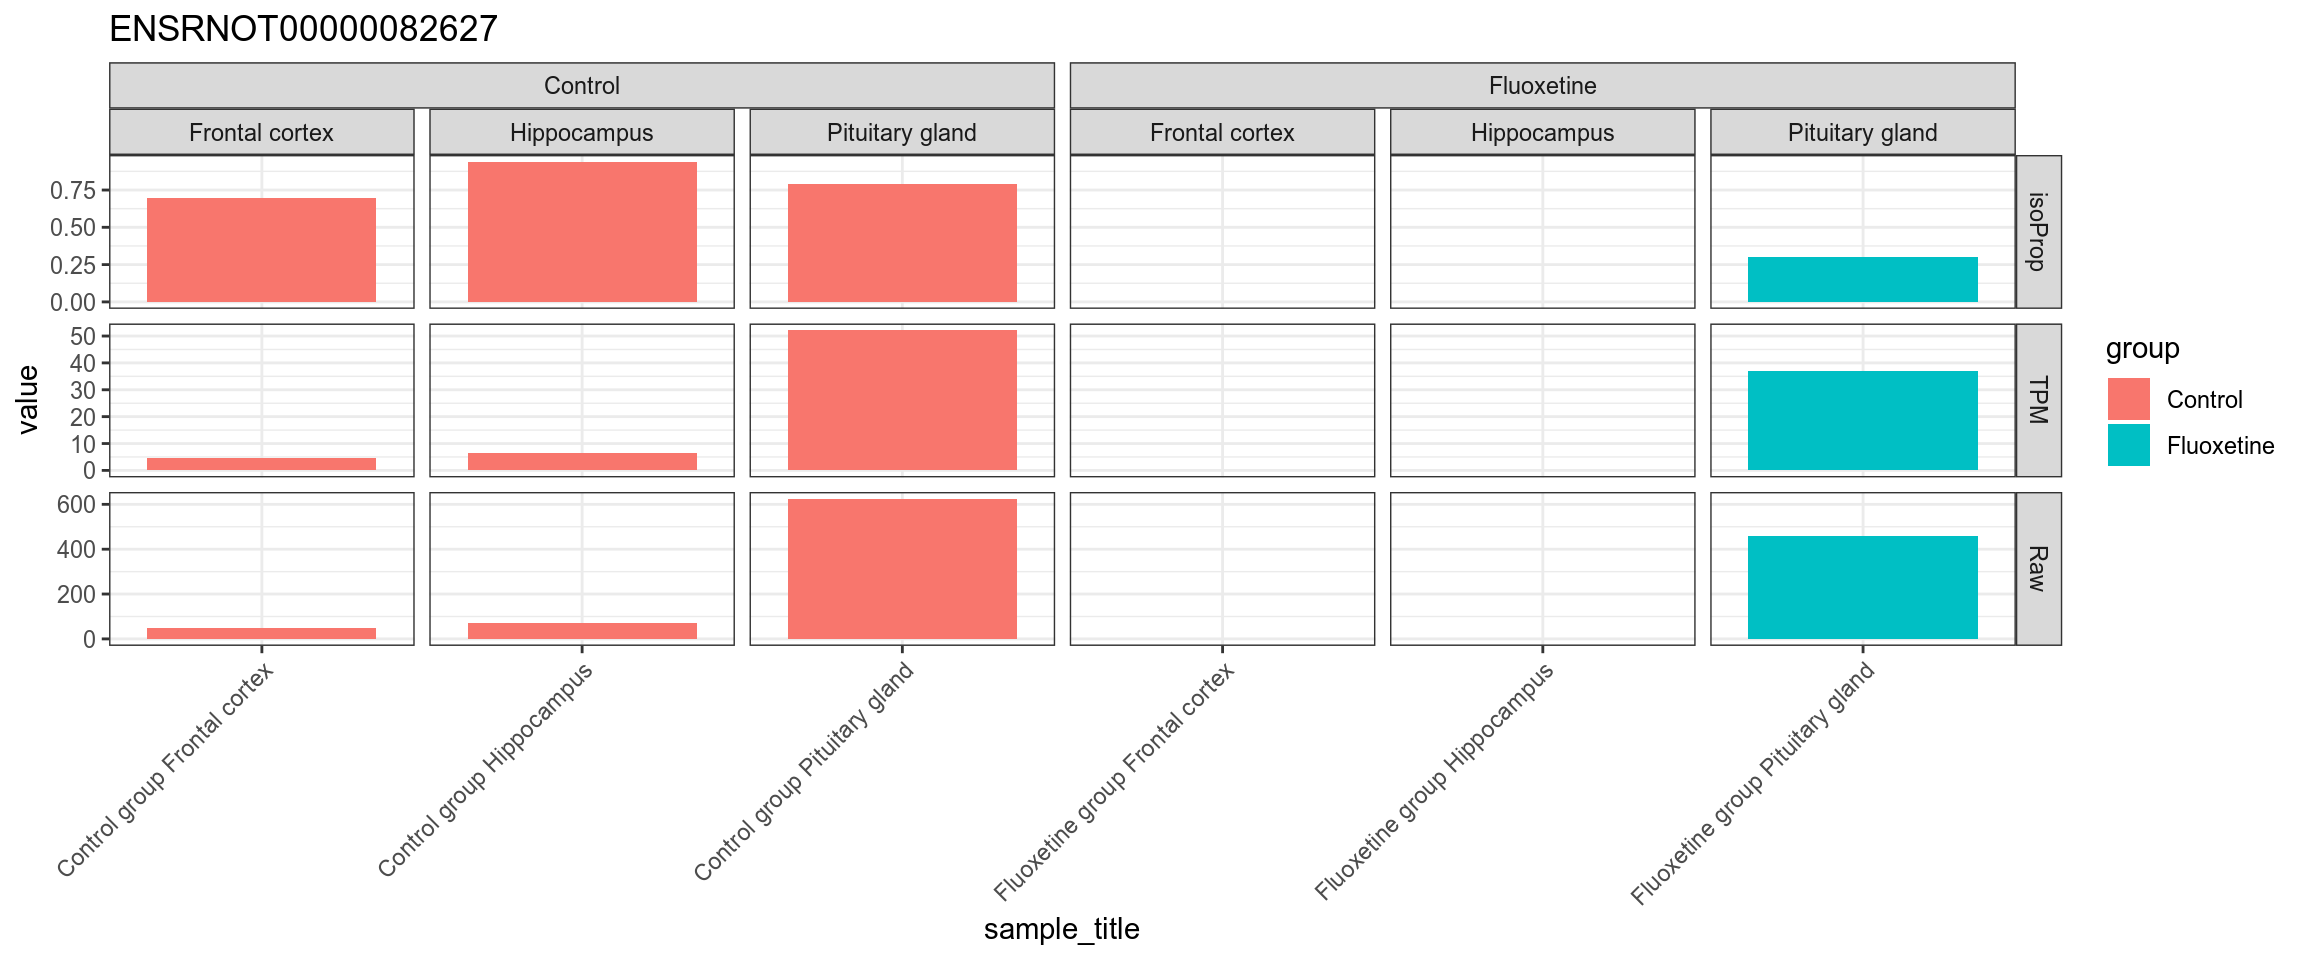
Figure 4.57: TPM, isoform proportion and raw counts for the top downregulated isoform, for each sample, splitted by condition
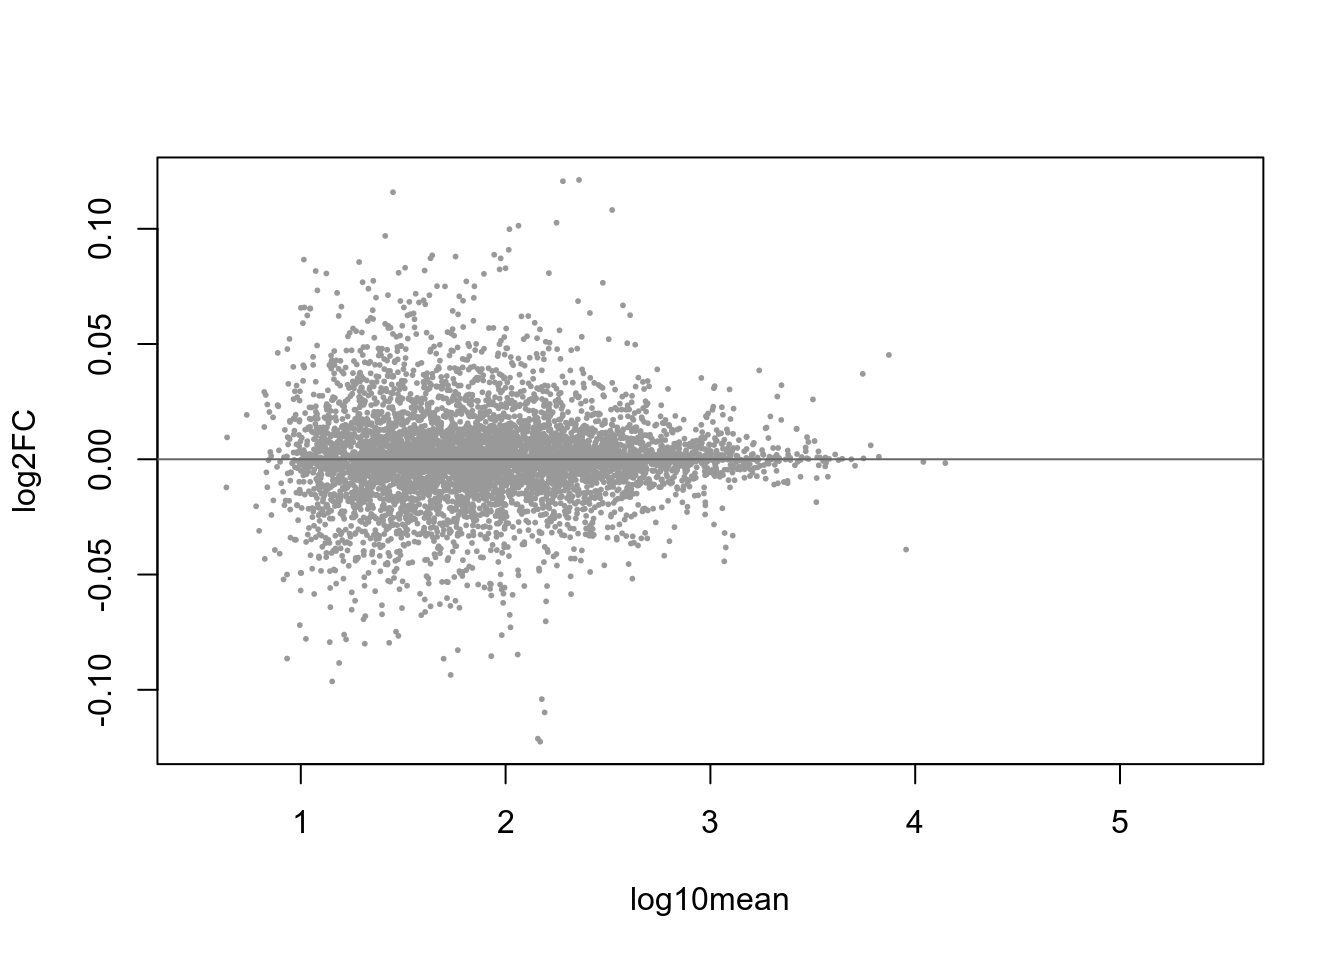
Figure 4.58: MA-plot with blue-highlighted genes corresponding to those with qvalue < 0.1