4.3.1.6 Rat+Mouse Fluoxetine VS Control for NoStressed in Dentate Gyrus
| id | design |
|---|---|
| 1-GSE118669 | GSE118669-FluoxetineVsVehicle |
| 2-GSE42940 | GSE42940-FluoxetineVsControl |
| 3-GSE54307 | GSE54307-FluoxetineVsVehicle |
| 4-GSE6476 | GSE6476-FluoxetineVsControl |
| 5-GSE84185 | GSE84185-FluoxetineVsControlForNoStressedInDentateGyrus |
| 6-SRP056481 | SRP056481-FluoxetineVsMethylcellulose |
| 7-SRP057486 | SRP057486-FluoxetineVsVehicleForBrainCA1NonShocked |
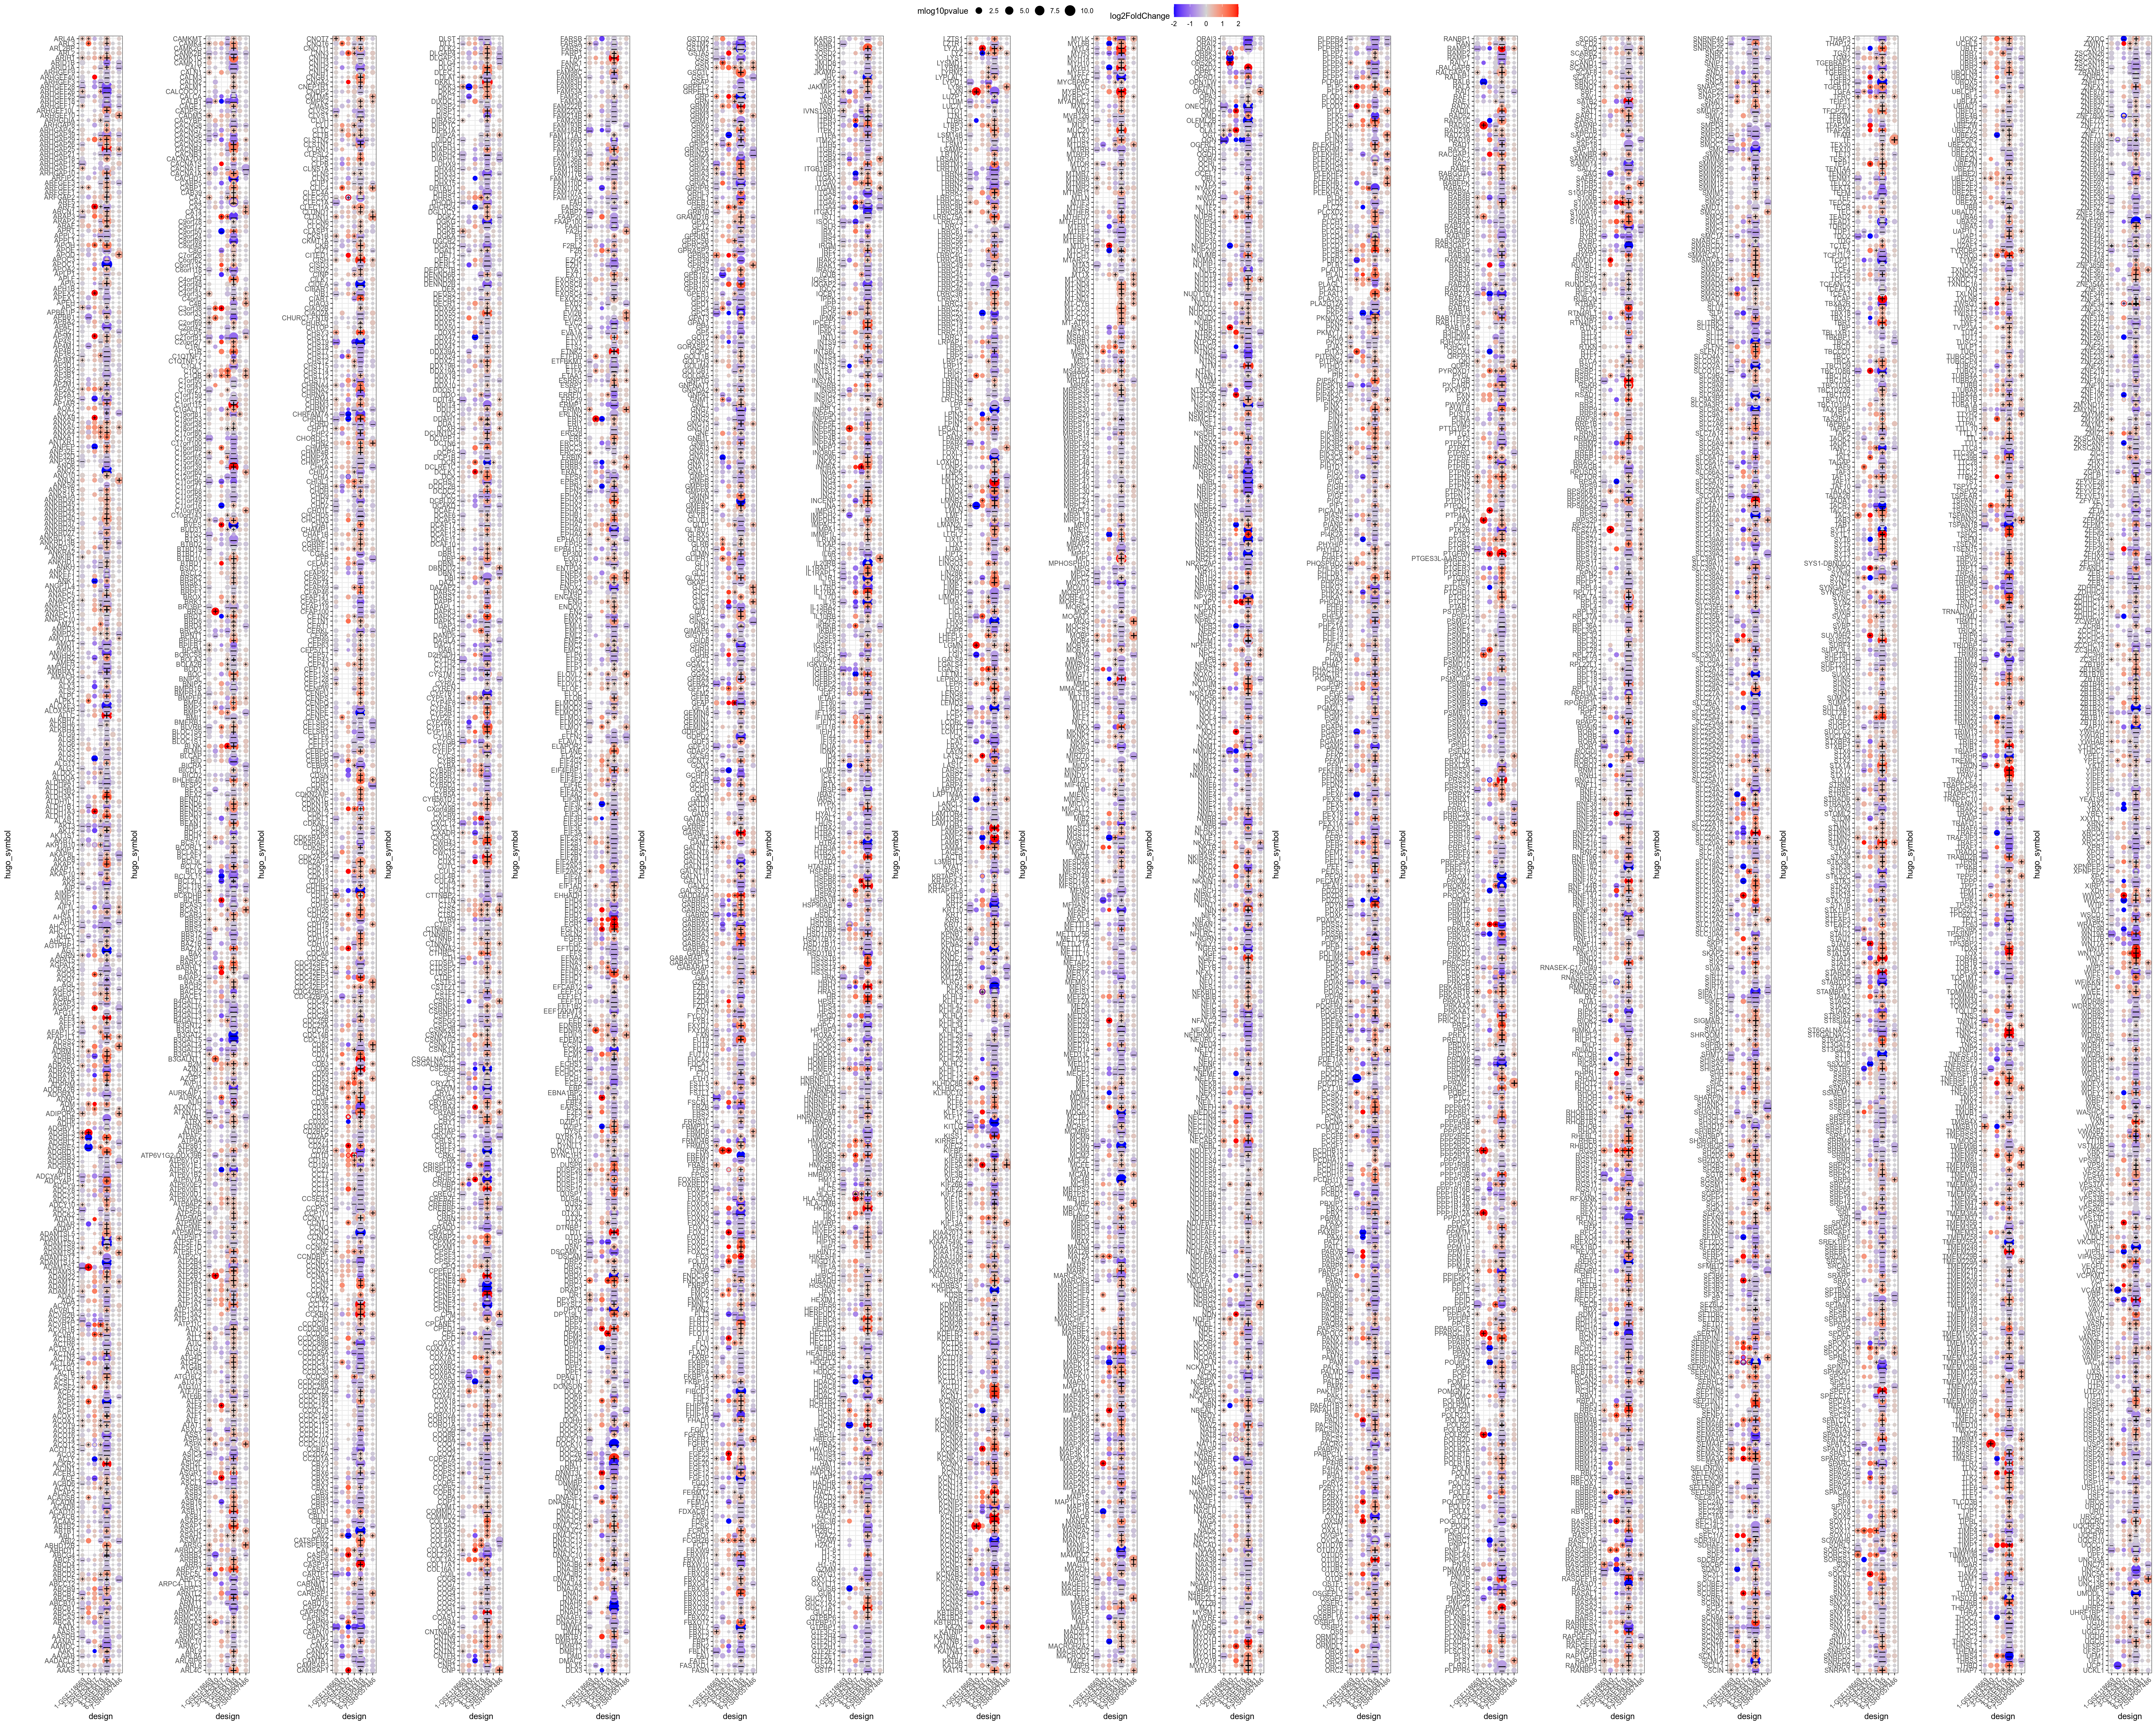
Figure 4.90: Alphabetically-sorted genes significant in at least one comparison (padj < 0.05). + and – signs highlight respectively upregulated and downregulated genes (|logFoldChange| > 0.1 and raw pvalue < 0.05).
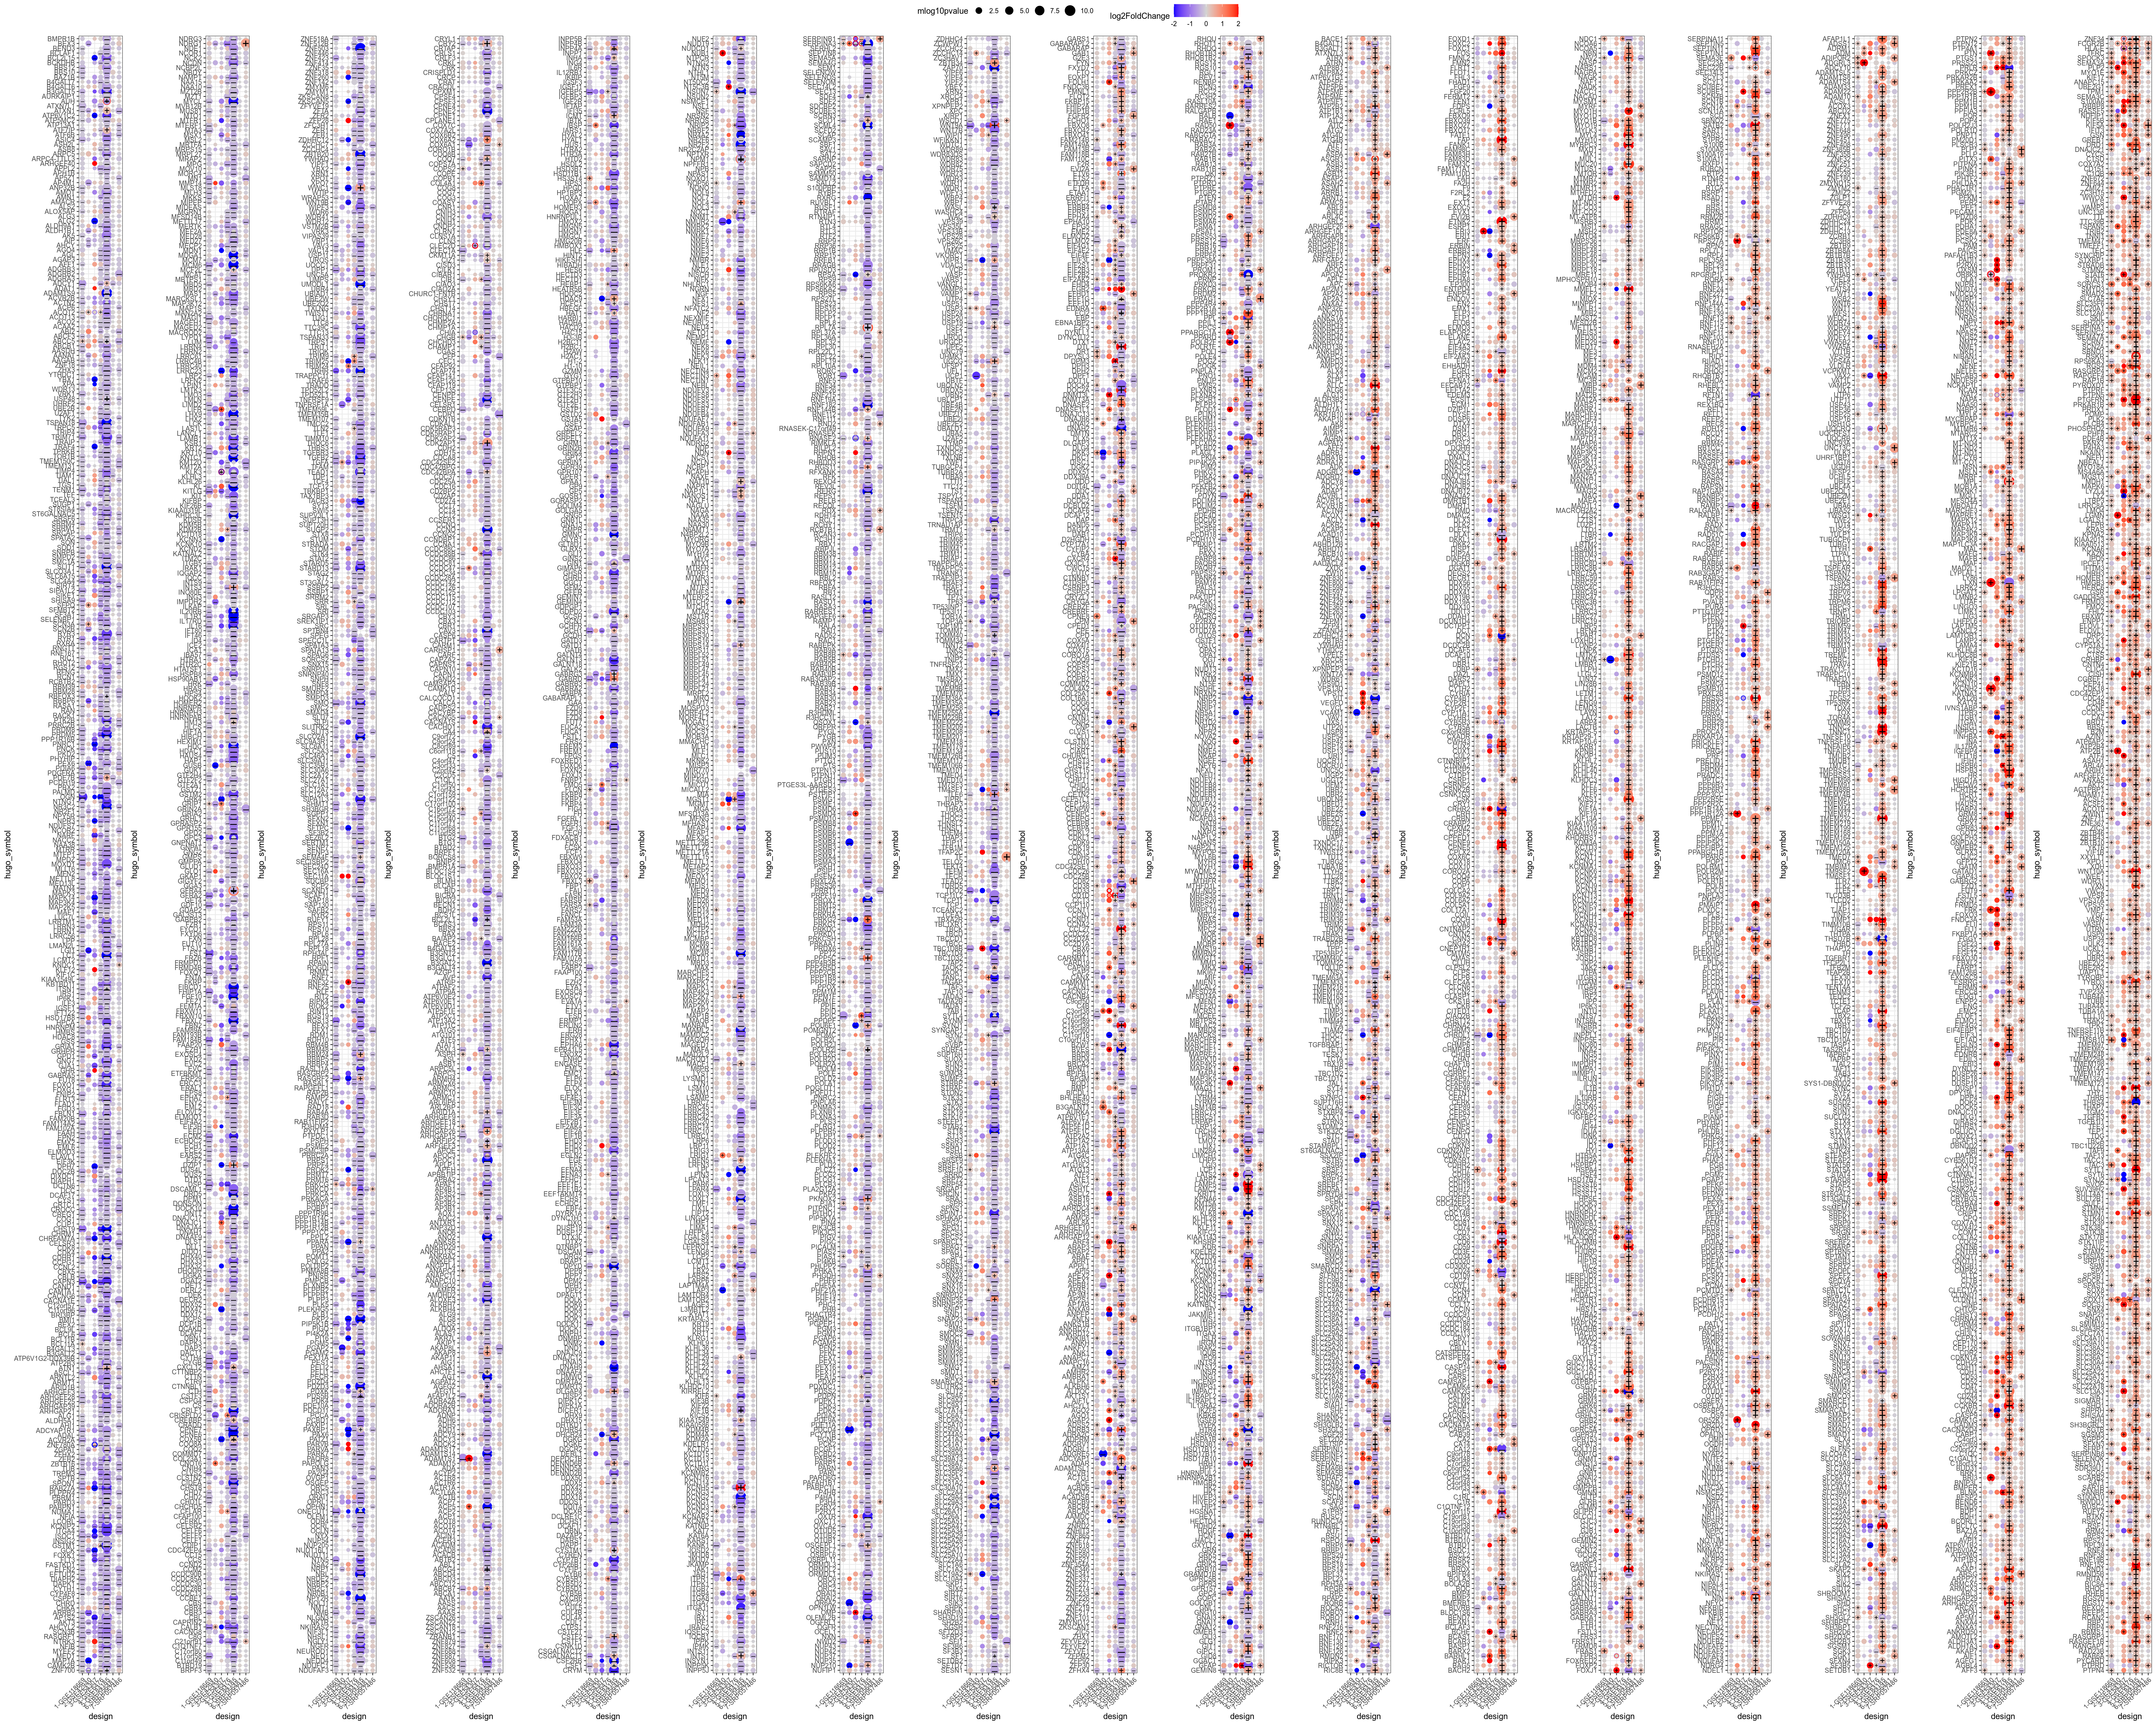
Figure 4.91: Consensus-sorted genes significant in at least one comparison (padj < 0.05). + and – signs highlight respectively upregulated and downregulated genes (|logFoldChange| > 0.1 and raw pvalue < 0.05).
](_main_files/figure-html/resultsIntegrationRatMouseFluoxetineVsControlForNoStressedConsensusPadj0p0001-1.png)
Figure 4.92: Consensus-sorted genes significant in at least one comparison (padj < 0.0001). + and – signs highlight respectively upregulated and downregulated genes (|logFoldChange| > 0.1 and raw pvalue < 0.05). Underlying table is available here