4.2.1.3 DTU
4.2.1.3.1 Fluoxetine VS Methylcellulose
## Progress: 1 on 24 Progress: 2 on 24 Progress: 3 on 24 Progress: 4 on 24 Progress: 5 on 24 Progress: 6 on 24 Progress: 7 on 24 Progress: 8 on 24 Progress: 9 on 24 Progress: 10 on 24 Progress: 11 on 24 Progress: 12 on 24 Progress: 13 on 24 Progress: 14 on 24 Progress: 15 on 24 Progress: 16 on 24 Progress: 17 on 24 Progress: 18 on 24 Progress: 19 on 24 Progress: 20 on 24 Progress: 21 on 24 Progress: 22 on 24 Progress: 23 on 24 Progress: 24 on 24##
## FALSE TRUE
## 6845 13## DataFrame with 6 rows and 2 columns
## log2FC qvalue
## <numeric> <numeric>
## ENSRNOT00000080683 -0.1029960 0.00320513
## ENSRNOT00000085263 -0.0992650 0.00320513
## ENSRNOT00000018237 -0.0867117 0.00320513
## ENSRNOT00000084120 -0.0857084 0.00320513
## ENSRNOT00000015453 -0.0765245 0.00320513
## ENSRNOT00000008886 0.0660385 0.00320513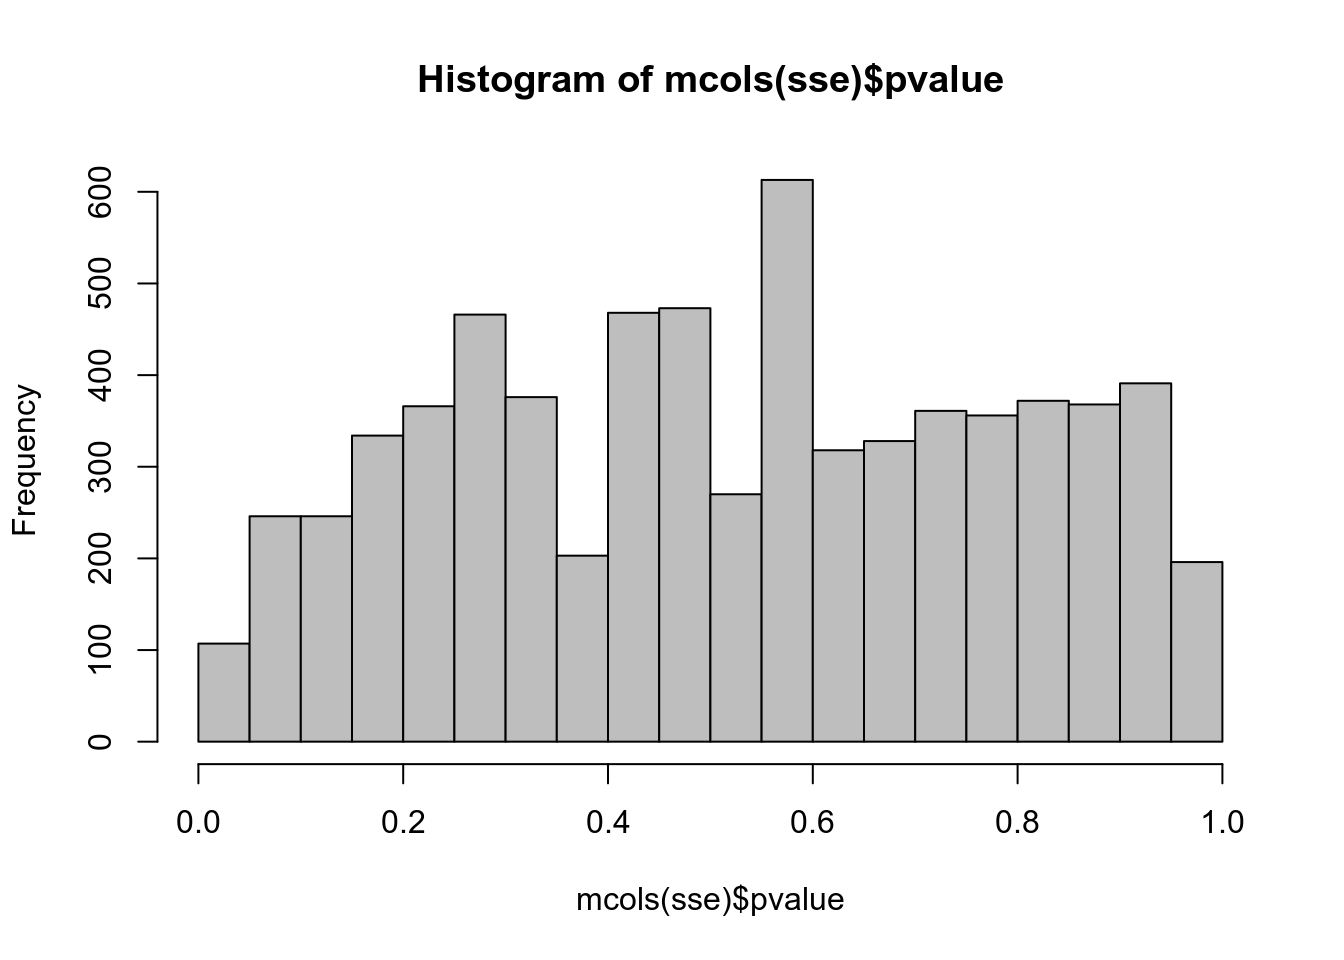
##        sign.lfc
## sig       -1    0    1
##   FALSE 3432    7 3406
##   TRUE     7    0    6
Figure 4.5: Top upregulated isoforms
Figure 4.6: Top downregulated isoforms
The complete table for all transcripts passing the labelKeep default filter is available here.
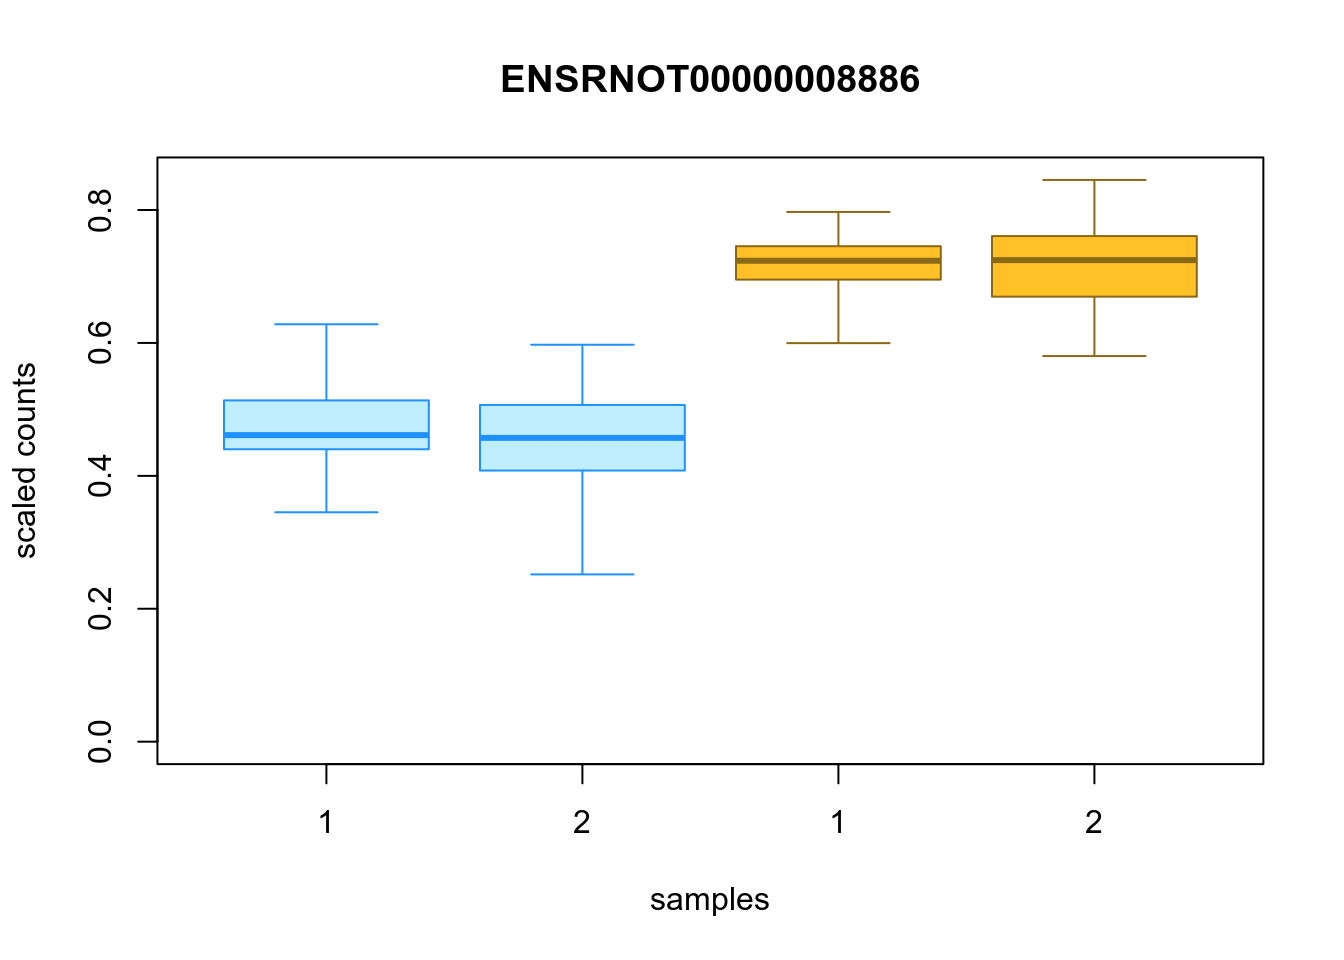
Figure 4.7: Distribution of inferential replicates for the top upregulated isoform, for each sample, splitted by condition
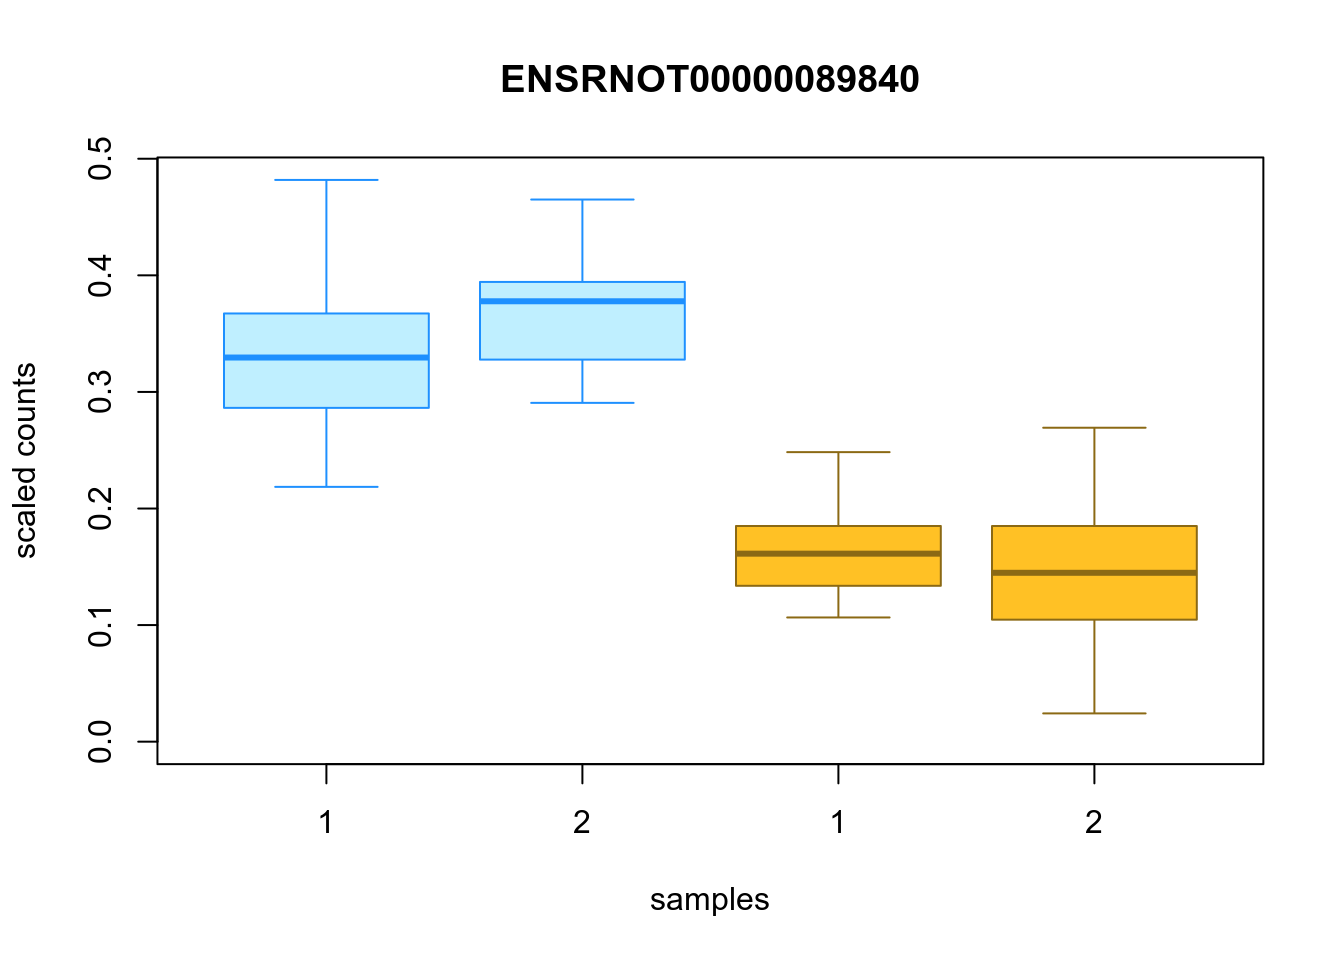
Figure 4.8: Distribution of inferential replicates for the top downregulated isoform, for each sample, splitted by condition
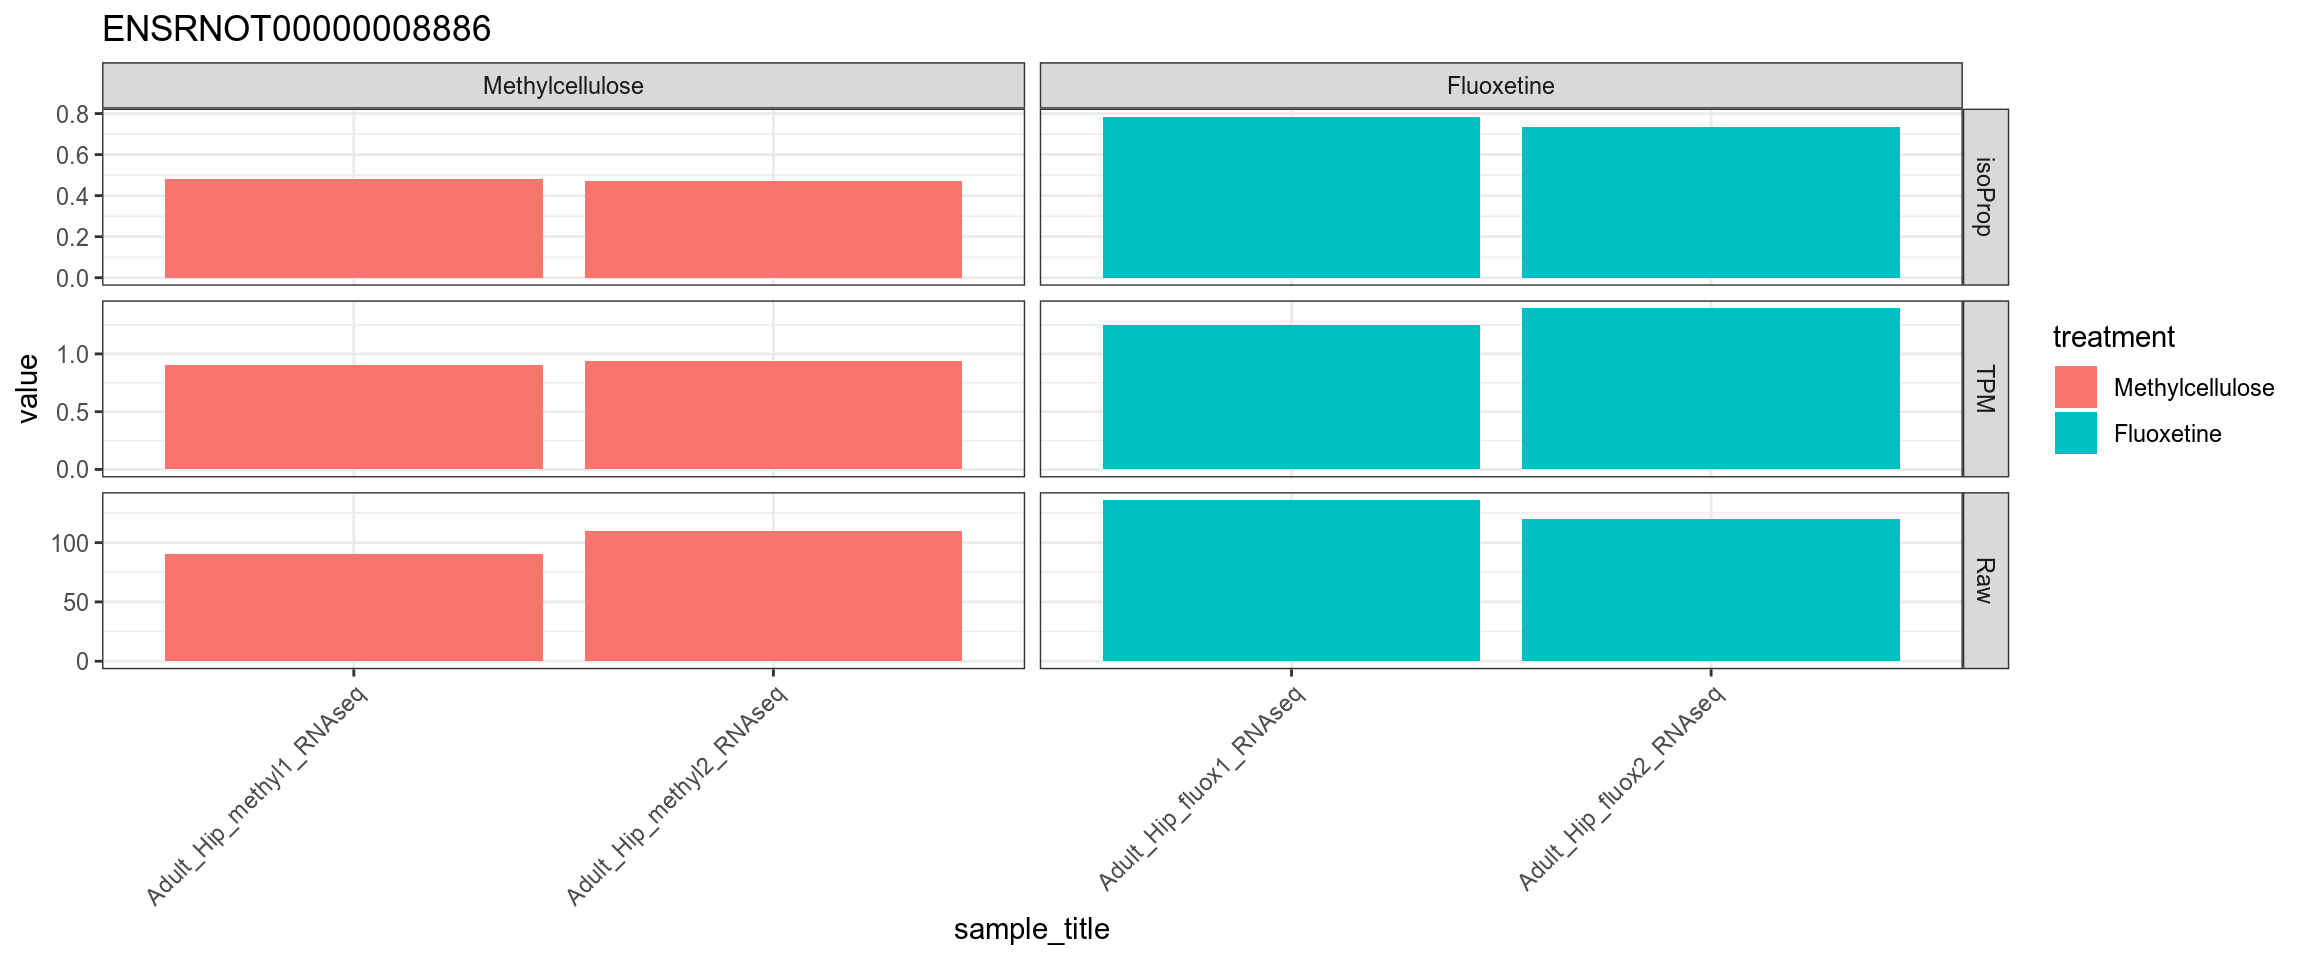
Figure 4.9: TPM, isoform proportion and raw counts for the top upregulated isoform, for each sample, splitted by condition
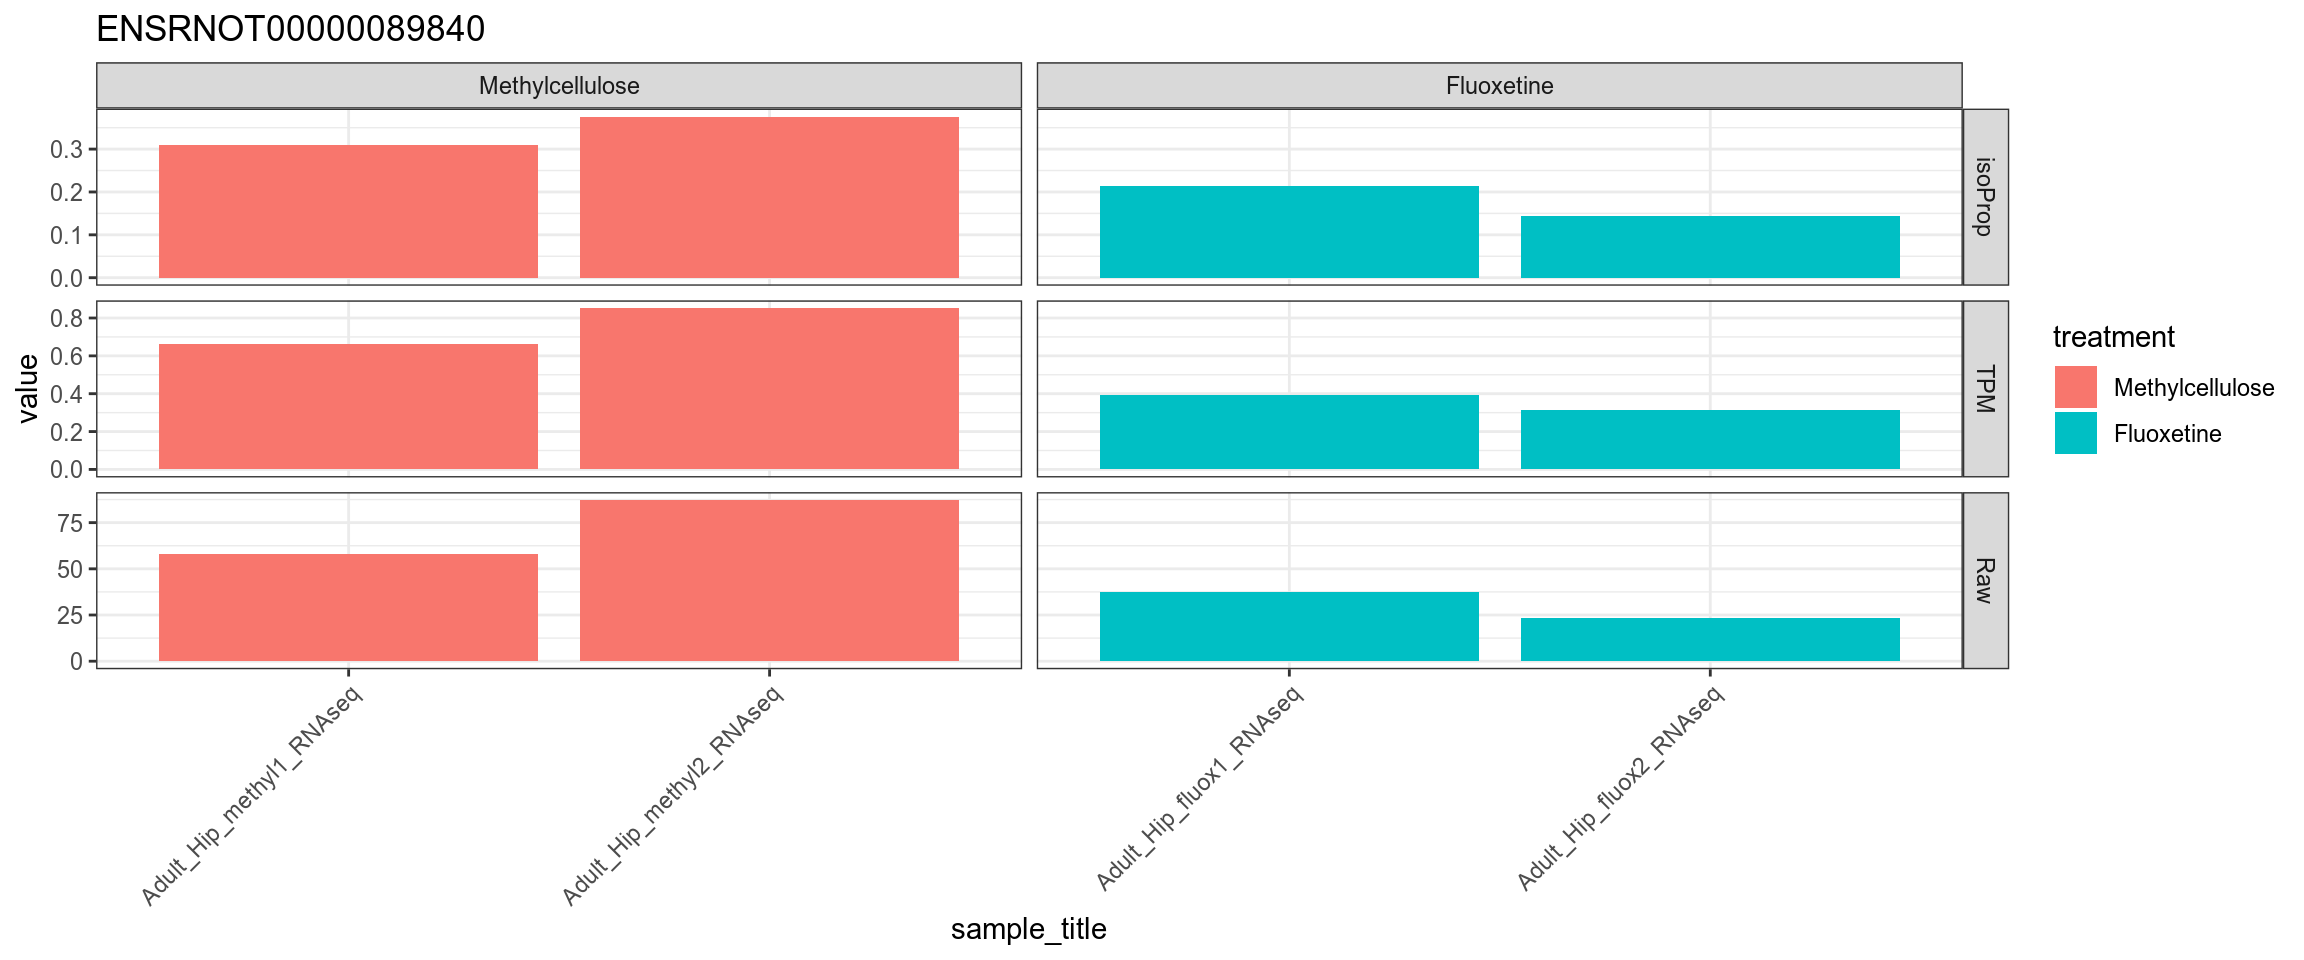
Figure 4.10: TPM, isoform proportion and raw counts for the top downregulated isoform, for each sample, splitted by condition
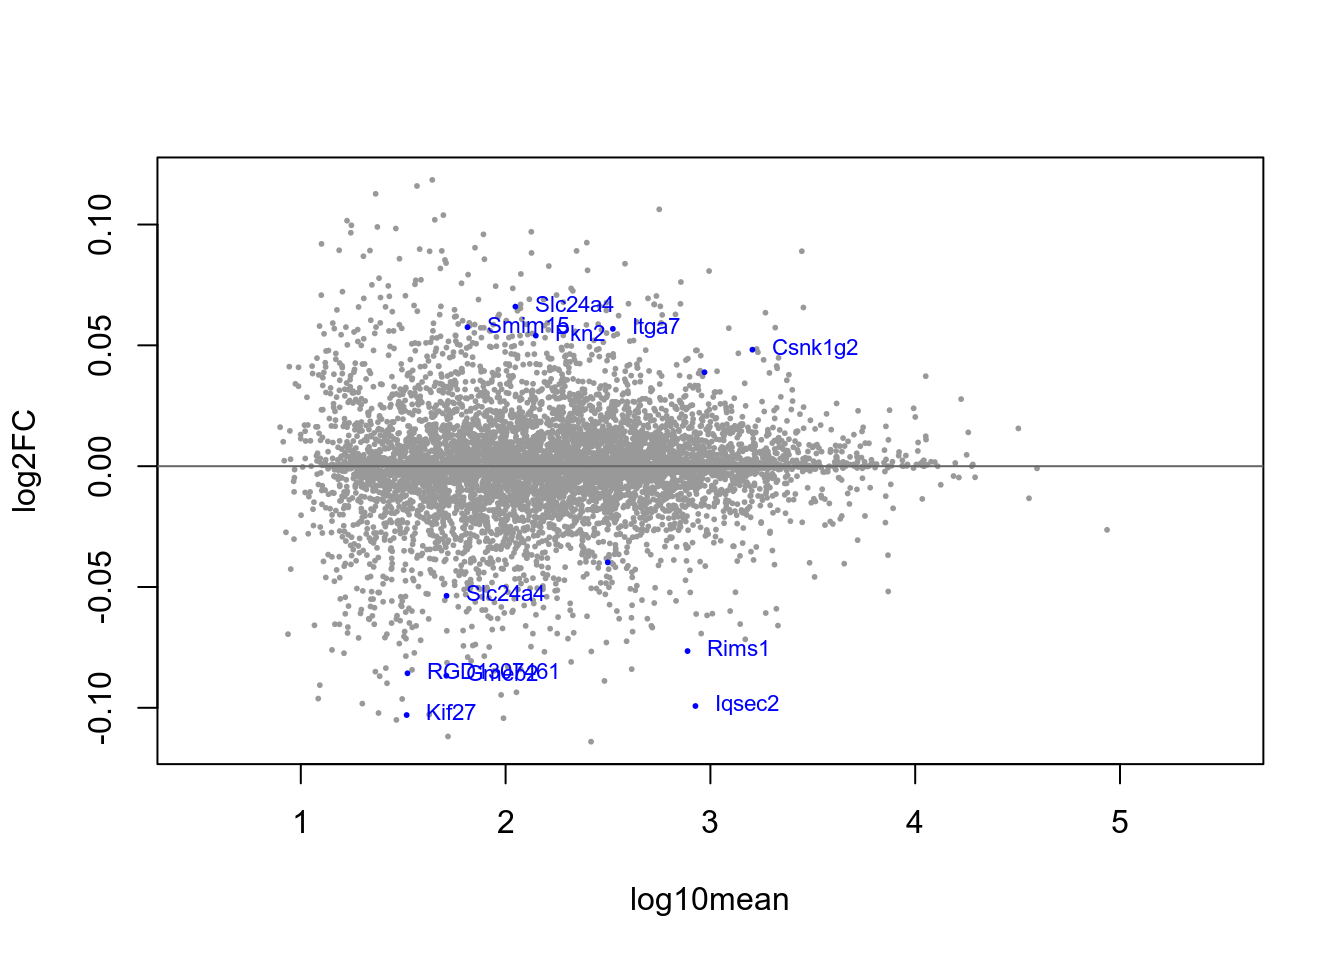
Figure 4.11: MA-plot with blue-highlighted genes corresponding to those with qvalue < 0.1