4.3.1 To closest human ortholog
4.3.1.1 Mouse Fluoxetine VS Control for Stressed in Dentate Gyrus
This section corresponds to the first meta-analysis requested by El Chérif.
| id | design |
|---|---|
| 1-GSE43261 | GSE43261-FluoxetineResponderVsControl |
| 2-GSE84185 | GSE84185-FluoxetineVsControlForStressedResponderInDentateGyrus |
| 3-GSE84185 | GSE84185-StressedFluoxetineVsStressedAloneInDentateGyrus |
| 4-SRP057486 | SRP057486-FluoxetineVsVehicleForBrainCA1StressedSubset |
| 5-Surget2009 | Surget2009-FluoxetineVsSalineForStressedInDentateGyrus |
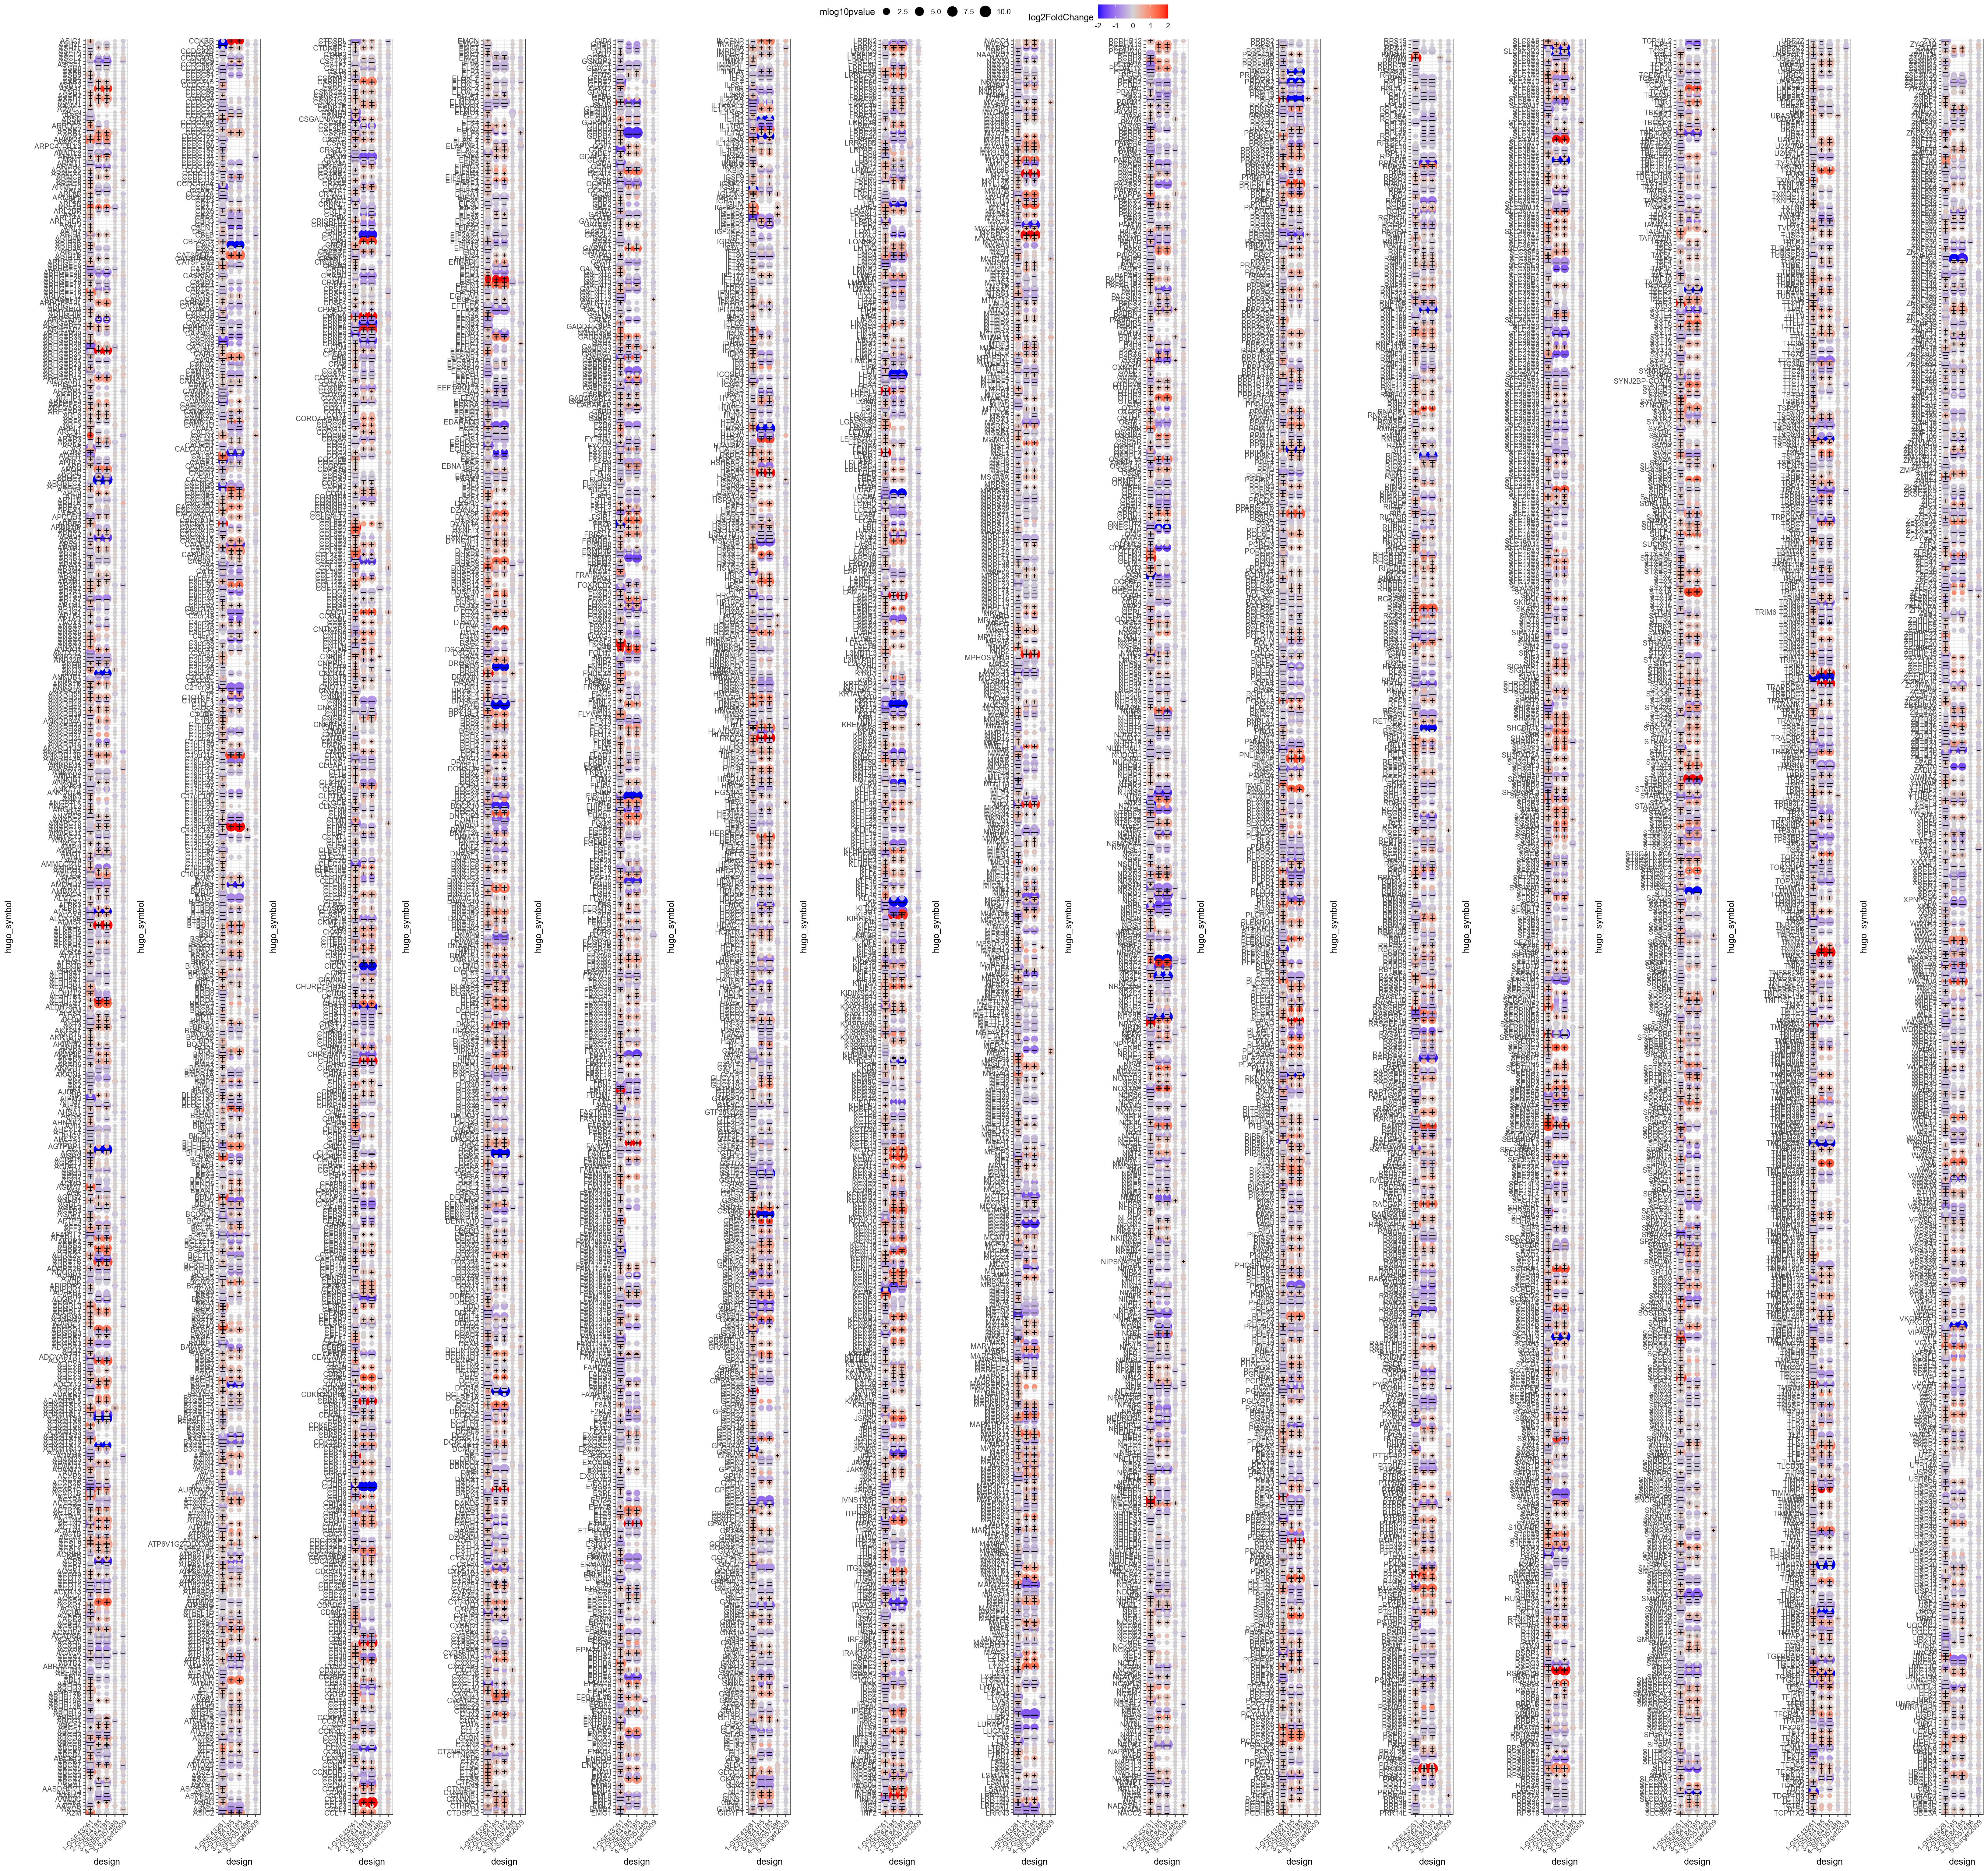
Figure 4.75: Alphabetically-sorted genes significant in at least one comparison (padj < 0.05). + and – signs highlight respectively upregulated and downregulated genes (|logFoldChange| > 0.1 and raw pvalue < 0.05).
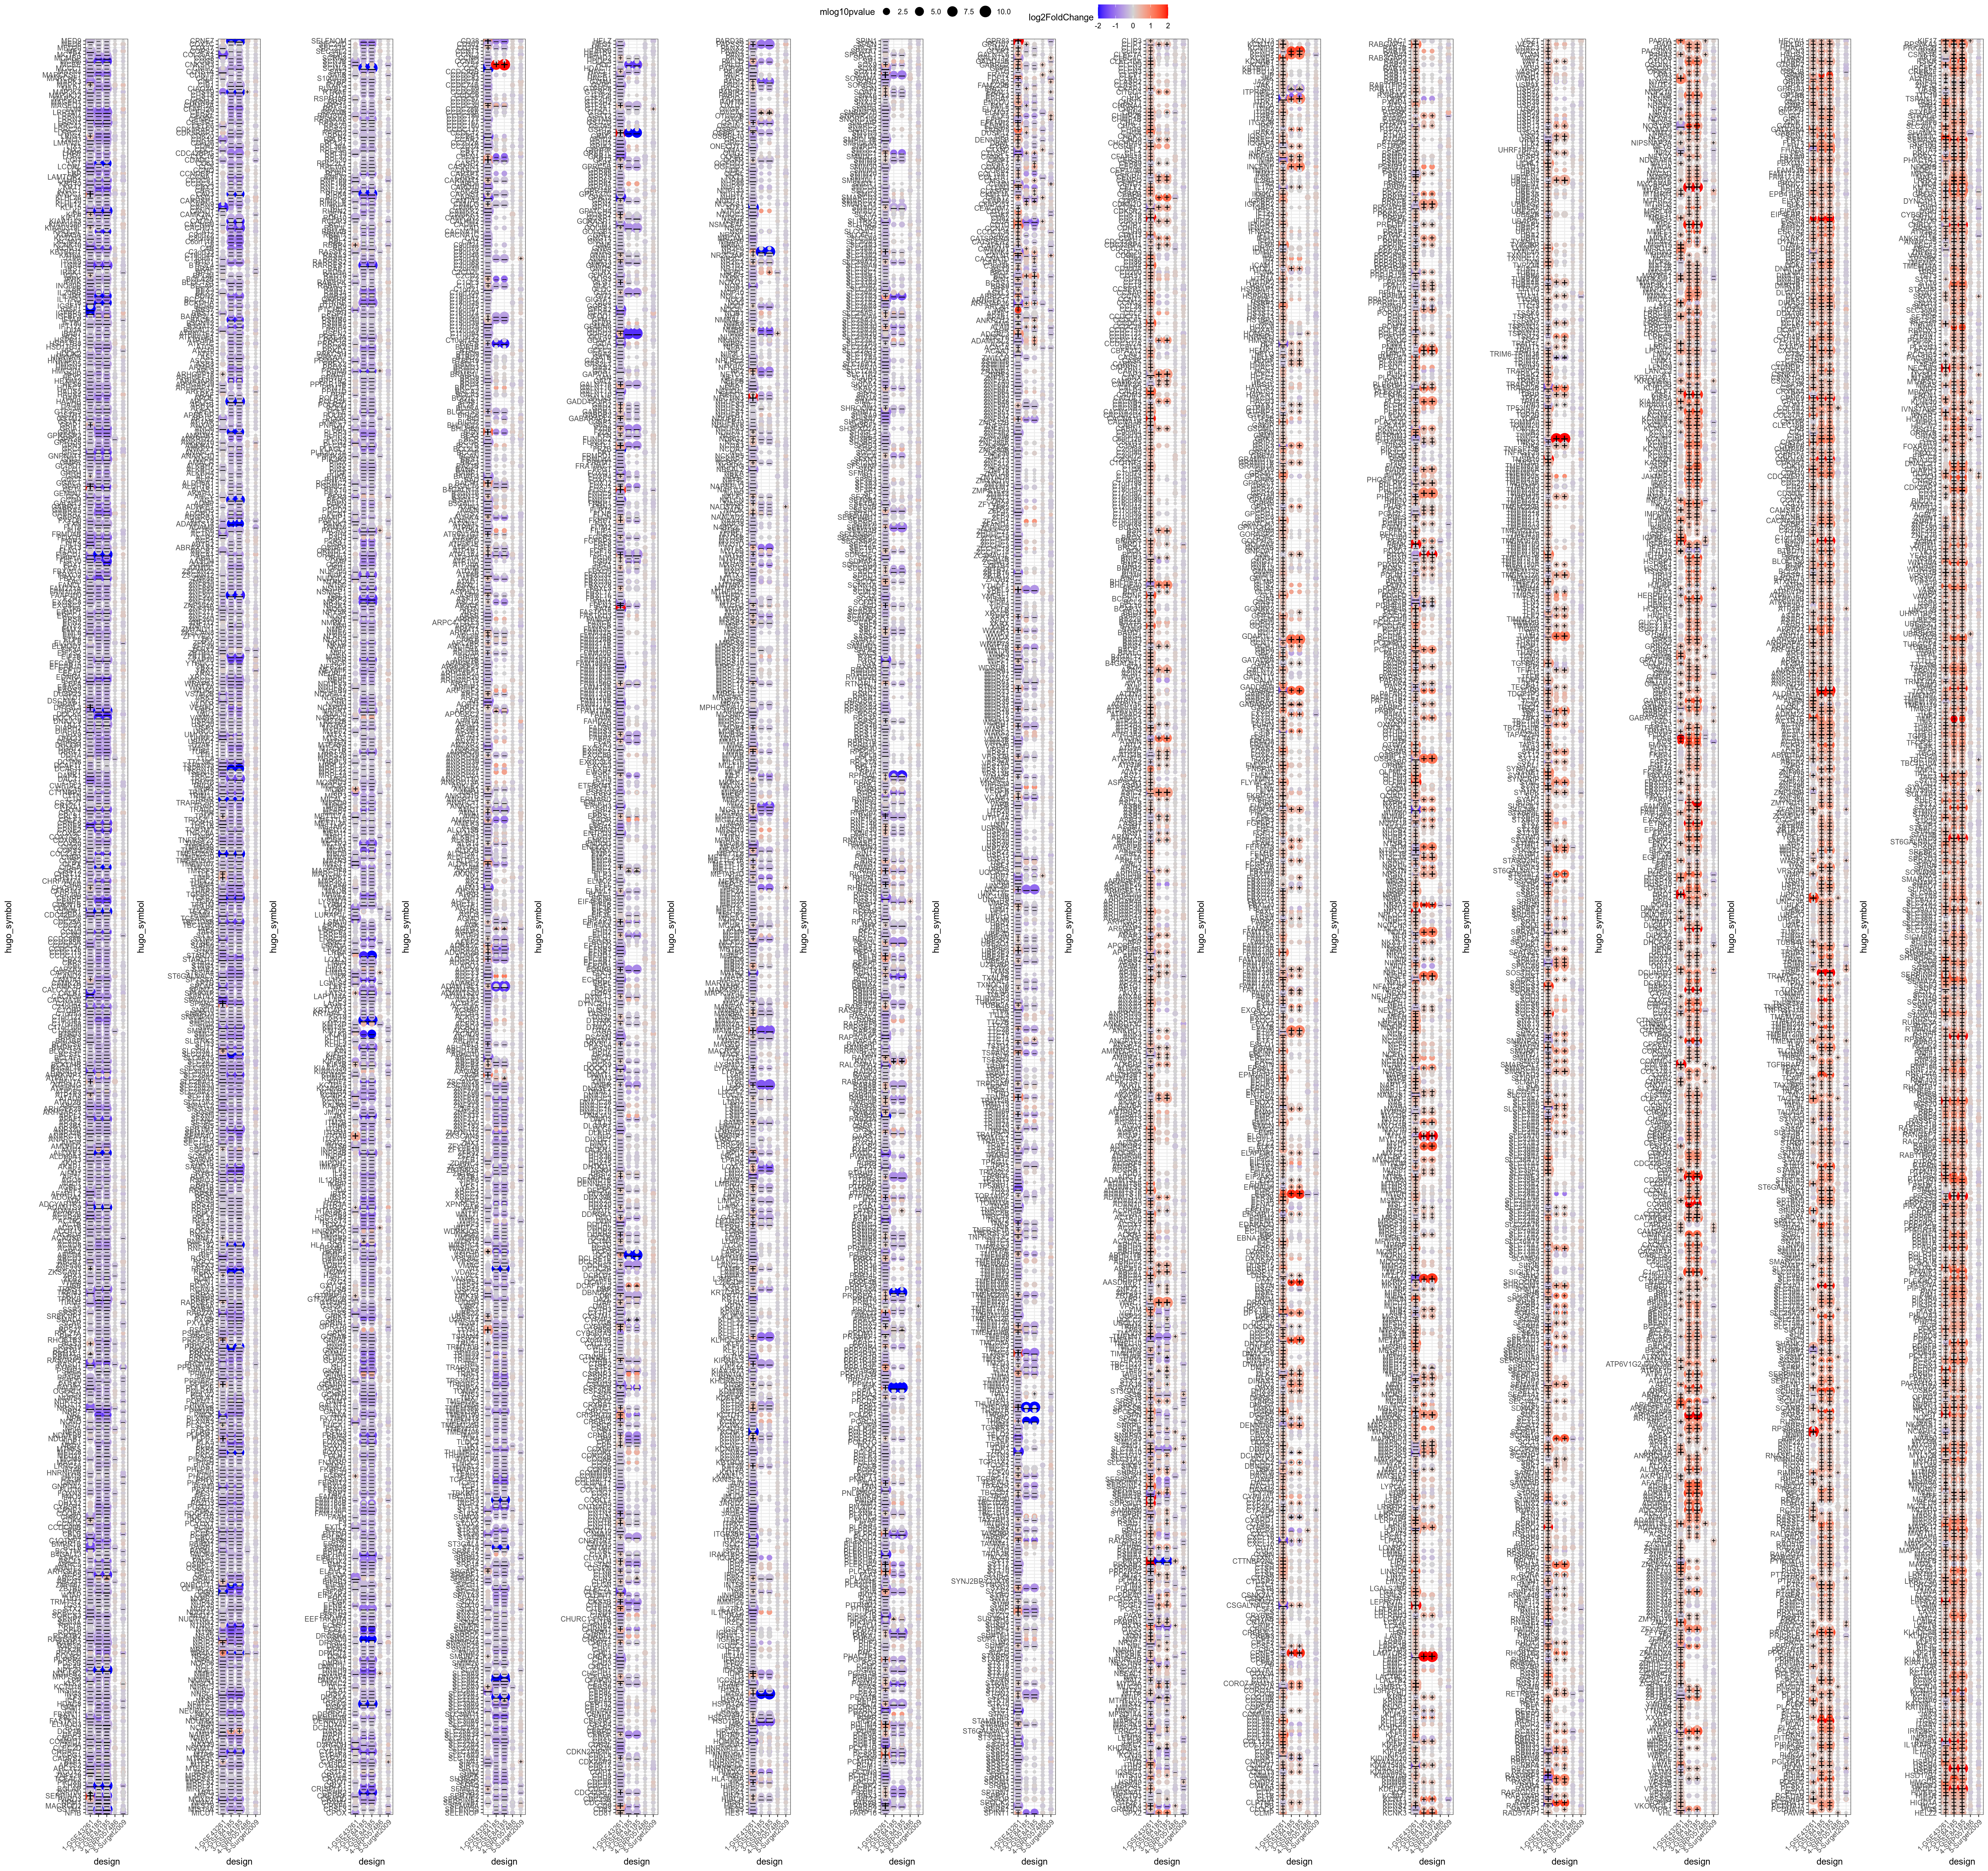
Figure 4.76: Consensus-sorted genes significant in at least one comparison (padj < 0.05). + and – signs highlight respectively upregulated and downregulated genes (|logFoldChange| > 0.1 and raw pvalue < 0.05).
](_main_files/figure-html/resultsIntegrationMouseFluoxetineVsControlForStressedConsensusPadj0p0001-1.png)
Figure 4.77: Consensus-sorted genes significant in at least one comparison (padj < 0.0001). + and – signs highlight respectively upregulated and downregulated genes (|logFoldChange| > 0.1 and raw pvalue < 0.05). Underlying table is available here